


























See the pipeline. Beat the clock.
Firm analytics without the spreadsheet. Fourteen live widgets — pipeline, turnaround, team, money — built from the jobs already running through your account. Nothing to import, nothing to reconcile, and your report turnaround on the board where the rate ladder can reward it.
How the board fills itself
You never feed it. You just read it.
Most firm analytics dies the month someone stops updating the spreadsheet. Performance has no spreadsheet to stop updating — it is the reporting surface of the account you already work in.
The work happens where it always happens
Enquiries land and convert in the Bookings CRM, appointments sit in Calendars & Requests, calls run through Telephony, and finished reports are released to clients through the document system. Every one of those events is already a timestamped record — Performance simply reads them back to you.
Open Performance — the page is instant, the widgets stream in
The board renders immediately and each of the fourteen widgets then loads independently through its own endpoint. A slow query on one widget never blocks the rest — the key metrics are readable while the heatmap is still thinking. It is the difference between a dashboard you glance at daily and one you open twice a year.
Pick a range — the charts regroup themselves
Ten presets from today to all time, plus fully custom dates. The grouping adapts to the span: a day or two charts hourly, up to a couple of months charts daily, anything longer charts monthly — so a 12-month revenue trend never arrives as 365 unreadable slivers.
The previous period comes along automatically
Whatever range you choose, the key metrics are computed twice — once for your period and once for the identical span immediately before it. "Is this month good?" stops being a feeling: leads, revenue, conversion and refunds all carry their own like-for-like comparison without anyone building a second tab.
Cut it by product when the question needs it
A product filter narrows the six pipeline-and-money widgets — key metrics, both trends, the status breakdown, the funnel and enquiry-to-booking time — to any subset of your catalogue. Level 2 against Level 3, or one niche product on its own. The filter can only ever select within your firm's own products.
Five-minute cache, one-tap refresh
Every widget result is cached for five minutes per firm, per range, per filter, so the board stays fast however often you open it. Need this second's truth — a payment that just landed, a report just released? The refresh button clears the cache for exactly what you're looking at and pulls it live.
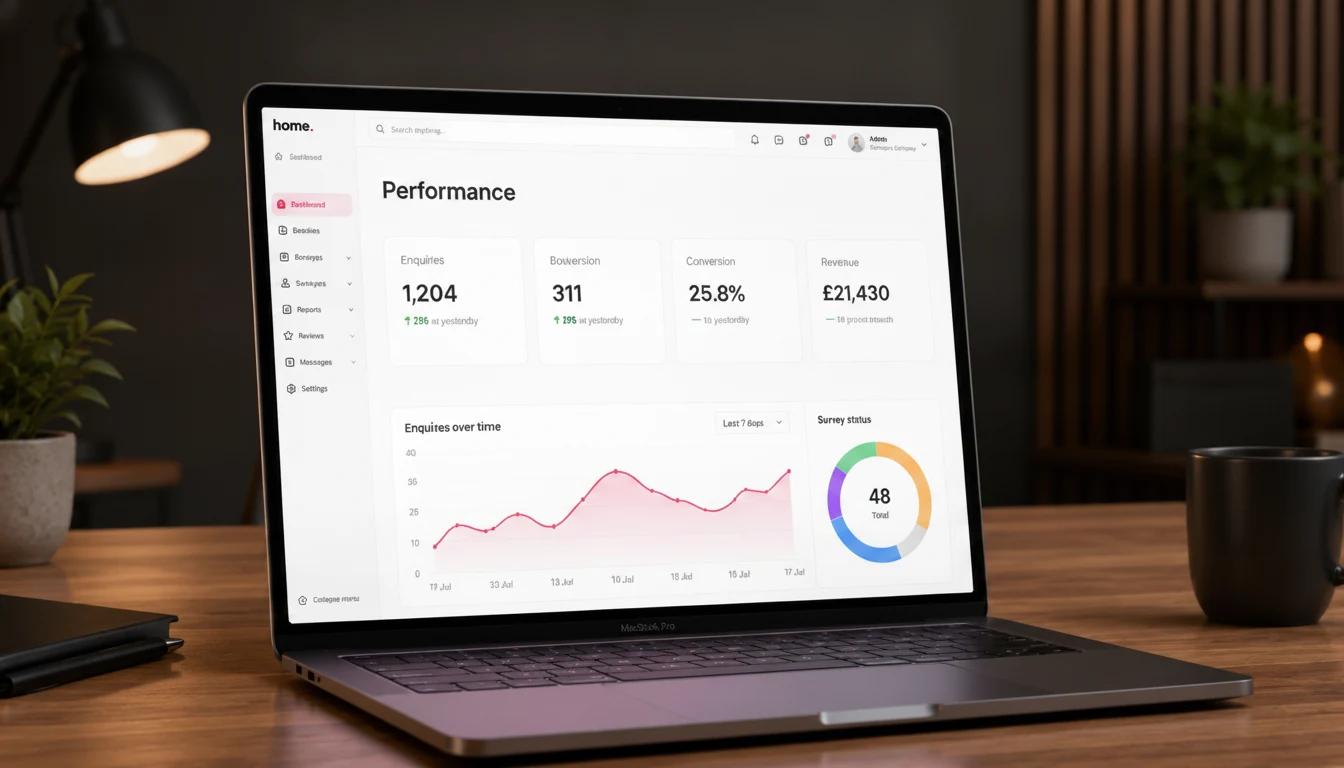
The Performance board — headline metrics, enquiries over time and survey status, inside every verified surveyor account.
The morning glance
Open it with your coffee. Watch it wake up.
This is the shape of the board: tiles land first, each with its like-for-like delta, then the one every surveyor watches — the turnaround median — opens into its trend.
Leads
▲ +14 vs previous 90 days
Conversion
▲ +2.1 pts vs previous
Revenue (net of VAT)
▲ +£4,120 vs previous
Median turnaround
▼ −0.6 days — faster than the previous 90
The line every firm wants: a median drifting down as more reports go out on time. Yours is drawn from your own released documents — booking to client, nothing in between.
Illustrative sample data throughout — not your firm’s figures, and not benchmarks. We don’t publish industry averages; your board is built from your own jobs, and only you can see it.
The clock that pays
Booked to released, measured on every job.
No timer to start, no field to forget. The clock runs from the moment a job is booked to the moment the report reaches your client — then the job joins your distribution and moves your median.
Booking → released to client
Your distribution, not a single average
Every released report lands in one of five buckets, from under a day to fourteen days plus, with the firm’s median alongside. A median resists the one nightmare job that would wreck an average — and the buckets show whether you have a speed problem or an outlier problem, which need very different fixes.
Lever ④ of your rate, measured here — not by anyone’s stopwatch but your own.
Every fast job climbs the ladder
From 1 August 2026, fast turnarounds are lever ④ of the four that set your rate. There is no league table and no published target — the ladder reads the same booking-to-release median you see here, so the way up is simply to release reports sooner. See the full rate ladder.
Run your firm like an athlete runs a season
Not watched. Timed.
Athletes don’t resent the stopwatch — it’s theirs. Performance is the same instrument for a surveying firm: your own clock, your own splits, checked whenever it suits you.

1 · Your own clock
The stopwatch is yours
Nobody phones asking for numbers. The clock runs itself, job by job, and answers to you — the same discipline a personal best is built on.

2 · Between jobs
Check the splits from the car
Two minutes in the car park: has this morning’s enquiry been contacted, did yesterday’s report go out, is anything drifting past a week? Then drive on.

3 · Month end
Month end in minutes, not evenings
The month-end review is a date-range change: this month against last, revenue net of VAT, conversion, refunds, and the median — with no spreadsheet built the night before.
What’s on the board
Fourteen widgets. Every one earns its tile.
Money, pipeline, people, operations — each widget answers one question a firm owner actually asks, from data the firm already generated.
Pipeline conversion
Seven stages, counted the honest way.
A lead that completed has, by definition, passed through every earlier stage — so the funnel counts cumulatively from the right. Each stage shows how many leads got at least that far, which is what gives the funnel its true narrowing shape.
Where leads stall
A wide gap between quoted and accepted is a pricing conversation; between new and contacted it’s a response-time one. The funnel shows which conversation to have.
Front-of-funnel speed
Enquiry-to-booking time is bucketed from under an hour to fourteen days plus, with a median in hours — the speed that decides whether a job was ever yours to win.
Sources and products
Every lead carries its origin and product, so the same funnel can be read per channel or cut to Level 2 only, Level 3 only, or any mix of your catalogue.
Money at the end of it
Takings net of VAT with refunds counted and netted off explicitly — plus conversion measured both by count and by value, because they tell different stories.
Team performance
Seven measures per member. Zero extra admin.
Built for the Monday conversation, not the disciplinary file. Every column comes from work the team was already doing on the platform — nobody fills in a timesheet to feed it.
| Column | What it counts |
|---|---|
| Leads | Enquiries assigned to the member in the period |
| Booked | Their leads that reached booked, in progress or completed |
| Conversion | Booked as a share of leads handled — so a quiet month and a hard month look different, as they should |
| Revenue | Paid work on their leads, net of VAT |
| Tasks completed | Follow-ups, chases and admin closed off — the work that keeps a pipeline moving but never shows in a revenue column |
| Calls | Calls made and taken in the period |
| Talk time | Minutes actually spent talking to clients — effort that’s invisible in every spreadsheet |
Rows are sorted by revenue written. Pick any date range — this month for the team meeting, the quarter for reviews — and the same seven measures recompute for the span.
Honest by construction
Numbers you can take to the accountant.
A dashboard is only useful if you can trust it on a bad month. Performance makes the conservative call at every fork.
Net of VAT, everywhere
Every money figure — trends, key metrics, quoted values, per-product and per-member revenue — is reported net of VAT. Your board matches your accounts instead of flattering them by a fifth.
Refunds counted, not hidden
Refund count, refund value and refund rate sit right beside revenue in the key metrics. A month with heavy refunds looks like one — which is exactly when you need to know.
Medians, not means
Turnaround and enquiry-to-booking report the median, so one nightmare job with restricted access can’t wreck the headline — while the buckets still show you the outliers.
Quiet weeks stay visible
Chart series are zero-filled across your range. A week with no leads plots as zero rather than being silently skipped — the difference between a dip you can see and one you discover later.
Like-for-like comparison
The previous period is always the identical span immediately before yours — 90 days against the 90 before, never a mismatched month against a quarter.
Firm-scoped, no league tables
Every query is scoped to your firm and the cache is per-firm too. No cross-firm rankings, no published benchmarks — the only firm you’re compared against is last period’s you.
In practice
Six questions it answers before you finish asking.
“Who needs support this month?”
One member’s conversion has dipped while their lead count doubled — that’s an overload problem, not a performance one. Shift the workload before it shows up in reviews.
Team performance
“Which channel actually fills the funnel?”
Sources shows where leads originate; product mix shows what they buy. Together they tell you which channel sends the work worth having — and which just fills the inbox.
Lead sources · Product mix
“Where are jobs stalling?”
The funnel narrows sharply between quoted and accepted; the status breakdown names the leads sitting there. You’re chasing specific quotes by lunchtime, not auditing a spreadsheet at month end.
Pipeline funnel · Status breakdown
“What did we really take last month?”
Revenue net of VAT, refunds netted off, average payment and both conversion rates — against the previous month, computed the same way. The accountant’s answer, without the accountant’s wait.
Key metrics
“Are we answering the phone?”
Inbound answer rate, call volumes both ways, average duration and cost. If the answer rate sags on Thursdays, the heatmap will usually tell you why.
Calls overview
“When should the phones be staffed?”
The heatmap plots enquiries by weekday and hour. If Tuesday 9–11am is your rush, that’s when cover matters — and the quiet Friday afternoon is when the write-ups happen.
Weekday heatmap
Lever ④
Fast turnarounds set your rate.
From 1 August 2026 four levers set your rate on both Homemove panel work and private bookings: a live diary, a pipeline running through our CRM, reports written on our tech, and fast turnarounds. Lever ④ is measured by exactly what the report-turnaround widget shows — your firm’s booking-to-release median. You can’t deliver fast turnarounds you can’t see; Performance is where you see them. The rate ladder on the Join page shows how much each lever moves.
The two levers compound from the same account: writing your report on Otto is lever ③ and collapses the write-up from days to minutes, which is the single biggest cut you can make to the booking-to-release interval lever ④ measures. Keep the pipeline in the Bookings CRM and the diary in Calendars & Requests, and all four levers feed themselves.
How it compares
Performance vs the spreadsheet.
Most surveying firms run on a spreadsheet someone maintains on Sunday nights — or on memory. Here’s what changes.
| What you need to know | Performance | Gut feel |
|---|---|---|
| Where the numbers come from | Live from your jobs | Impressions |
| Report turnaround | Median + distribution, every period | “Pretty quick, usually” |
| Previous-period comparison | Automatic, like-for-like span | — |
| Team view | Seven measures per member | Loudest voice wins |
| Cut by date and product | Two clicks | — |
| When a job stalls | Visible in the funnel today | Found when the client calls |
| Effort to keep it current | None — it feeds itself | None, but wrong |
Part of the toolkit
Every tool you use feeds a widget.
Performance measures the work that runs through the rest of the operating system. The more of these you use, the more of the board lights up.
Bookings CRM
The source of the pipeline itself — leads, statuses, bookings and assignments. Feeds the funnel, the status breakdown, key metrics and the team view.
Otto — AI report writer
The single biggest lever on your turnaround median: dictation to finished editable draft in minutes, so reports release days sooner.
Telephony
Calls run through the platform’s phone system — which is what makes the calls overview, answer rate and per-member talk time possible.
Calendars & Requests
The live diary (lever ①) whose bookings start the turnaround clock — and the enquiry-to-booking timer before it.
Payments
Every payment and refund lands as a transaction — the raw material of the revenue trend, key metrics and per-product takings.
Reviews & badges
Feedback collected on completed jobs powers the customer feedback widget — ratings, NPS and recent comments on the same board as the money.
Getting started
There is no setup. There’s just switching it on.
Performance has no configuration screen, no data import and no template to build. Analytics is on by default for every verified firm.
Claim your firm
Most RICS-regulated firms are already listed — search by name or postcode and claim yours. Verification unlocks the full toolkit, Performance included.
Run the work through the platform
Take enquiries in the CRM, book them into the diary, release reports through documents, make calls on Telephony. Nothing extra — this is just the toolkit doing its day job.
Open Performance
The board fills itself from day one — the first enquiry starts the lead trend, the first released report starts your median. Every week it gets more useful.
FAQ
Common questions about Performance
What it tracks
What does the Performance dashboard actually track?
Fourteen live widgets, each grounded in the jobs already running through your account: headline metrics against the previous period, revenue and lead trends, a status breakdown, the pipeline funnel, enquiry-to-booking time, lead sources, product mix, panel performance, team performance, report turnaround, a calls overview, a weekday enquiry heatmap and customer feedback scores. Every widget filters by date range, and the pipeline and money widgets filter by product too.
What date ranges can I filter by?
Ten presets — today, yesterday, this week, the last 7 days, this month, last month, the last 90 days, the last 12 months, all time — plus a fully custom start and end date. Chart grouping adapts to the span automatically: ranges up to two days are charted hourly, up to about two months daily, and anything longer monthly, so a year of revenue never arrives as 365 unreadable slivers.
Which widgets does the product filter apply to?
The product filter narrows the six pipeline-and-money widgets: key metrics, the revenue trend, the lead trend, the status breakdown, the pipeline funnel and enquiry-to-booking time. The remaining widgets are deliberately firm-wide cuts. The filter only ever selects within your own product catalogue — you cannot accidentally query someone else's products.
What is the pipeline funnel actually counting?
Seven stages — new, contacted, quoted, quote accepted, booked, in progress, completed. The funnel counts cumulatively from the right: a lead that reached completion has, by definition, passed through every earlier stage, so each stage shows how many leads got at least that far. That is what gives the funnel its honest narrowing shape rather than a bar chart of wherever leads happen to sit today.
Turnaround & the rate ladder
How is report turnaround measured?
The clock starts the moment a job is booked and stops the moment the report document is released to your client. Each job lands in a distribution — under a day, one to three days, three to seven, seven to fourteen, or longer — and the dashboard shows your firm's median for the period. We do not publish industry averages or set a fixed target; the rate ladder simply rewards firms that deliver quickly.
What counts as 'released' for turnaround purposes?
The timestamp at which the report document is released to the customer through the platform — the moment the client can actually read it — not when a draft was saved or a PDF was generated internally. Only released documents inside the selected period are counted, and any invalid negative interval is excluded rather than skewing your median.
How does turnaround affect my rate?
From 1 August 2026 four levers set your rate on both Homemove panel work and private bookings: a live diary, a pipeline running through our CRM, reports written on our tech, and fast turnarounds. Fast turnarounds are lever ④, and the report turnaround widget is where it is measured — your own booking-to-release median, not a league table. The rate ladder on the Join page shows how much each lever moves.
What is the fastest way to improve my turnaround median?
Shorten the write-up, not the inspection. Writing the report on Otto takes you from dictation to a finished editable draft in minutes rather than days, which collapses the booking-to-release interval that the widget measures. Beyond that, the funnel and status breakdown show which jobs are drifting past a week so you can chase the outliers that drag the median.
Team & privacy
Is team performance about watching my surveyors?
It is built for coaching, not surveillance. For each team member you see leads handled, bookings won, conversion, revenue written, tasks completed, calls made and talk time, over whatever date range you choose. It exists to answer useful questions — who needs support this month, where jobs are stalling, where the workload actually sits — rather than to log anyone's every move.
What exactly does each team member's row show?
Seven measures per member: leads assigned to them in the period, how many of those reached booked or beyond, the conversion rate that implies, revenue written net of VAT, CRM tasks completed, calls made and minutes of talk time. Rows are sorted by revenue written. Everything is derived from work they were already doing on the platform — there is nothing extra for anyone to fill in.
Can other firms see my numbers?
No. Every widget queries only your own firm's leads, bookings, documents and calls — the reporting layer is firm-scoped at the query level, and the cache is per-firm too. There are no cross-firm league tables, no published benchmarks and no comparative rankings anywhere in the product.
Data, freshness & pricing
Do I need to import data or keep a spreadsheet going?
No. Performance is generated from the work already flowing through the platform — bookings in the CRM, your diary, documents released to clients and calls through the phone system. There is nothing to export, upload or reconcile; figures are cached for a few minutes at most, and a refresh button pulls the very latest numbers on demand.
How fresh are the figures?
Each widget's result is cached for five minutes per firm, per date range, per filter — so the board loads instantly even on a long range. The refresh button clears the cache for what you are looking at and pulls the very latest numbers on demand. Chart series are zero-filled across the range, so a quiet week shows as a real zero rather than silently disappearing from the axis.
Are the revenue figures inclusive of VAT?
No — every money figure on the board is net of VAT: the revenue trend, key metrics, quoted values, per-product revenue and per-member revenue written. That makes the numbers comparable with your accounts rather than flattering them by a fifth. Refunds are counted and netted off explicitly, with the refund rate shown alongside.
Is Performance included with my listing?
Yes. Performance is part of every RICS-regulated firm's verified Home.co.uk listing — analytics is switched on by default for surveyor accounts, with no separate subscription and nothing to install. Search for your firm on the surveyor directory to check whether your listing is already live, or register your firm to get access.
More tools
Explore the rest of the surveyor toolkit

Home Academy
Short lessons on Home tools
Learn the steps, try the real tools and follow a first-week path to your first Otto report.

Otto
AI auto-mode RICS report writer
Dictate on-site, upload photos, get a finished, fully-routed Level 2 or Level 3 report in minutes.

Level 2 Report Writer
RICS Home Survey Level 2
Field-by-field RICS Level 2 reports with inline AI suggestions, image gallery, comparables and one-click branded PDF.

Level 3 Report Writer
RICS Building Survey Level 3
Comprehensive Level 3 Building Survey reports with deep technical sections, custom rating scales and AI legal-adviser notes.

Surveyor Comparable Tool
Sold + rental comps in one click
Auto-fetch sold and rental comparables within a 1-mile radius, weighted valuation range, branded PDF appendix for any survey.

Snagging Report Builder
New-build defect tracker
Build professional new-build snagging lists with location-based defect tracking, photos, urgency, status and PDF export.

Schedule of Condition
Room by room, photo by photo
A dated record of a property's condition, every elevation and every room, dictated on site with numbered photos referenced for you and a branded PDF. No ratings, no advice.

AI Dictation
Voice-to-fields routing
Speak observations on-site; AI routes every sentence to the correct RICS field with confidence scores and replayable audio.

Image AI
Auto-categorise survey photos
Upload up to 200 photos; vision AI tags each to the right RICS element, rates condition, extracts defects and picks the best 35 for the report.
Style Profile
Your firm's writing fingerprint
Teach the AI to write like your firm — upload past reports, the AI extracts a 25-dimension writing fingerprint and applies it to every future auto-mode report.

Property Viewer
Pre-survey property intelligence
Look up any UK property and instantly see EPC, energy renovation costs, broadband coverage, environmental risks (flood, radon, mining, landfill), invasive plants, sales history and listing status — all in one dashboard.

Property Data Drawer
EPC + risks + comps in one panel
Open the property data drawer in any report to see EPC, environmental risks, listing history and comparables — copy-paste ready.

Standard Phrases
Reusable language library
Personal, firm-wide and industry-preset phrase libraries — insert with one click and use to train AI routing for voice consistency.

RICS Standards Check
A Home Survey Standard check before you sign
One-click AI check against the RICS Home Survey Standard — flags missing content, weak ratings and structural gaps before you sign the report.

Quote Builder
Clear choices, a date to decide
Send branded survey quotes with up to three options, a PDF and an expiry date. Reuse service templates, track responses and see your win rate.

Home Payments
Paid faster, no invoicing
Home Payments mission control — customers pay at booking through a Stripe-verified checkout, payouts land on a schedule you can see, payment links cover your private work, and there is no invoice chasing ever again.

Bookings CRM
Every job, one pipeline
The surveyor CRM built into the platform — Homemove jobs land pre-paid with customer and property attached, enquiries convert to bookings, and the whole pipeline runs from one screen.

Panel work
Every panel job, every deadline
Run jobs from the other panels you work for beside your own. List each panel with its usual fee and turnaround, add a job in under a minute, and watch every report deadline count down.

Calendars & Requests
A diary that fills itself
Per-surveyor diaries with live availability — keep your dates current and we book real jobs straight in, with inbound availability requests answered in a tap.

The firm inbox that knows the job
A full mail client scoped to your firm — @home.uk purpose mailboxes and per-user addresses, with every thread landing against the booking it belongs to.

Documents & e-sign
Signed before you set foot on site
Terms of engagement sent with the booking, tracked from sent to signed, chased automatically and stored against the job — no more chasing clients to sign.

Insurance & conflict checks
Safe to take the job
Every new job is checked against your firm's own history, so you know when you have surveyed a property before. Your PI insurance is tracked with reminders, and new reports can't be issued once recorded cover has lapsed.

Telephony
The firm number that never misses a job
A phone system built into the platform — take calls in the browser, forward to mobiles, ring the whole team at once, and keep a shared call log with optional recording.

Customer portal
Your client, never in the dark
A white-label portal under your firm's branding and domain — booking status, reminders and secure report delivery, so customers stop asking where things are.

Website builder
Built by asking, not designing
A firm website built and edited by talking to Inigo — brand and theme sync, a real section library, custom domains via CNAME, and enquiries that land in your pipeline.

Campaigns
Win the next job from the last one
Firm email campaigns with per-recipient tracking — sends, opens, clicks and read time — built on consented lists with one-click unsubscribe handled for you.

Reviews & badges
Proof that wins the next booking
Reviews earned on real completed jobs — scored by the homemover, shown on your directory profile — plus embeddable trust badges that carry the proof to your own website.

Inigo
The AI assistant for surveyors
Ask in chat, dictate by voice, or click any element for contextual help — grounded answers on valuations, sales history and market data, inside the platform.

AI Training
Teach it your standard
Upload past reports and press Train — the AI learns your firm's defect language, ratings philosophy and phrasing, and Otto writes with it on every job.

Environmental Report
Every risk, one report
A one-click environmental risk report for any property — flood, ground stability, environmental factors and planning constraints, delivered as a PDF.
Free directory listing. Pay-as-you-go toolkit.
Every RICS-regulated surveying firm gets a verified profile, direct bookings from home.co.uk consumers and the surveyor toolkit included with the account. No subscription. No pay-per-lead. No commission on the job. Pay only when you use the premium AI tools.
2 minute setup · Verified against the RICS register · Trusted UK property platform since 1995