

























The words that cost property sales six weeks: pricing and time on market
We timed 2,142 home sales from listing to under offer. The strongest signal for time on market wasn't the photos, the floorplan or even the price. It was the two words printed next to it.
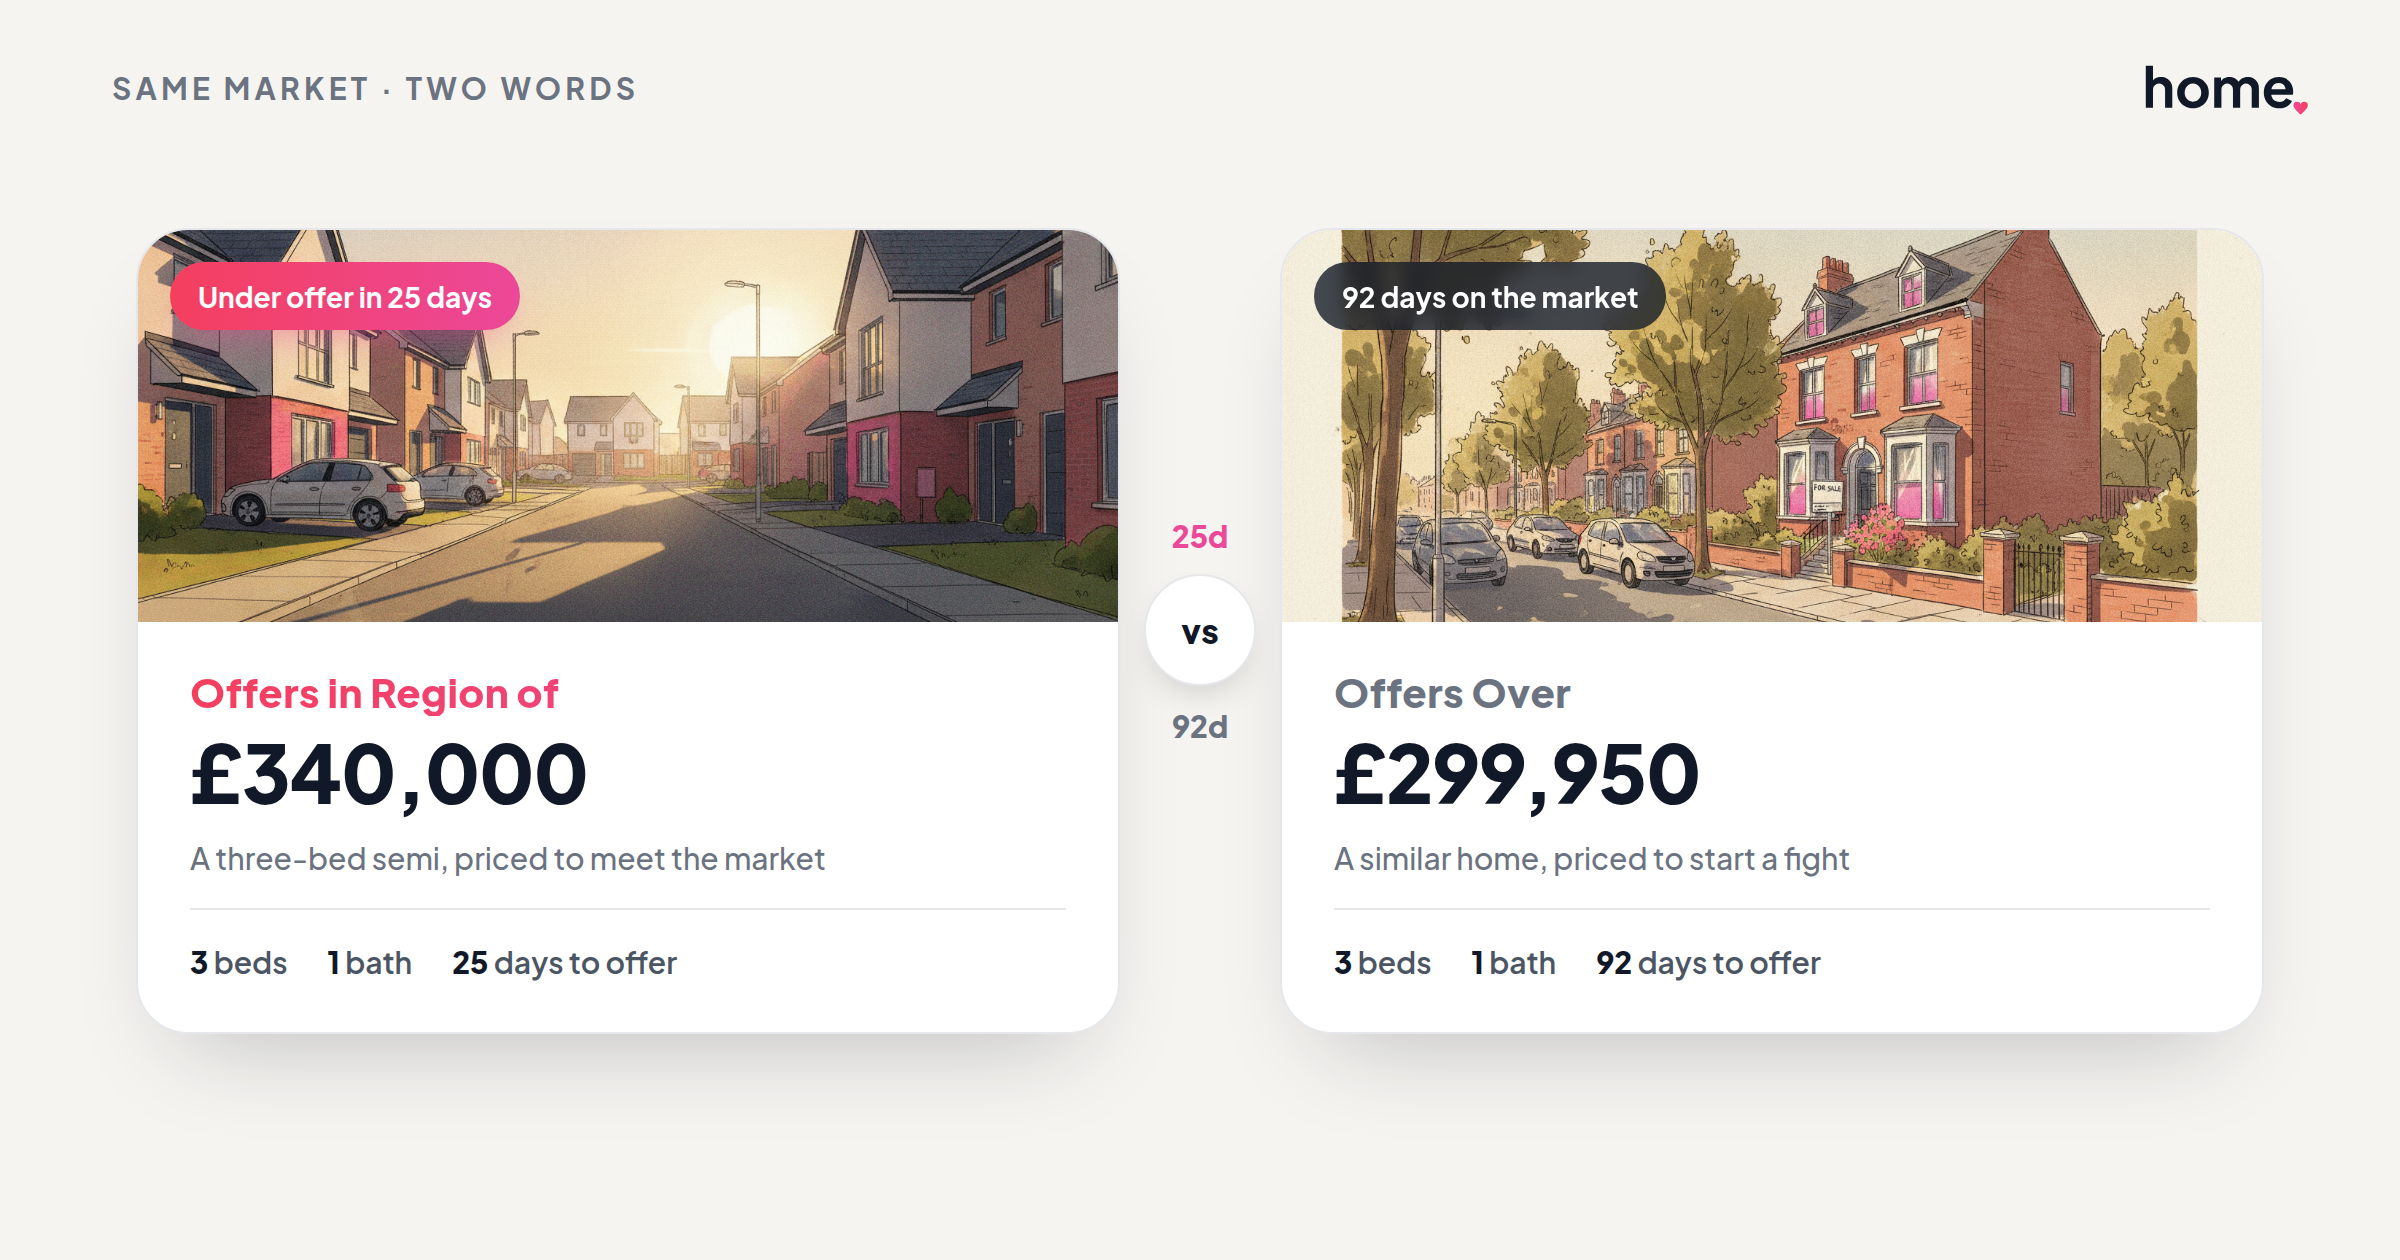
We timed 2,142 home sales from listing to under offer. The strongest signal for time on market wasn't the photos, the floorplan, or even the price. It was the two words printed next to it.
Ask a seller how long to sell a house and they'll say "a few weeks." Ask the data and it refuses to give a single number, because there isn't one. The median time to under offer is 51 days. The mean is 102. When the average is double the median, the average is misleading you: a long tail of slow sellers drags it up while most homes cluster near the front. Everything interesting is in which homes land where.
So we stopped asking "how long does a house take" and started asking "what separates the fast ones from the slow ones." The answer that jumped out of the data is not the one the industry sells you. National figures won't show it either, because HM Land Registry records the price a home sold for, not the days it spent on the market, so the pattern stays hidden in plain sight.
There is no average home
The fastest quarter of homes went under offer inside 18 days. The median took 51. The slowest quarter needed more than 106, and the slowest tenth sat at 312, a full year on the market.
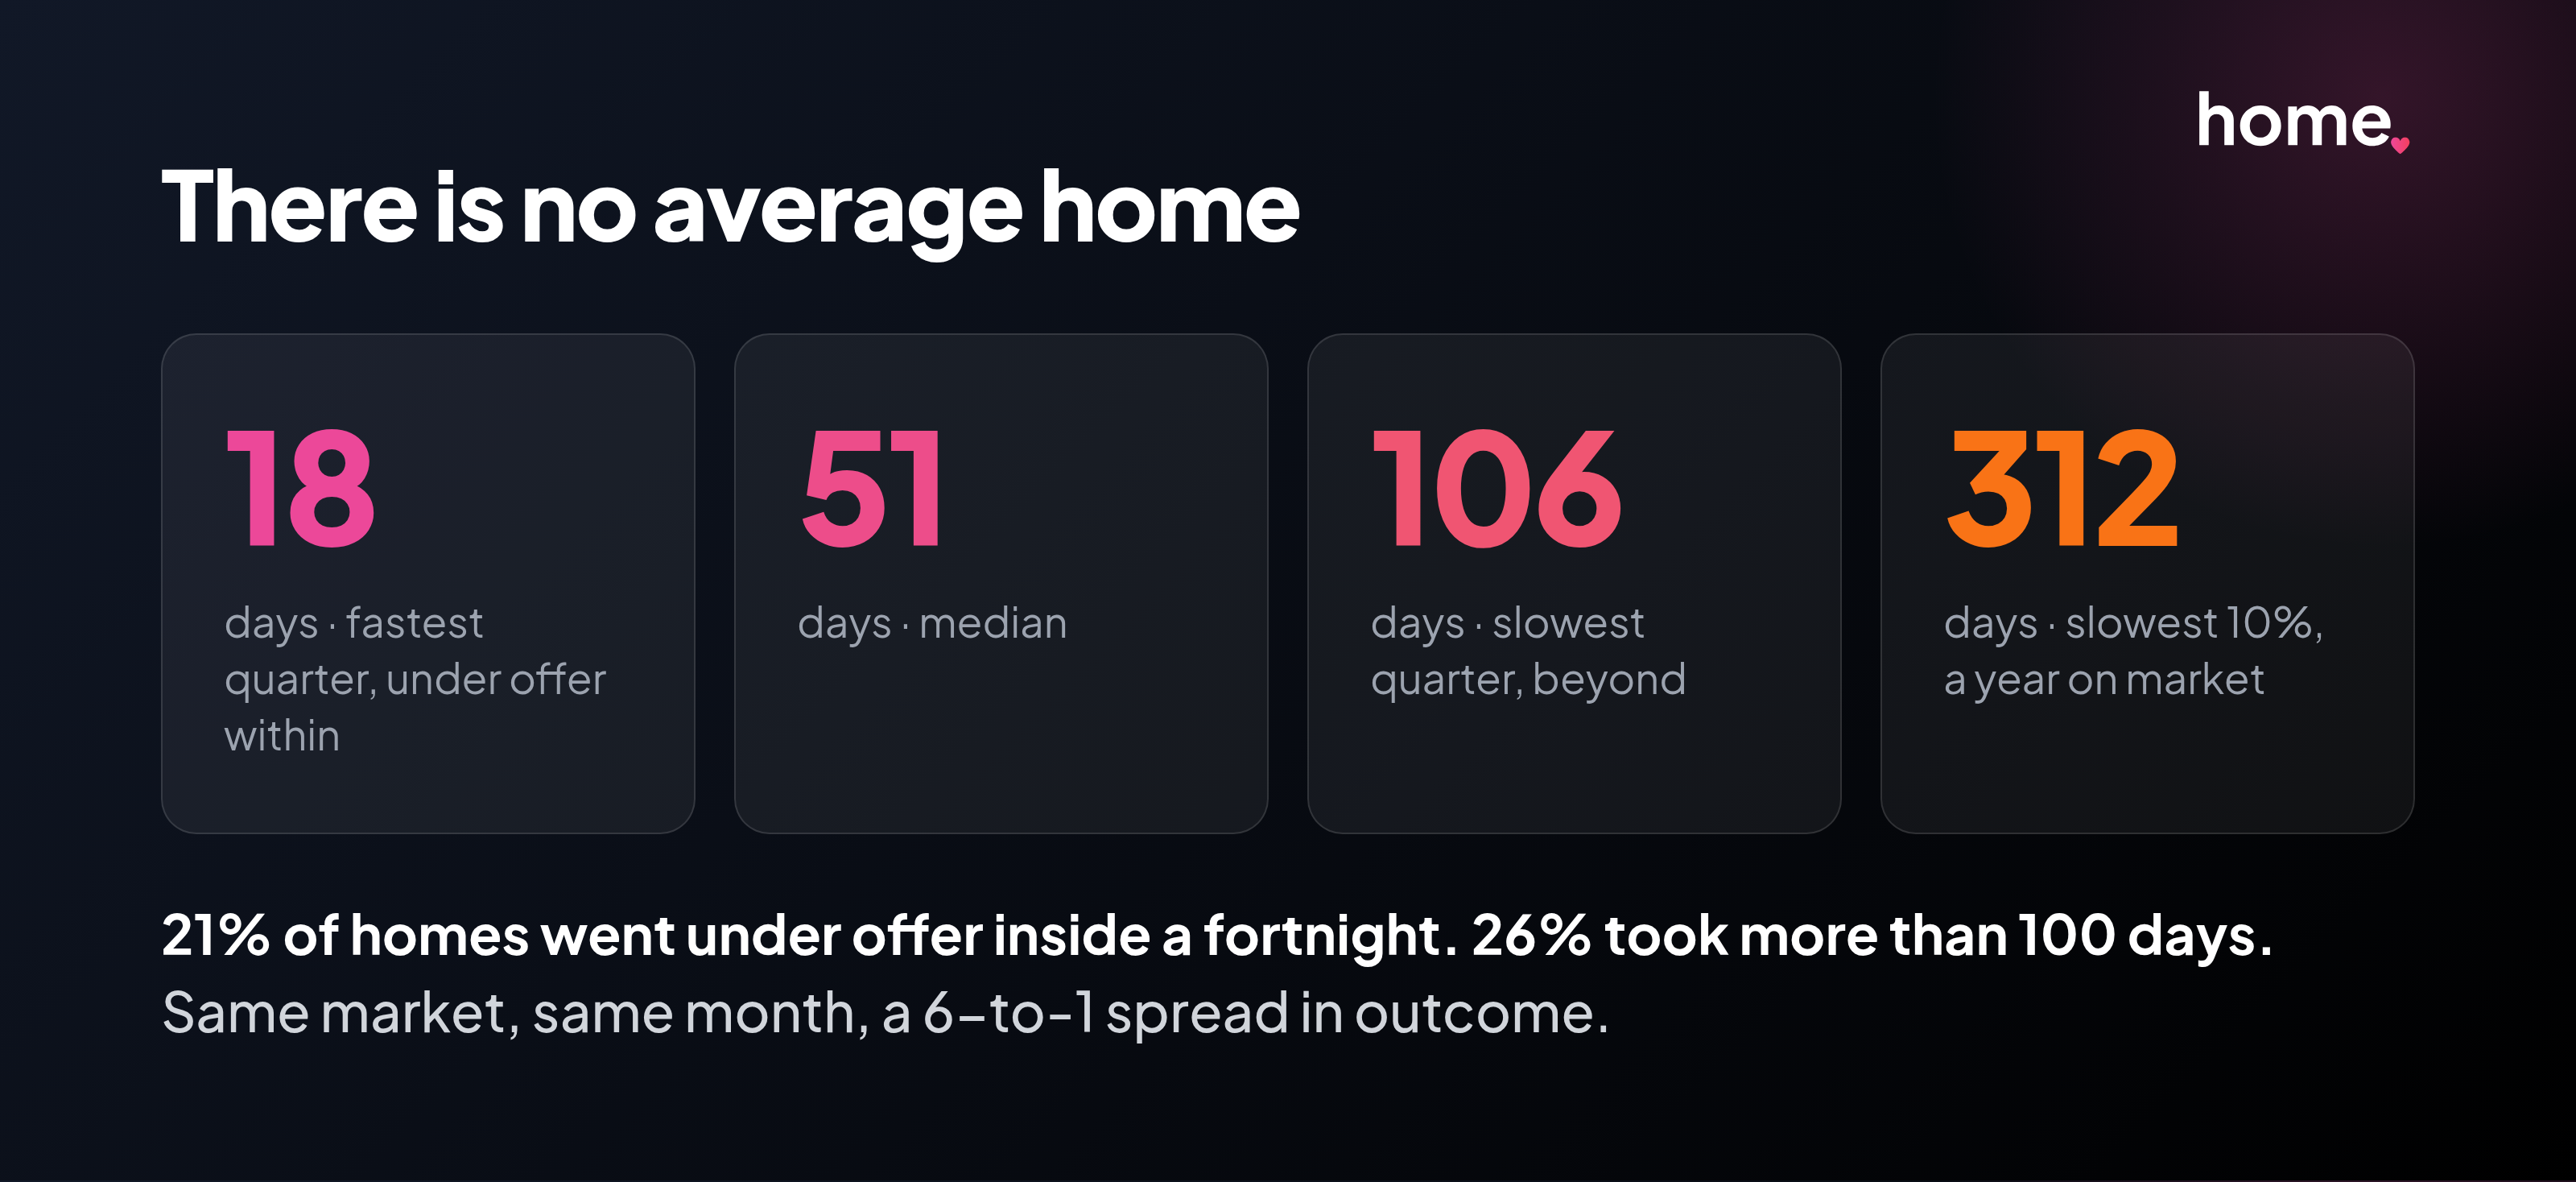
21% went under offer inside a fortnight. 26% took more than 100 days. Same market, same month, a six-to-one spread in outcome. The whole job of selling well is landing in the fast head, and the data is clear about what that takes. Average days on market is about as useful a number as the average length of a piece of string.
The pricing frame that predicts a six-week gap
Every listing carries a price qualifier, the little phrase next to the number. Guide price. Offers over. Offers in the region of. Sellers treat these as throwaway. They are the single most predictive field we found.
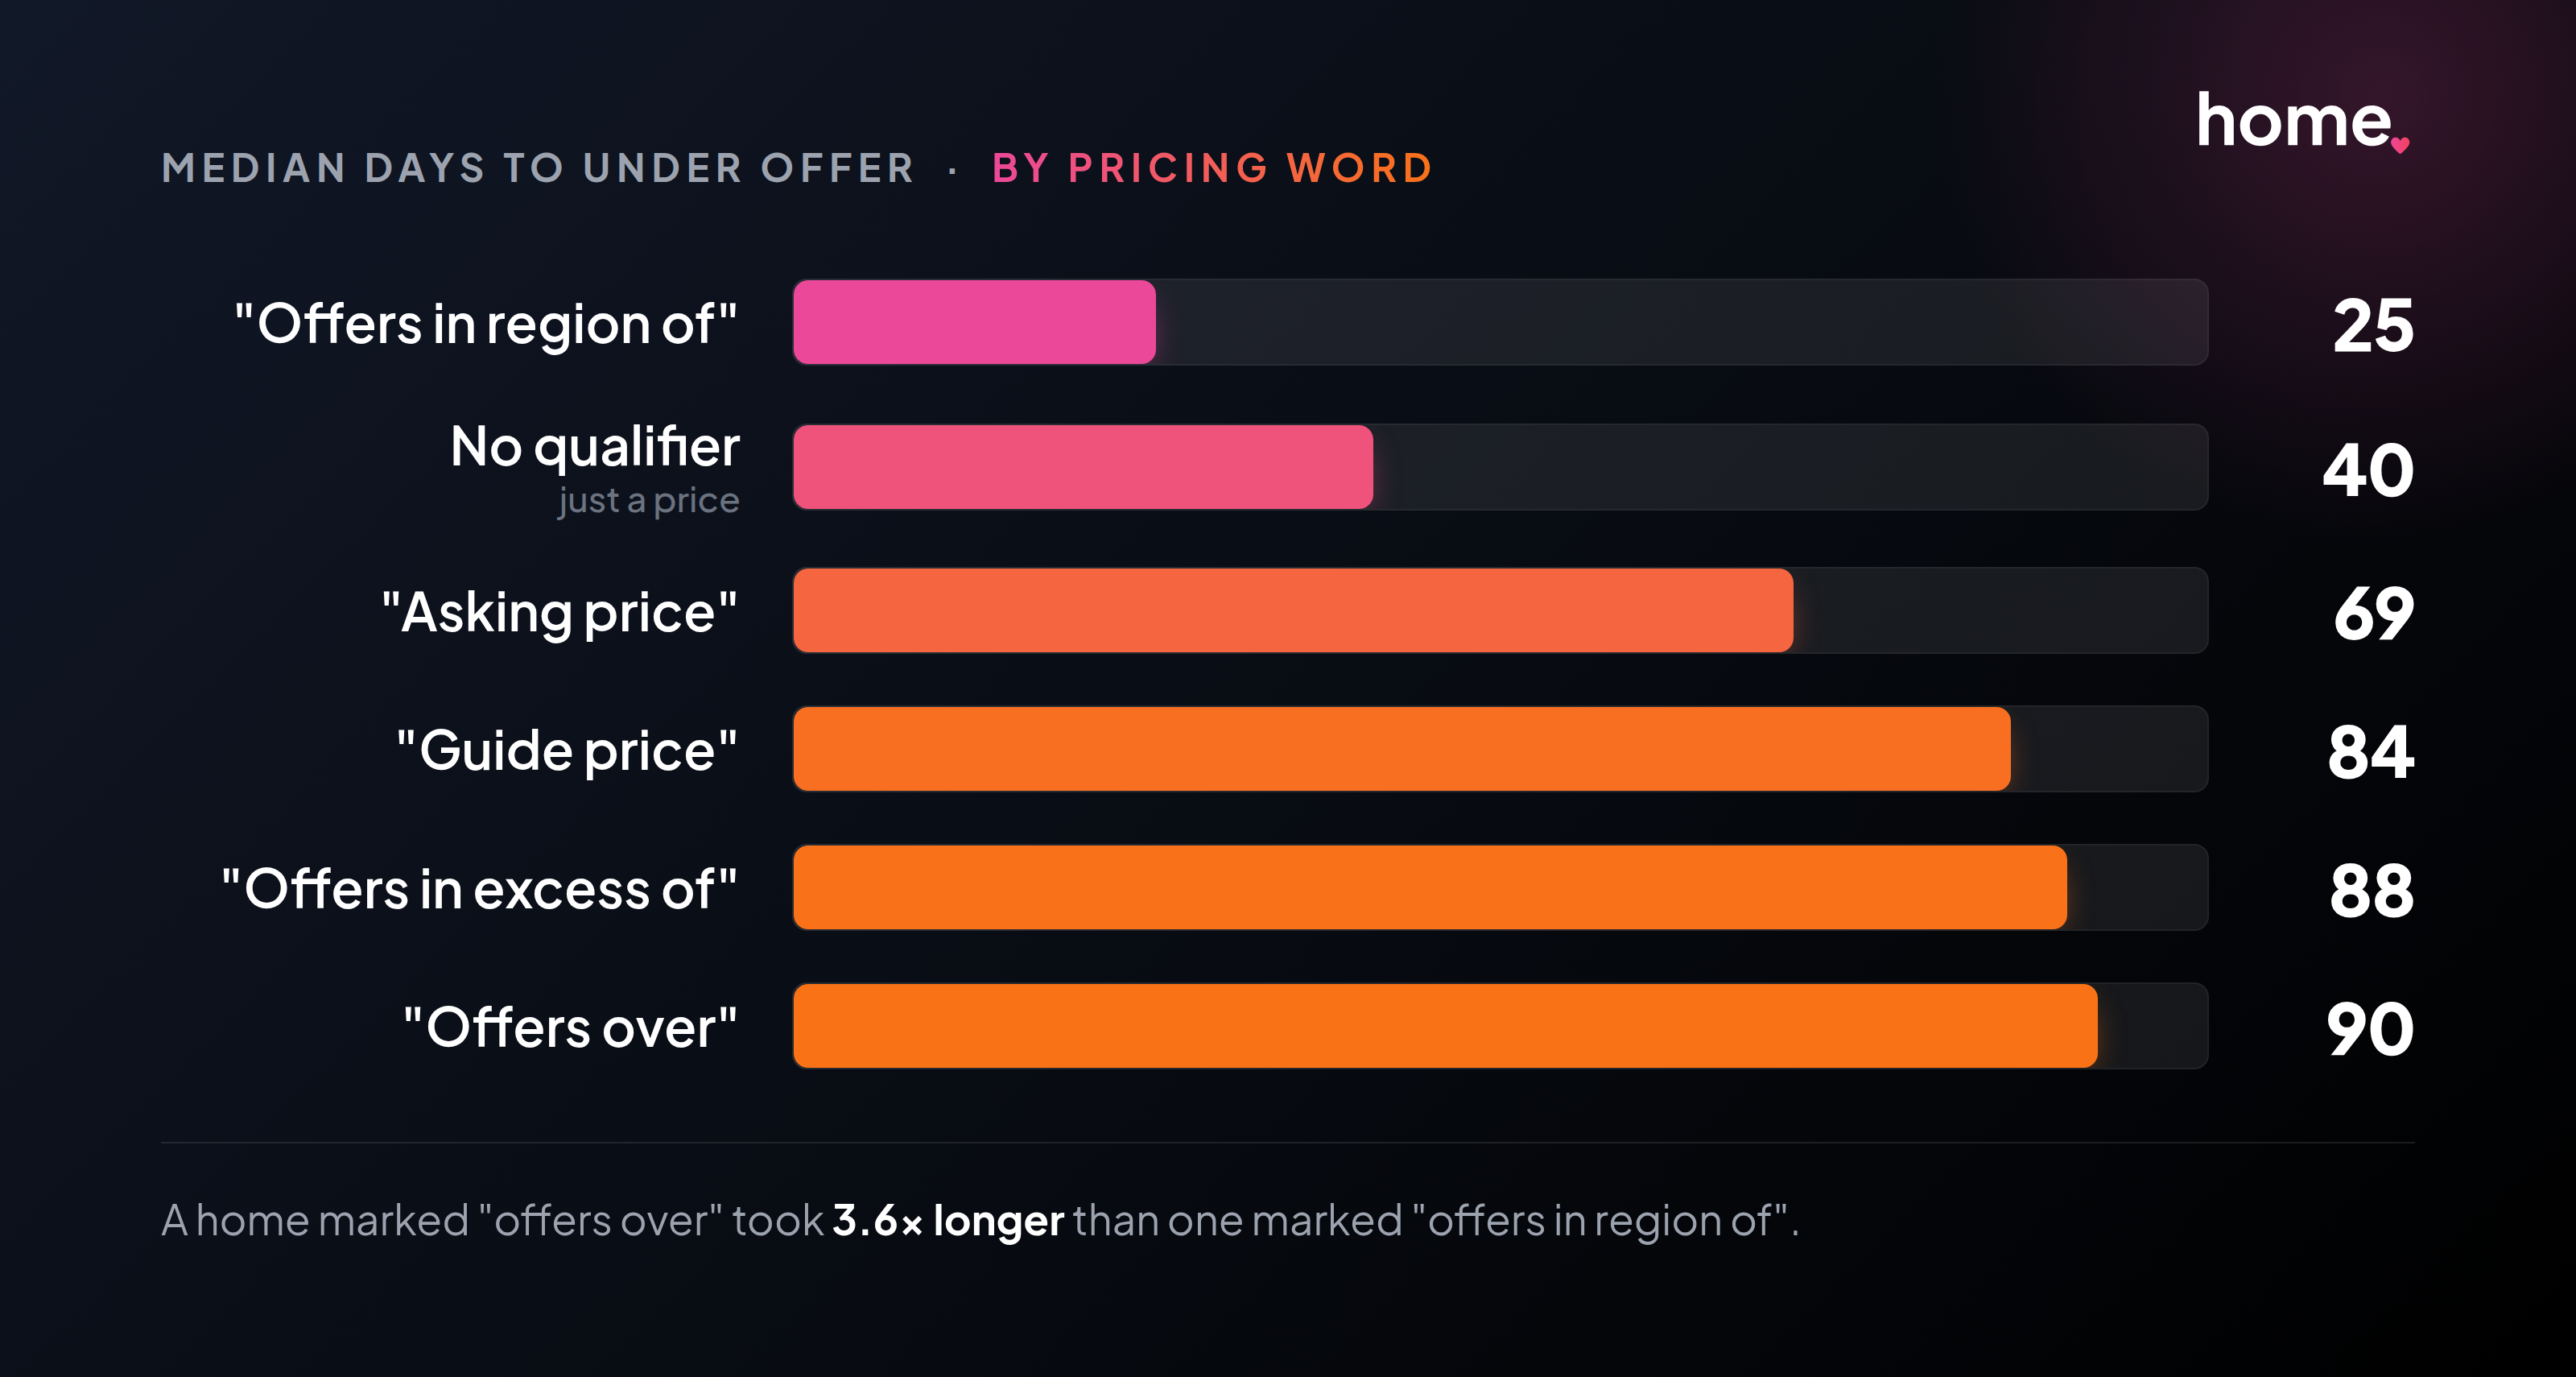
A home marketed "offers over" took 3.6 times longer to go under offer than one marketed "offers in region of." The obvious objection is price: maybe "offers over" sells mansions and "offers in region of" sells starter homes. The opposite is true. The median price of an "offers over" listing was £247,000, the lowest of any group. "Guide price" homes were the most expensive at £395,500. So the effect isn't wealth.
And it survives the control. Inside a single band, homes priced £250k to £500k, the ranking holds and sharpens: offers in region of 15 days, no qualifier 36, offers over 61, guide price 80. Same money, same month, and the phrasing alone tracks a five-week difference.
Why? A qualifier is a signal about the seller's intent, and buyers read it correctly. "Offers in region of X" says this is roughly the number, come and talk. "Offers over X" says X is a floor, bid me up. One invites the market in. The other tells it to fight, and it screens out the exact day-one buyers who move fastest. Then the real tell: "offers in region of" was the fastest phrasing and the least used, on just 3.5% of listings. A third of sellers reached instead for the words that cost the most time.
The correlation that will fool you
Here is where a naive read of the same data goes badly wrong. Sort sales by photo count and the pattern is stark. Floorplans look even worse: with a floorplan, the median was 64 days; without, 34.
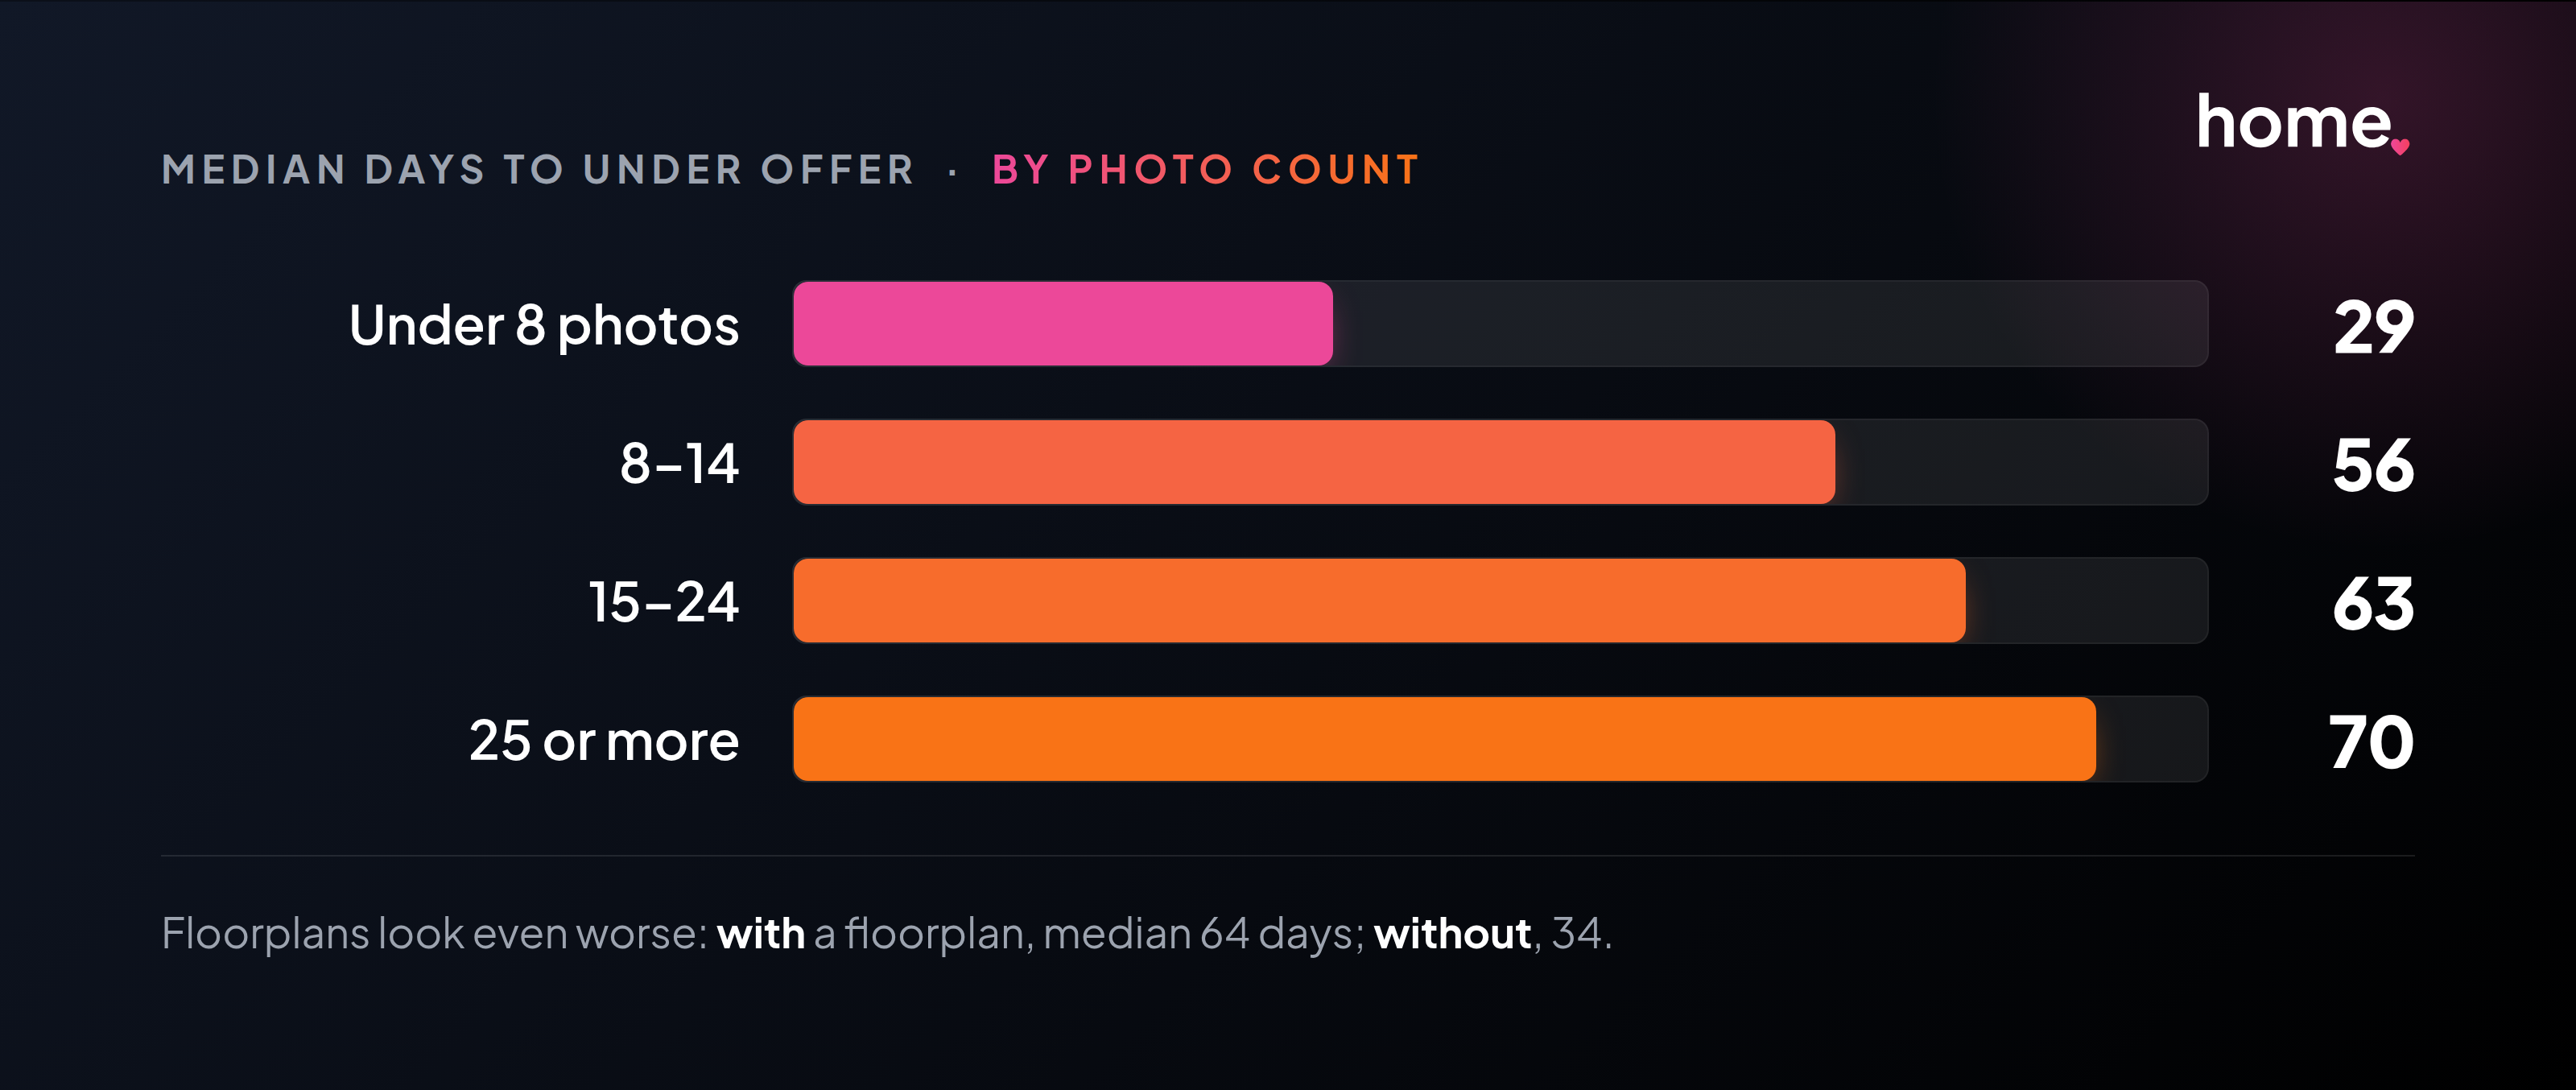
Read carelessly, that's a viral, wrong headline: photos and floorplans slow your sale. Publish it and you'd deserve to be dismantled. It isn't price either, the pattern holds inside the £250k to £500k band.
The mechanism is selection, running backwards. A home that goes under offer in five days often does so before the full shoot and floorplan are even loaded. An agent who expects a hard, slow campaign front-loads everything: thirty photos, a floorplan, a virtual tour. The anticipated difficulty is driving the marketing, so cause and effect are the wrong way round. The lesson isn't take fewer photos. It's that the volume of marketing is a thermometer, not a lever. It measures how hard the sale was always going to be, which points straight back to the thing that is the lever.
The million-pound tax
A million-pound-plus home takes roughly twice as long to go under offer as a mid-market one. Not because it's worse, but because its buyer pool is a fraction of the size.
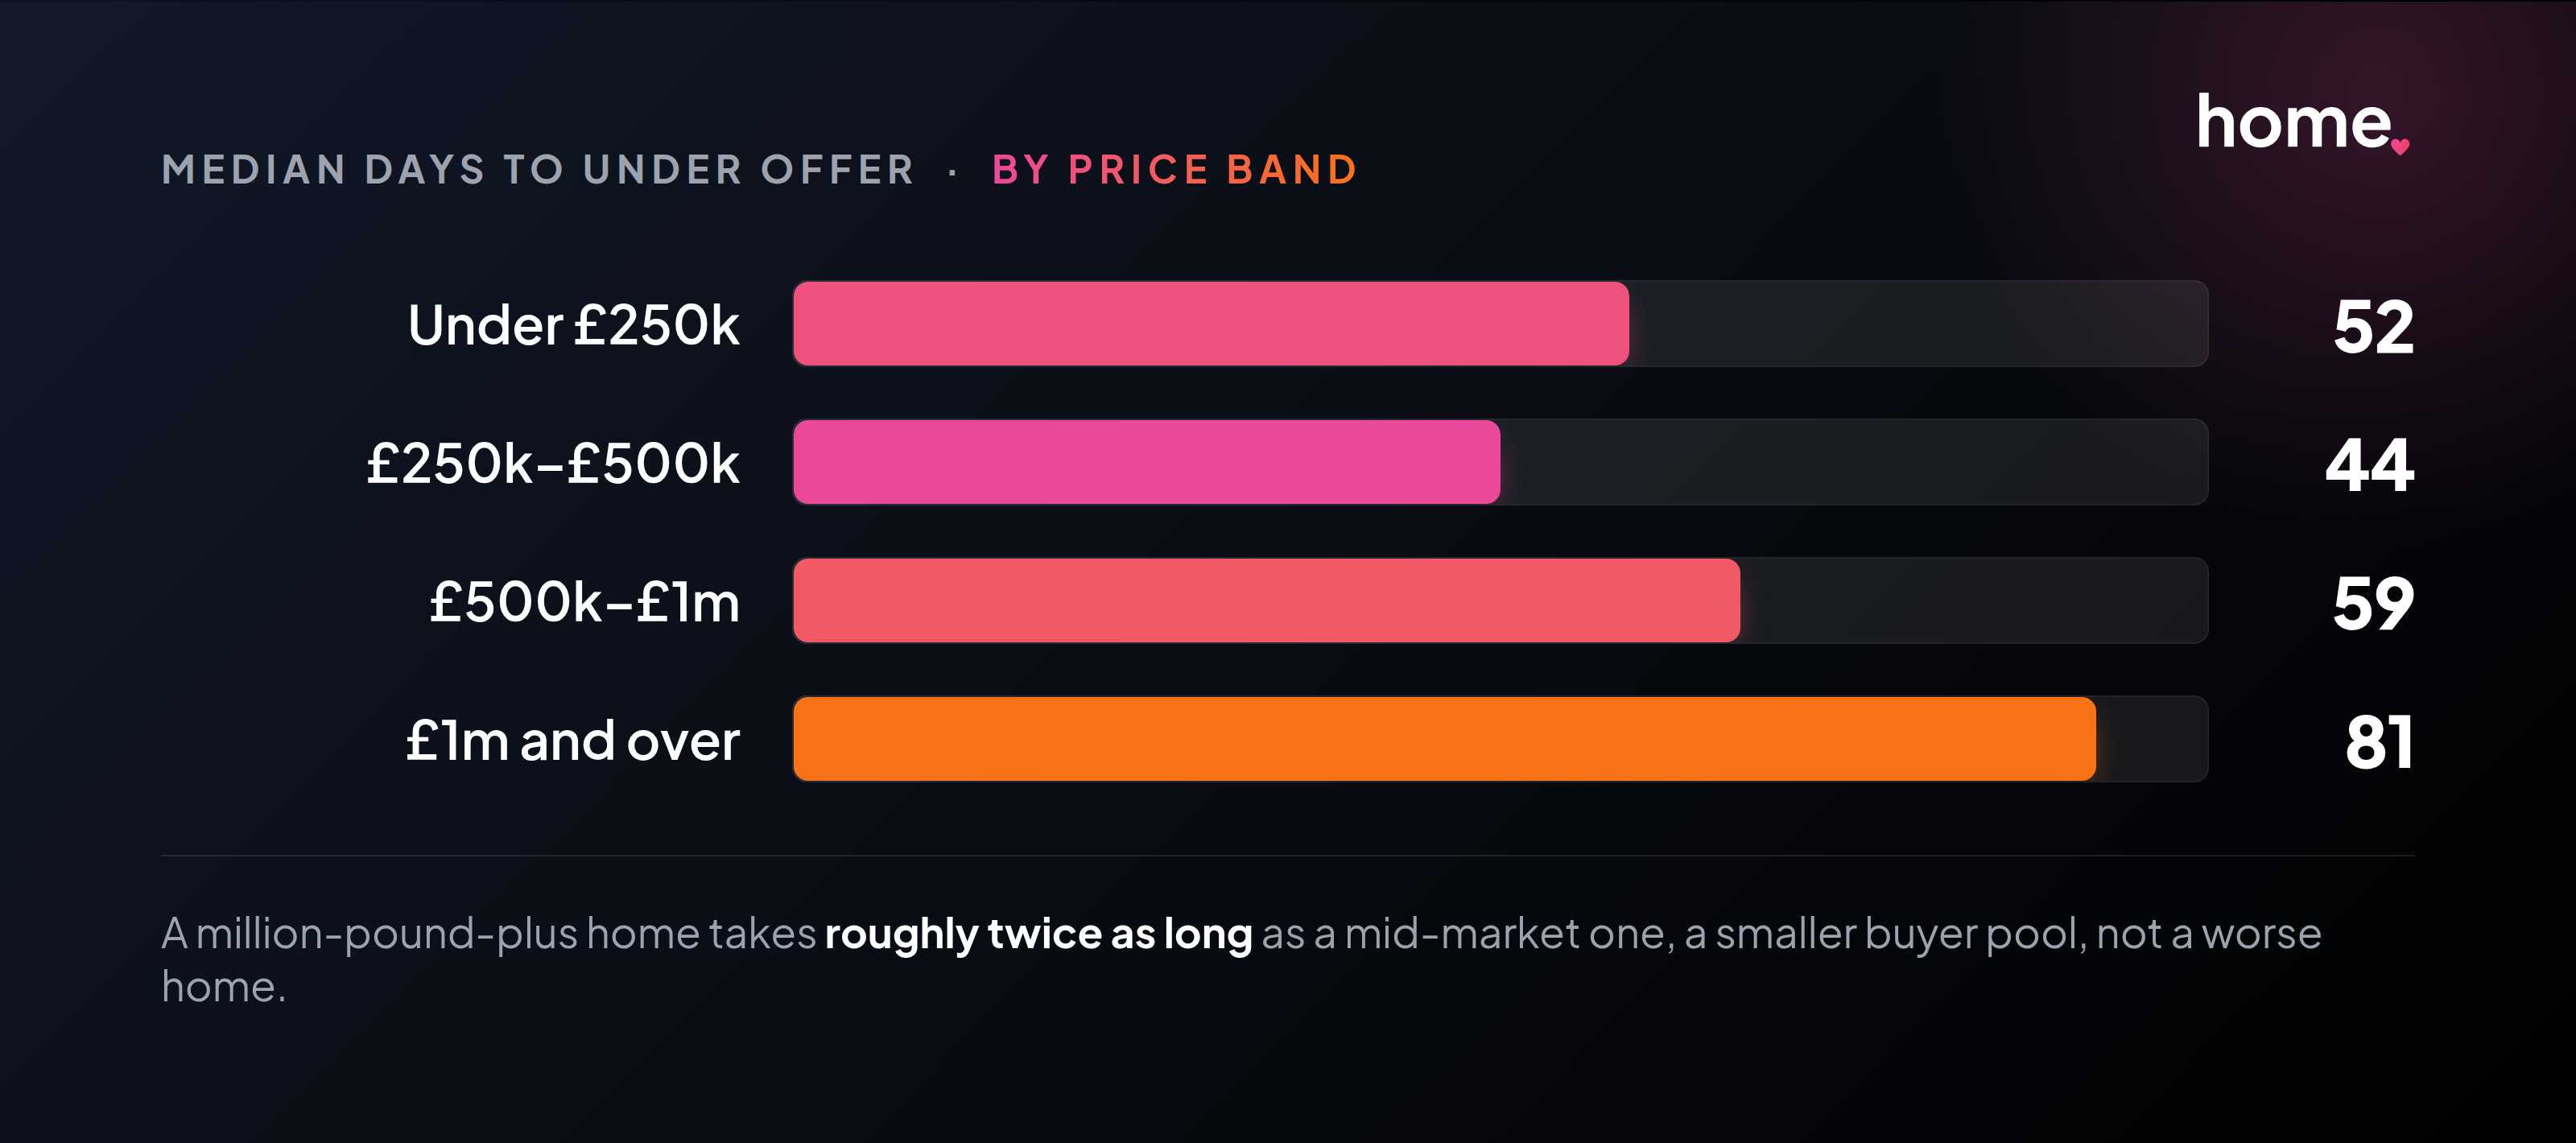
Fewer buyers, longer wait. At the top of the market, patience isn't failure. It's arithmetic.
What moves a house
Underneath all of it sits one variable: whether the day-one price met real demand. You can see it in the behaviour we can measure directly.
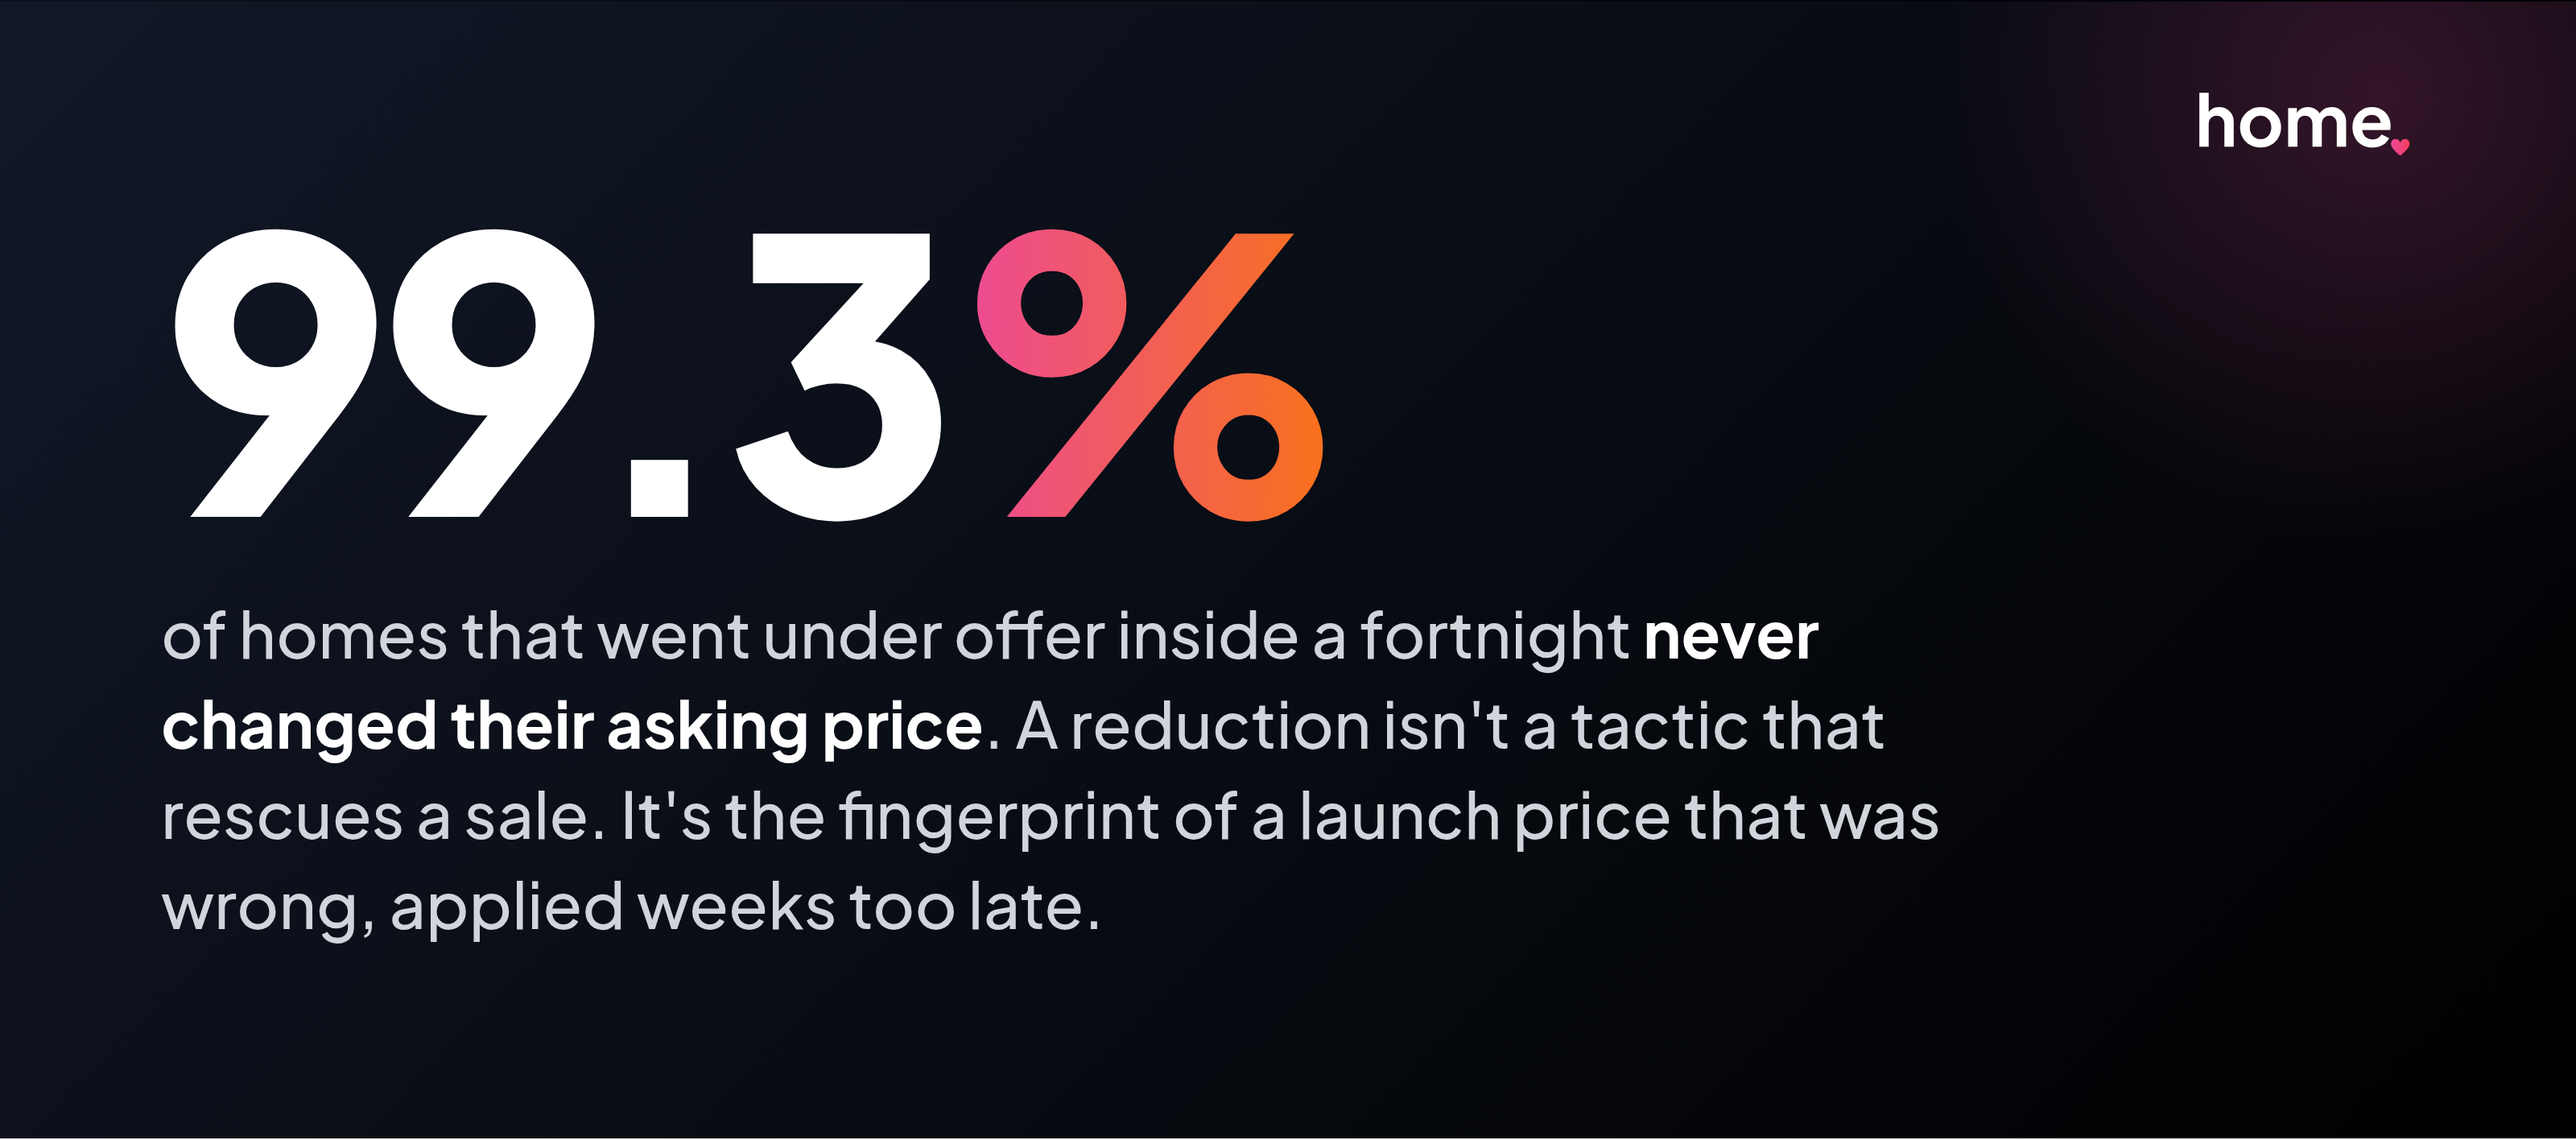
Of the homes that went under offer inside a fortnight, 99.3% never changed their asking price. A reduction isn't the tactic that rescues a sale, it's the fingerprint of a launch price that was wrong, spotted weeks too late.
Everything else here is downstream of that. "Offers over" is slow because it's a bet that demand is higher than it is. The heavy tail is slow because the agent already suspected demand was thin. The long tail is homes priced for the market the seller wanted, waiting for it to arrive. The fast head is the opposite: priced where buyers already are, phrased to invite them in, sold before a reduction is ever needed.
The best buyers for any home are the ones searching its street and its price band on the day it lists. They see it first and move fastest. Meet them with the right number and the right words and the market moves in days. Aim over their heads and you join the tail.
That is why we built home.co.uk's instant valuation: a data-backed read on what a home is worth now, so the day-one number is set to the market you're in, not the one you wish you were in. Pair it with our house price index to see where your local market is heading before you set the number.
Since 1995, Home.co.uk has tracked every move in the UK market. Now we've given thirty years of data a brain. Welcome to the era of agentic property AI.
Scope: homes sold through Home.co.uk, which represents about 12% of UK listing volumes, not the whole UK market. 2,142 completed and agreed sales, timed from first listing to the day the home went under offer. Figures were queried from the data, not estimated.
Thinking about your next move?
See what your home's worth in seconds, with the UK's longest-running property data behind it.
Get an instant valuation
