Prices are holding, sales are not: inside September's asking price index
Asking prices have barely moved in a year. Turnover has fallen 26% and a typical sale now takes 61 days against 39 last September. The adjustment is happening in time, not in price.

The September edition of the Home Asking Price Index puts the average asking price in England and Wales at £394,824. That is 0.26% lower than August and 0.49% lower than a year ago. On the headline number, almost nothing has happened.
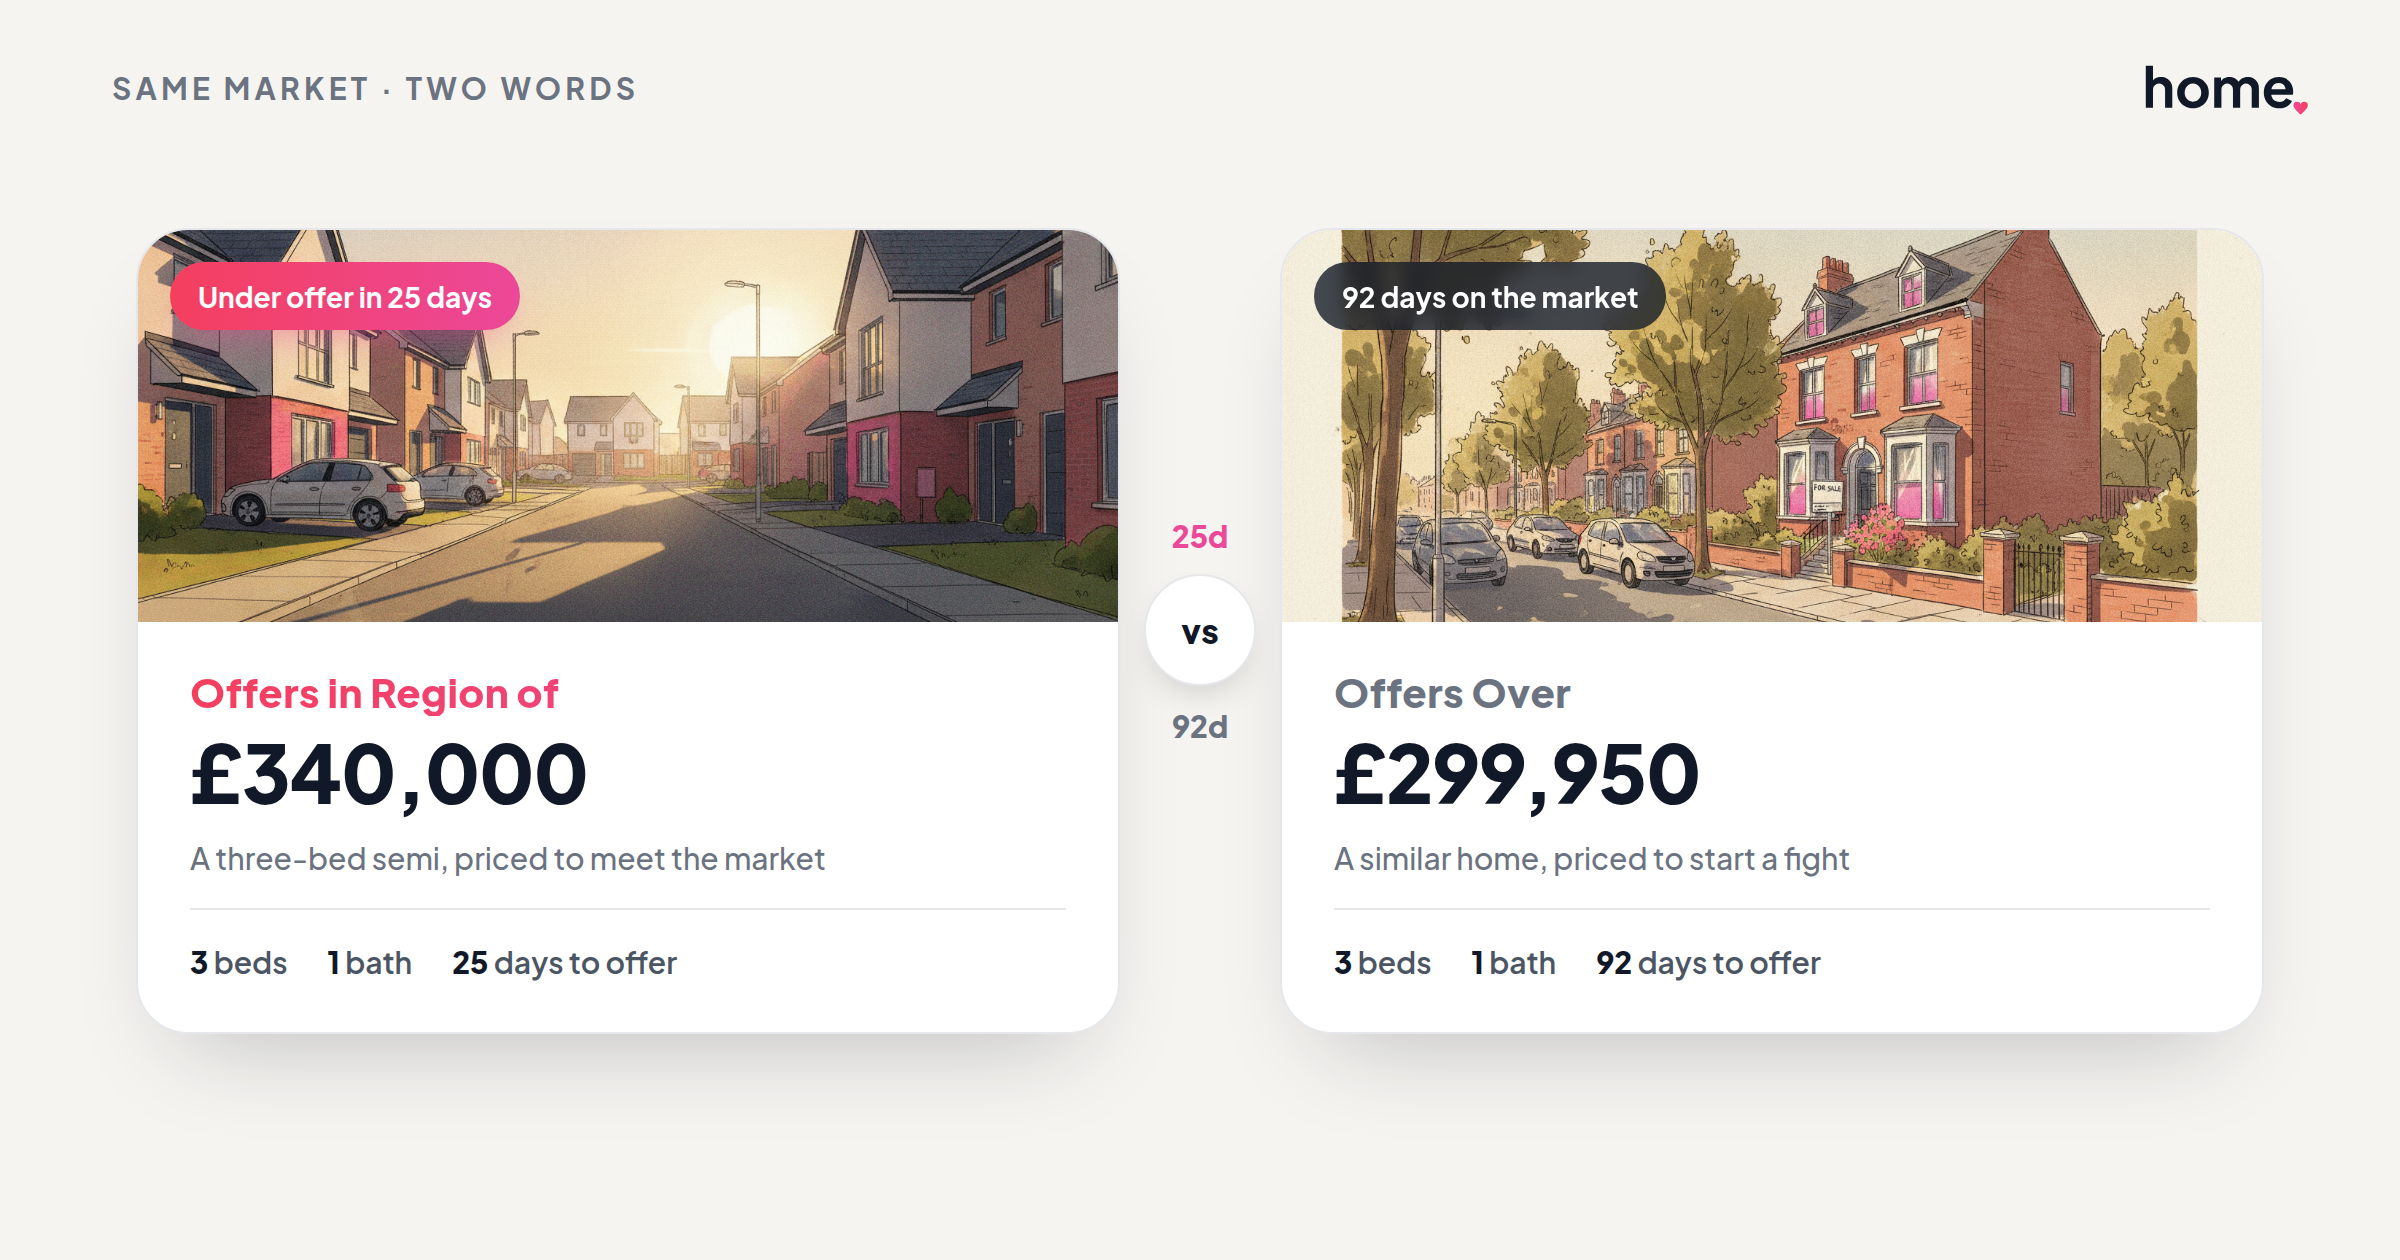
Look at how long it takes to sell a home and a different market appears. A typical sale now takes 61 days. Last September it took 39. That is 22 extra days on the same transaction, and it is the clearest signal in this month's data.
The adjustment is happening in time, not in price
Sellers are not cutting. Asking prices have moved sideways for a year and sit 0.9% below their June 2025 peak. What has changed is the speed at which the market absorbs what is listed.
Turnover, the number of properties leaving the market each day, averaged 2,243 a day from January to July. Over the same months last year it was 3,045. That is a fall of 26%, the steepest move of any measure in the index, and it is what turns into waiting time at the individual level.
Stock tells the same story from the other side. There were 558,178 homes unsold at the September cut-off, against a long-run average of 451,915. New instructions were level with the same 28 days last year, and 8.1% below the same window two years ago. Supply is not the problem. Absorption is.
Cash flat still means a real-terms fall
Inflation does the work that headline prices do not. Adjusted for RPI, asking prices are 3.9% lower than a year ago, and they have been negative in real terms for sixteen consecutive months.
The long run frames it. Over five years, asking prices in England and Wales are up 8.8% while RPI is up 36.6%. Over twenty years they are up 96.3% against RPI at 110.7%. Housing has roughly kept pace with inflation over two decades and lost ground over the last five.
The country is splitting along the price gradient
The national figure is an average of eleven markets moving at different speeds, and this month they span nearly fourteen percentage points.
Scotland leads at 9.2% over the year. The North East is up 4.1%, the North West 3.9% and Wales 2.5%. At the other end, Greater London is down 4.5% and the South West 2.0%. The pattern follows price: the cheaper the region, the faster it is still rising.
The gap those averages hide is the more useful number. Greater London asks 3.2 times what the North East asks, £671,242 against £207,497. Nobody moves at the national average. They move inside one of those bands, or across the gap between two.
Speed splits the same way. Scotland is the quickest market in the index at 25 days to sell. Greater London is the slowest at 79. The East of England has slowed most over the year, at 78%.
What it means if you are selling this autumn
A valuation pitched at last year's absorption rate will sit. When turnover falls this far while asking prices hold, the difference shows up as weeks on the market rather than as headline reductions, and the first price is doing more work than it used to.
Three things follow for anyone listing between now and Christmas.
Price to the market you are in, not the national one. A 9% annual rise in Scotland and a 4.5% fall in London are the same month.
Treat the asking price as the main lever, because it is the one that still moves quickly. The index leads completed sales by roughly five months, so the prices being set now are the completions of next spring.
Plan for a longer run to exchange. Sixty-one days to a sale agreed is the typical case, not the slow one, and the tail behind that median is long. On the regional table, where England and Wales shows 63 typical days on its own 28-day window, the average is 98.
Renting, briefly
Advertised rents average £1,667 per calendar month across the regions covered. Wales posted the strongest annual move at 3.8%. Greater London sits at £2,844, up 1.3% over the year, while sale prices in the capital fell 4.5%. The two markets in London are pointing in opposite directions.
One caveat worth stating: the number of advertised lettings in the sample has fallen sharply since the summer, and these figures are not mix-adjusted, so the regional changes are more reliable than any total.
What we are watching next month
Whether the instructions window turns positive as autumn stock arrives, whether turnover steadies after seven months of falls, and whether the northern regions hold their lead once London's weakness stops being a London story.
The full edition, with every regional table and chart, is at the September asking price index. To see what is happening on your own patch, look at house prices in your area, or get an instant valuation of your home.
Figures are from the Home Asking Price Index, September 2026 edition, computed from advertised asking prices to the 10 September cut-off and mix-adjusted by region and property type. Asking prices lead completed sale prices by roughly five months. Real-terms comparisons use the RPI published by the Office for National Statistics.
Further reading: HM Land Registry's UK House Price Index, which reports completed sales and lags this one by several months.
Thinking about your next move?
See what your home's worth in seconds, with the UK's longest-running property data behind it.
Get an instant valuation