The fullest August market since 2007, and what it means for sellers
561,547 homes were unsold in August, the most in any August since 2007. Asking prices held at £395,845, but a typical sale took 59 days against 37 a year ago.

There were 561,547 homes unsold across England and Wales at the August cut-off, according to the Home Asking Price Index. That is the most in any August since 2007, and it sits well above the long-run average of 450,767.
A full market usually arrives with falling prices. This one has not. The average asking price is £395,845, down 0.30% on the month and 0.05% on the year. Sellers are holding, and the market is absorbing the difference in time.
Stock is high, and it is not the sellers filling it
The obvious explanation for a crowded market is a rush of new listings. That is not what the data shows.
New instructions were 3.8% lower than the same 28 days a year earlier, and 2.9% lower than the same window two years ago. Fewer homes are coming to market, not more.
What has changed is the rate at which they leave it. Turnover averaged 2,222 properties a day from January to June, against 2,992 in the same months last year. That is a fall of 26%, and the quietest first half since 2020. When arrivals slow and departures slow faster, stock builds anyway.
Time has taken the strain
A typical sale took 59 days in August. A year earlier it took 37. Every region has slowed, and the North East has slowed most, at 80% over the year.
The typical figure is the median, so half of all sales are slower still. On the regional table, where England and Wales shows 61 typical days on its own 28-day window, the average is 95. That gap between the median and the mean is the signature of a tail of stock priced for a faster market than this one.
Cash flat is a real-terms fall
Against inflation, asking prices are 3.2% lower than a year ago, and they have been negative in real terms for fifteen consecutive months.
The long run is starker. Over five years, asking prices are up 9.9% while RPI is up 36.3%. Over twenty years they are up 98.1% against RPI at 110.4%. Gold is up 853% across the same twenty years.
The north carries the national number
Scotland is up 9.6% over the year and the North East 3.7%, while Greater London is down 3.0%. The cheaper regions are holding the national figure up, and the expensive ones are pulling it down.
That spread matters more than the average it produces. Greater London asks 3.3 times what the North East asks, £679,545 against £206,877, so a national percentage describes almost nobody's market.
What it means if you are selling
Stock at an eighteen-year high for the month means your home is competing with more listings than at any August since before the financial crisis, while the pool of buyers clearing that stock has shrunk by a quarter in a year.
Two practical consequences follow.
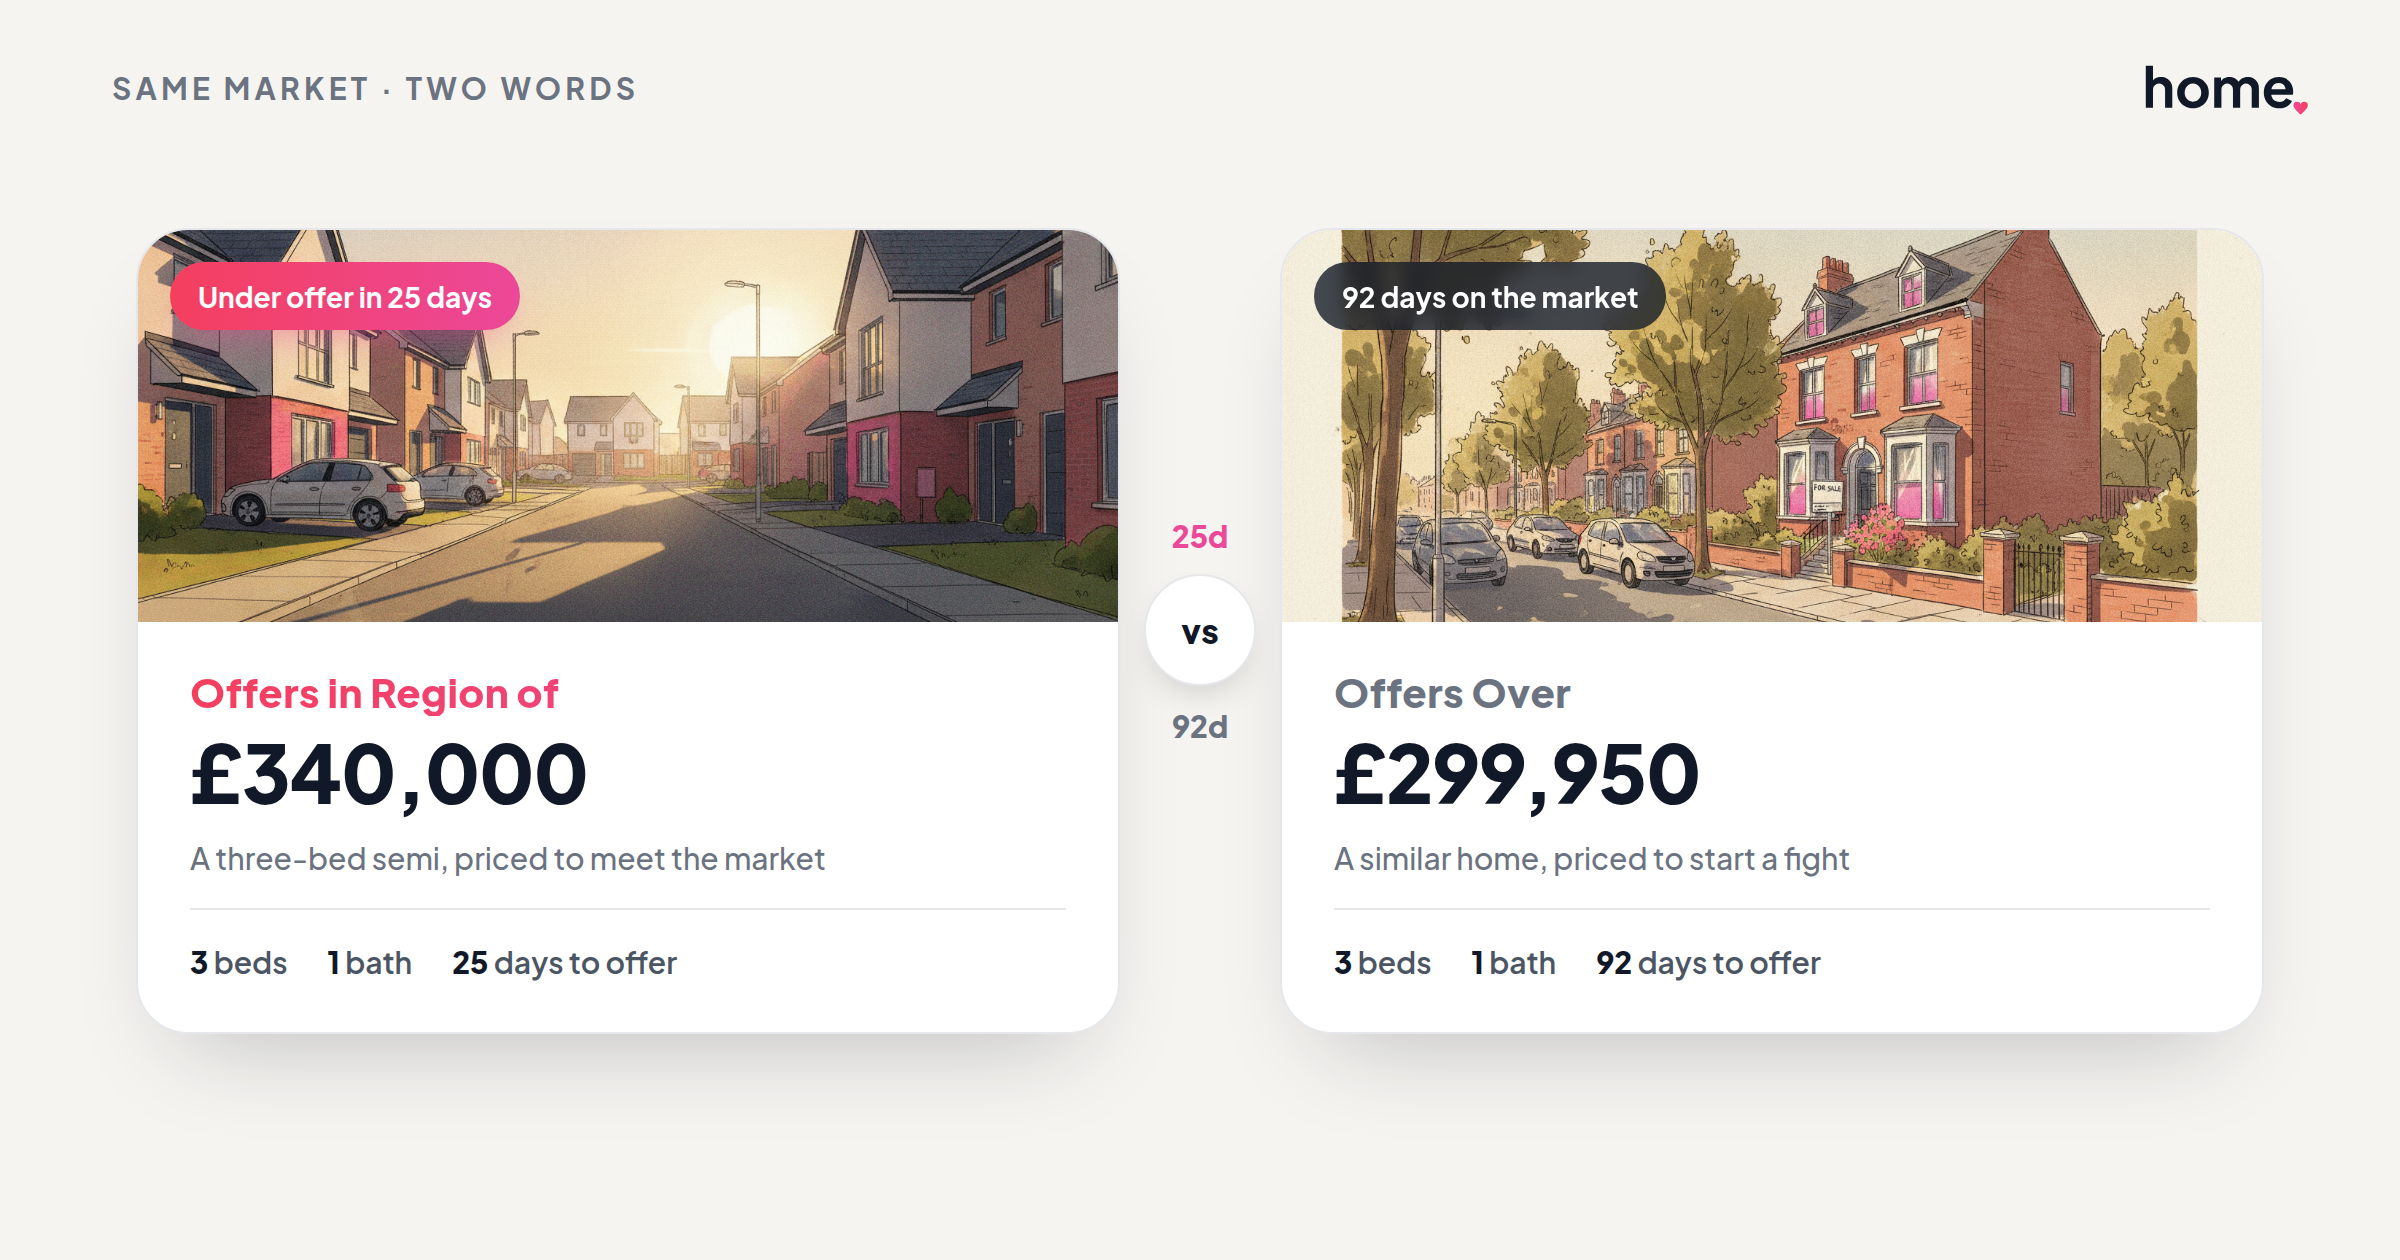
The asking price is doing the work. With turnover down 26% and prices flat, the market is not correcting through visible reductions. It is correcting through time, and a price set for last year's pace of sale will wait.
Time to exchange needs planning. If a typical sale is taking 59 days to agree, a move that has to complete by a fixed date needs the listing out earlier than it would have done last summer.
Renting, briefly
Advertised rents averaged £1,647 per calendar month across the regions covered, with the South East posting the strongest annual move at 7.3%. Greater London sits at £2,941, up 5.9% over the year while sale prices in the capital fell 3.0%. The rental market and the sales market are not moving together, and in London they are moving in opposite directions.
The full edition, with every regional table and chart, is at the August asking price index. For your own area, look at house prices or get an instant valuation.
Figures are from the Home Asking Price Index, August 2026 edition, computed from advertised asking prices to the 15 August cut-off and mix-adjusted by region and property type. Asking prices lead completed sale prices by roughly five months. Real-terms comparisons use the RPI published by the Office for National Statistics.
Further reading: HM Land Registry's UK House Price Index, which reports completed sales and lags this one by several months.
Thinking about your next move?
See what your home's worth in seconds, with the UK's longest-running property data behind it.
Get an instant valuation