How long do properties really take to sell? Now we can tell you
Home now tracks time on market and price trajectories by area, alongside supply and asking-price data. Free, local, updated monthly from our live listings.
How long do properties take to sell? Now we can tell you
The headline numbers people reach for when they think about the property market are prices. But price is a snapshot. The question that tells you whether the market is moving is a different one: how long is a property sitting before it sells?
We have now built the answer into Home's house price data, and it changes what you can see.
What time on market shows you
A fast market is one where properties are selling quickly: demand is ahead of supply, buyers are competing, and sellers have the upper hand. A slow market is the reverse. Both can exist with similar average prices. Time on market is the signal prices alone cannot give you, and it complements why stock levels matter more than headline prices when you are trying to read a local market.
Home now tracks this by area, drawn from the 1,249,531 live UK listings on the platform at any given time. For each postcode district and county on our house prices pages, we show the median time properties are spending on the market before going under offer, alongside the supply and price data we already publish. You can see whether your local area is running hot or cooling off, compared with the national picture. It also feeds into how much the market speeds up or slows down by season, which was hard to prove with price data alone.
And how prices move during a listing
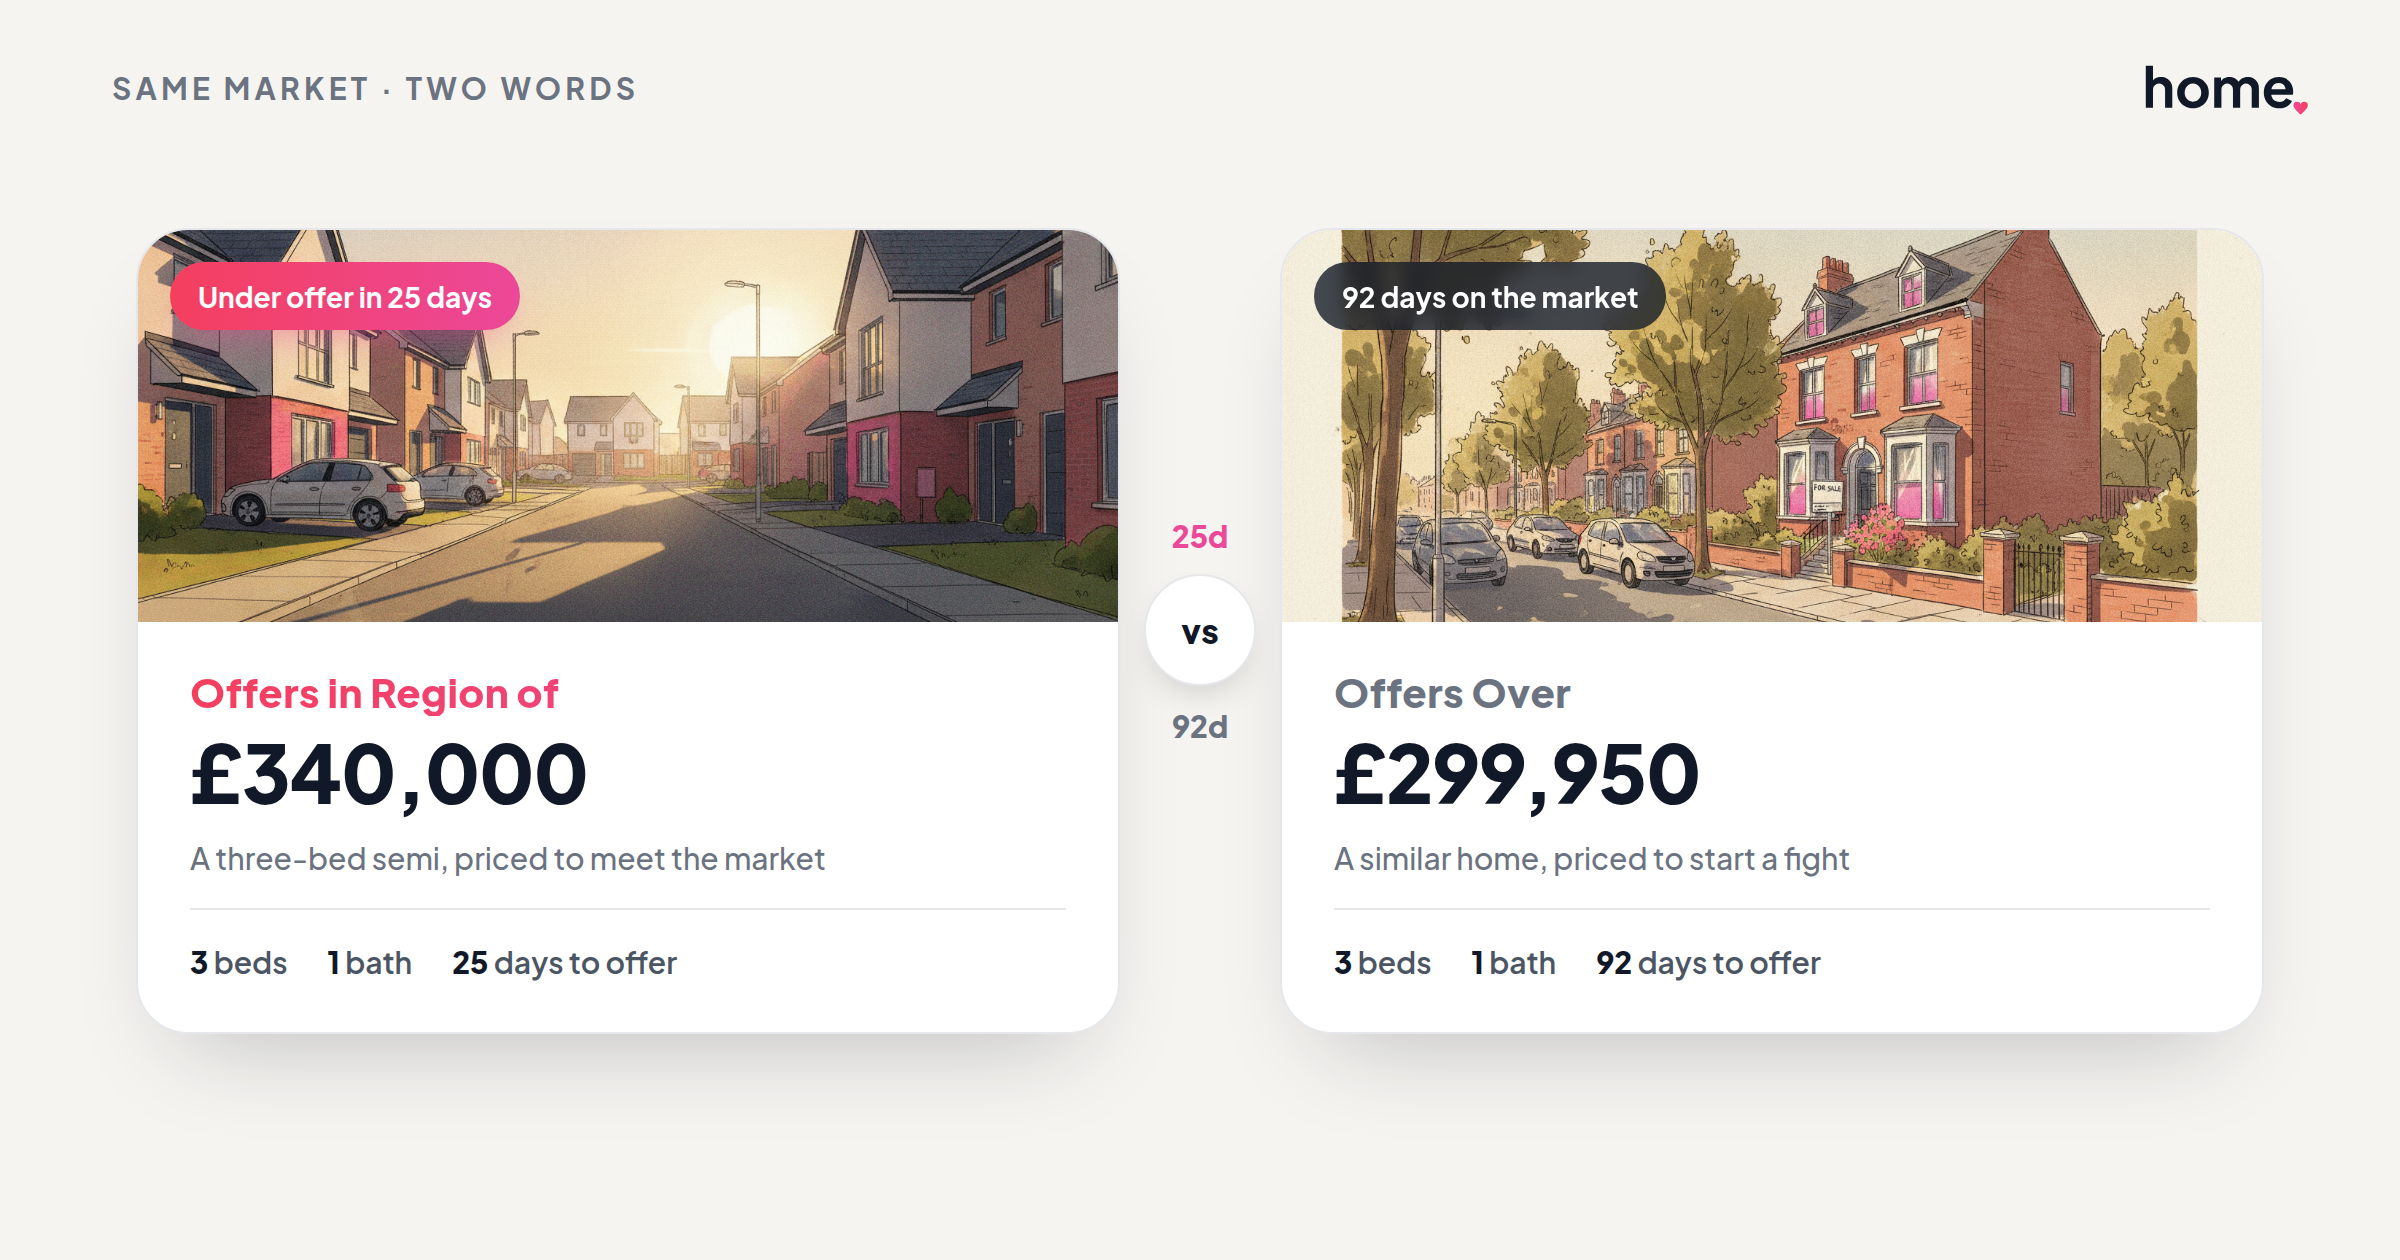
A property that has been on the market for four months and had two price reductions is telling you something. A property that went under offer in eleven days at asking price is telling you something different. Our new price-trajectory data captures that: for any area, you can see how typical asking prices shift as listings age. A 3-bed house in Fringford, Oxfordshire listed at £350,000 and a 1-bed flat on Henry Street, Manchester at £195,000 will each have their own trajectory curve on their local pages, and that is the point: this is a local tool, not a national one.
Using Home's time on market data, buyers can benchmark an offer and sellers can decide whether to adjust.
Free, local, updated monthly
All of this is free on Home's house prices pages. Select your area, and the time-on-market and price-trajectory figures are in the data panel alongside stock levels and price trends. We update the figures monthly from our live listings data.
These are Home's own figures, derived from listings on our platform. We label them clearly as estimates; they are not Land Registry transactional data and should be read as directional signals rather than audited results.
If you have questions about methodology or want to work with this data commercially, get in touch.
Figures are derived from Home's live listings data. They represent properties listed on the Home platform and may not reflect the full market. Updated monthly.
Further reading: the ONS UK House Price Index.
Thinking about your next move?
See what your home's worth in seconds, with the UK's longest-running property data behind it.
Get an instant valuation