

























Home Asking Price Index, September 2024: increased supply weighs heavy on southern prices
Asking prices in England and Wales fell 0.2% in the month but remained 1.5% higher than a year earlier, as unsold stock hit a ten-year high.

This is the September 2024 edition of the Home Asking Price Index, released on 13 September 2024, under the headline:
Increased Supply Weighs Heavy on Southern Prices
The headlines and summary below are the report's own words, with the key figures as it published them, followed by the report's charts and regional tables as printed.
Headlines
- Asking prices dipped for the first time in nine months, by 0.2%, during the last month across England and Wales, yielding to both high supply and seasonal trends. Home prices are up 1.5% compared to September 2023.
- The worst monthly falls were in London and the West Midlands while prices continue to increase in Scotland, the North West and North East.
- The total number of new instructions entering the market during August 2024 was 14% more than during August 2023 and 8% more than August 2019.
- The unsold sales stock count for England and Wales increased again to make the current total the highest since November 2014. Nearly five thousand properties were added to agents' portfolios, making the current count of unsold properties 499,667.
- Despite both a notable slowdown and a 10-year high in unsold stock, the sales market momentum remains relatively healthy, as indicated by both the Typical Time on Market (median) for unsold property in England and Wales being seven days less than in September 2019 and our Market Turnover Indicator showing a performance comparable to pre-pandemic years. The current median Time on Market for unsold property is five days more than in August last year.
- The North East extends its lead as the regional property market growth leader with a very impressive year-on-year gain of 6.7%, while the East of England is now the worst performing region, indicating no change over the same period.
- The annualised national growth figure for asking rents has slowed again to just 0.8%, dragged down by London's poor performance. However, Wales continues to lead the regional growth table, followed by the South West, indicating rises of 14.6% and 9.7% respectively year-on-year. Meanwhile, the year-on-year decline in Greater London rents is now -1.1%.
- The boroughs of Haringey and Bexley indicate the worst declines in asking rents, with annualised rental falls of 10.7% and 8.9% respectively.
Summary
A surge in new instructions has swelled agents' portfolios further. However, given the large number of properties entering the market last month, the current total of stock for sale has only increased by a comparatively small margin. Hence, demand remains sufficiently strong to have prevented a large glut of unsold properties.
Vendors are clearly motivated given that, seasonally, prices usually dip from here towards the Christmas break. The drop in the bank rate will have been the green light for many vendors to commit, but a substantial and growing landlord exodus has also been observed.
Of course, higher stock levels put downward pressure on prices. The last time the total stock of unsold properties on the market was this high was in 2019 and that year prices essentially went sideways (despite the base rate being a mere 0.75%). For the time being, it is reassuring that the rate at which properties are moving through the market is considerably higher than in 2019, although given the recent uptick in inflation (and the Bank of England's poor track record on forecasting), this may not be the case for much longer. Buyer optimism could evaporate very quickly should monetary inflation be found to be out of control again.
Key figures
| Measure | Figure |
|---|---|
| Monthly change in asking prices | -0.2% |
| Annual change in asking prices | 1.5% |
| New instructions vs August 2023 | +14% |
| New instructions vs August 2019 | +8% |
| Annualised growth in asking rents | 0.8% |
| Five-year rise in national average price | 16.2% |
Figures are for England and Wales unless the report states otherwise, as published in the edition.
Charts from the report
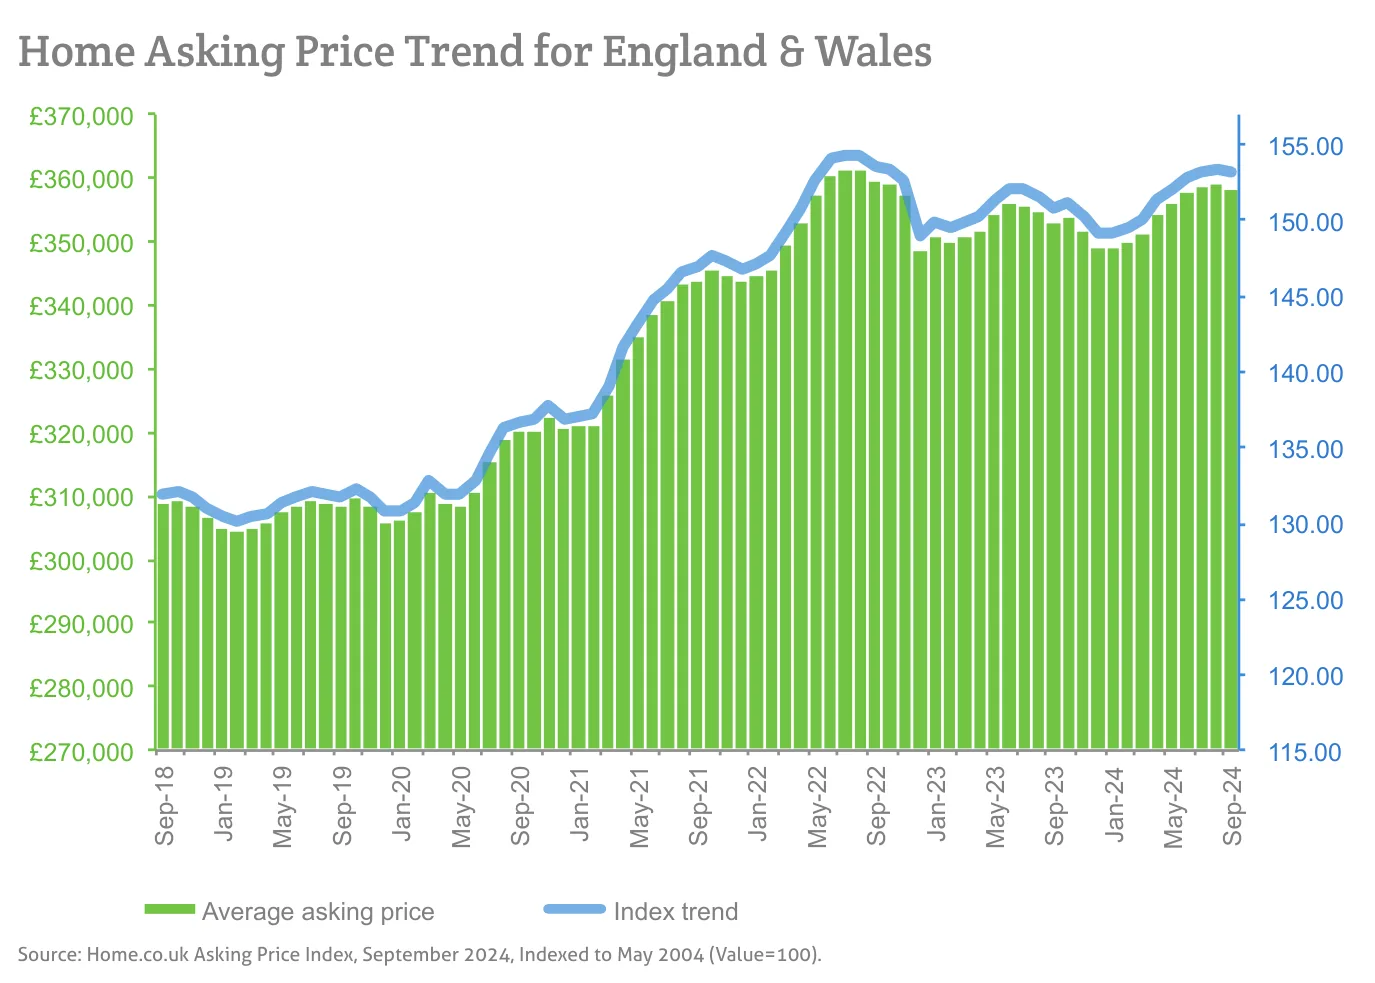
Source: Home.co.uk Asking Price Index, September 2024, Indexed to May 2004 (Value=100).
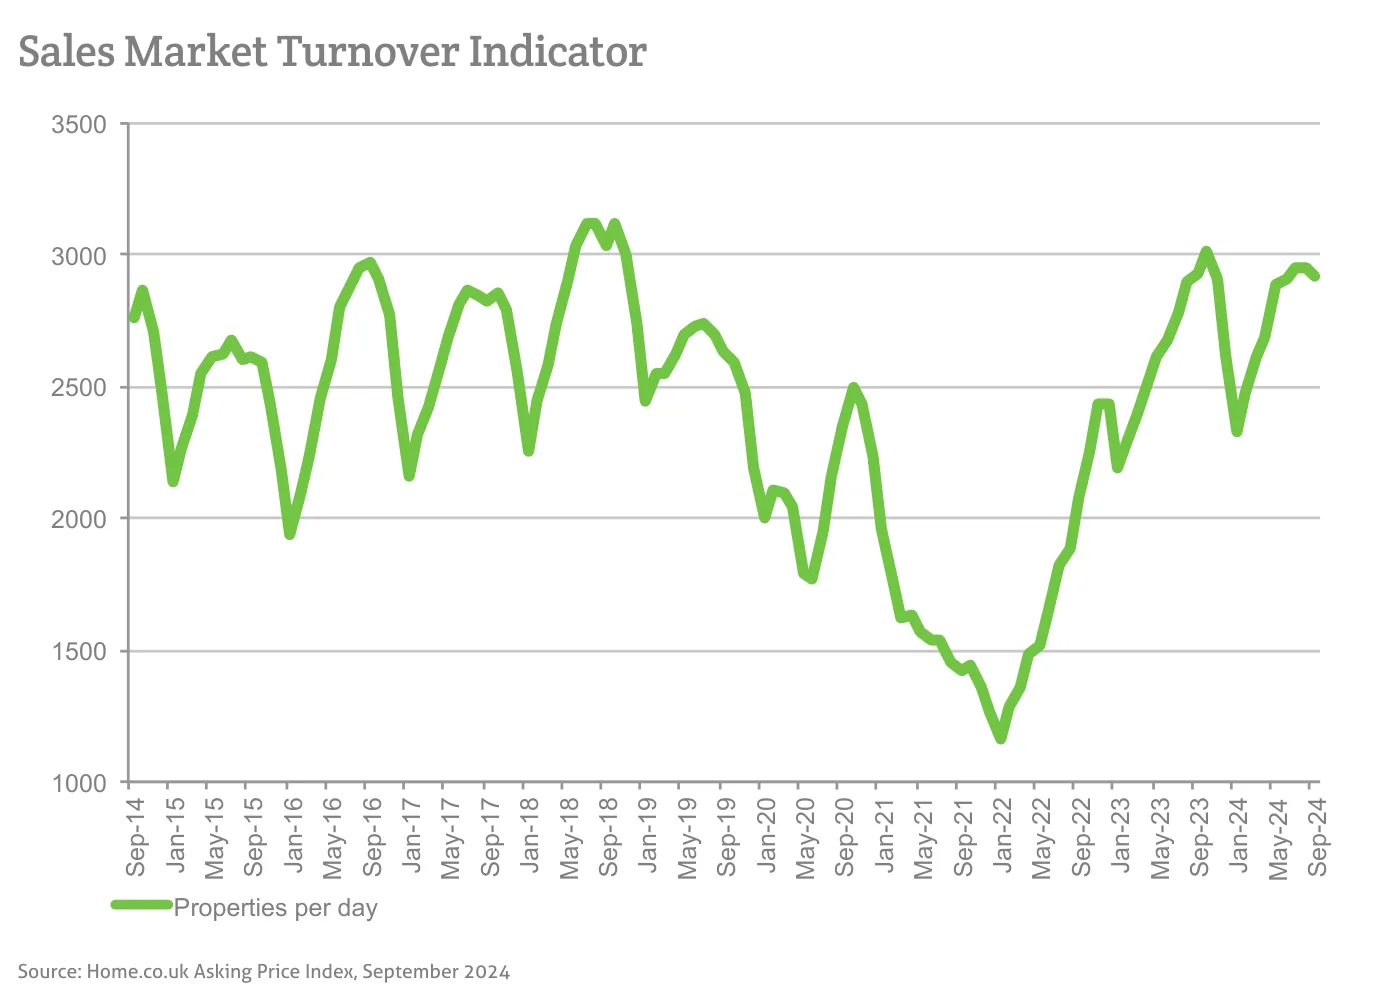
Source: Home.co.uk Asking Price Index, September 2024
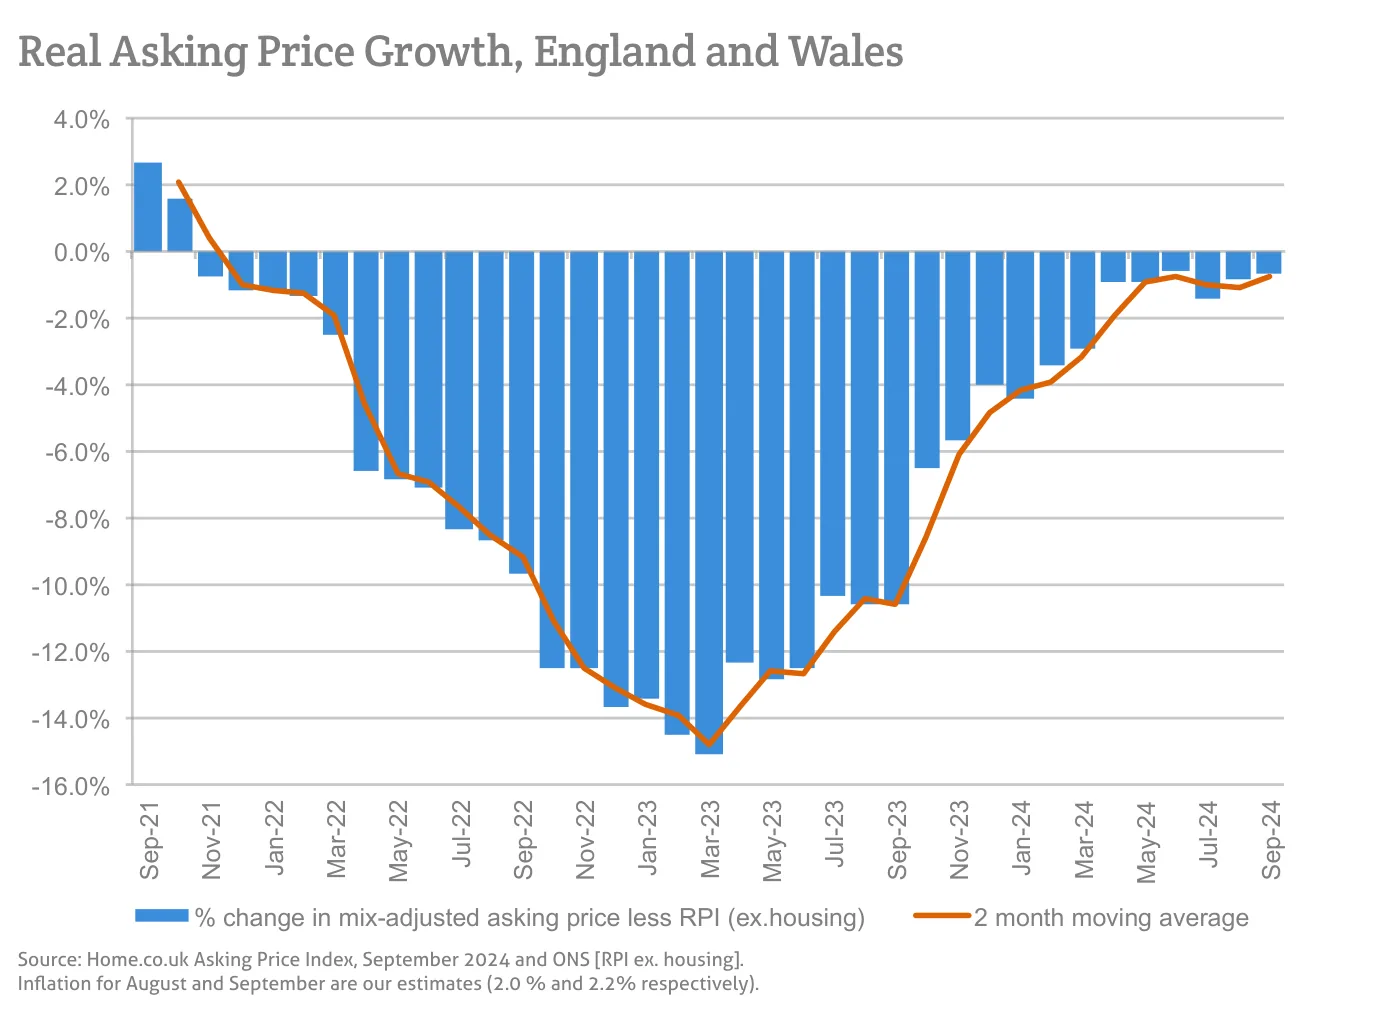
Source: Home.co.uk Asking Price Index, September 2024 and ONS [RPI ex. housing].
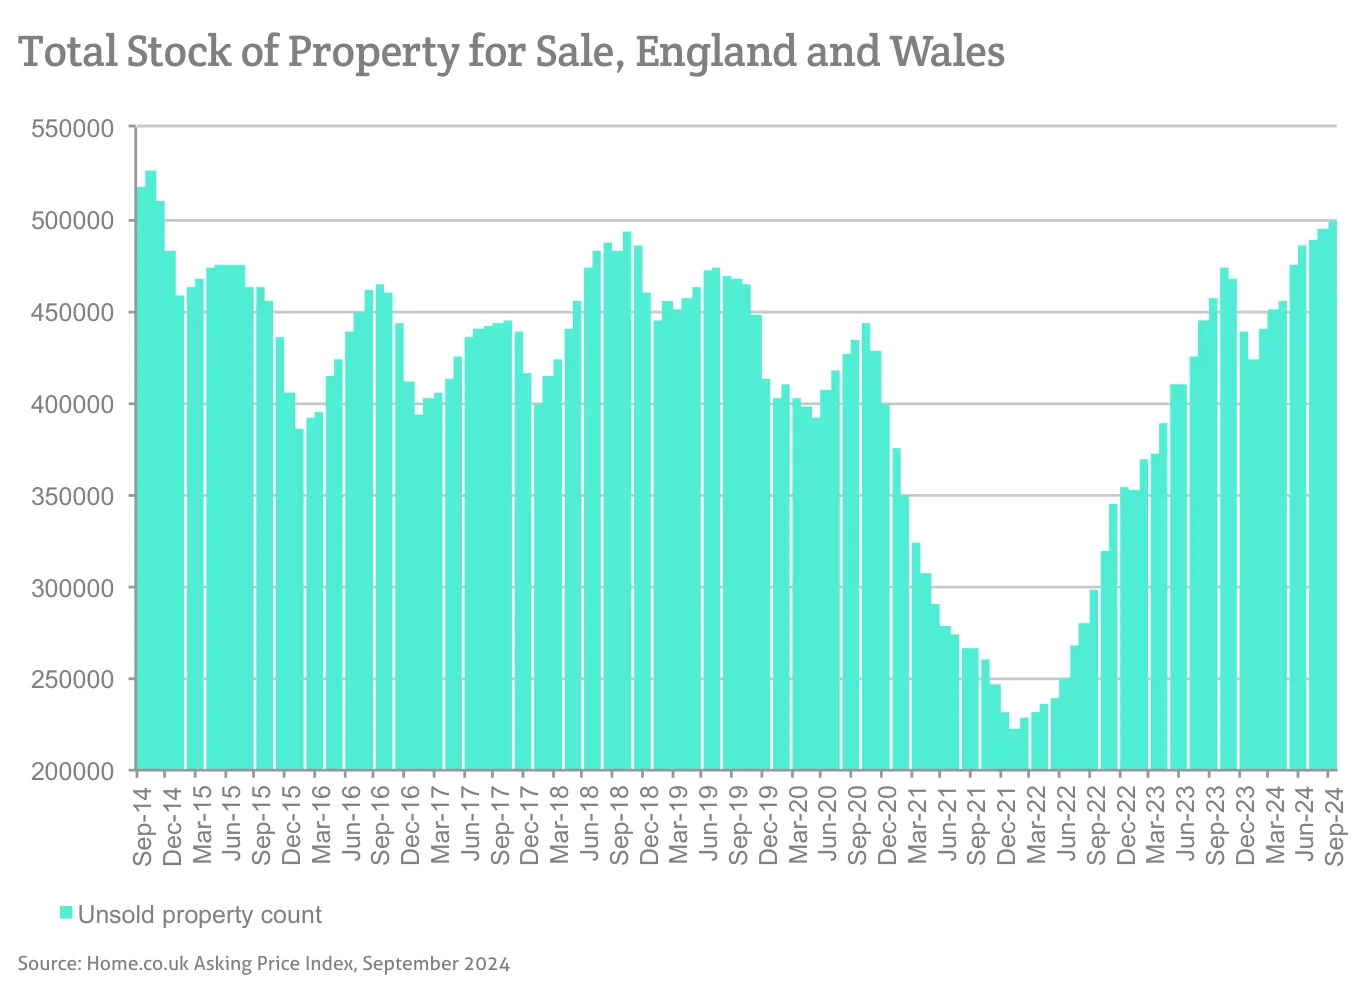
Source: Home.co.uk Asking Price Index, September 2024
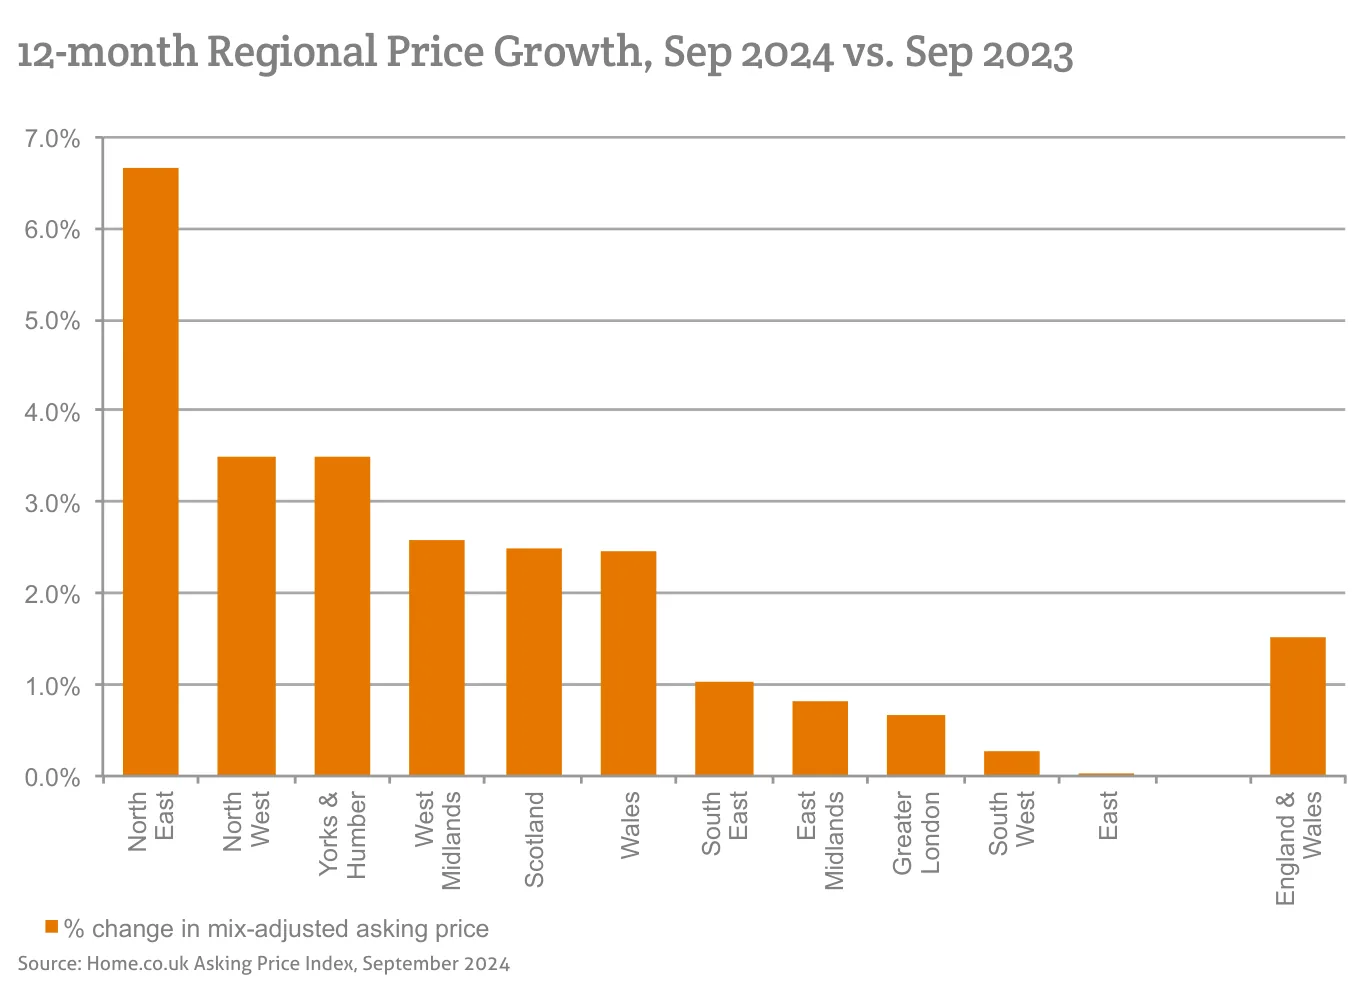
Source: Home.co.uk Asking Price Index, September 2024
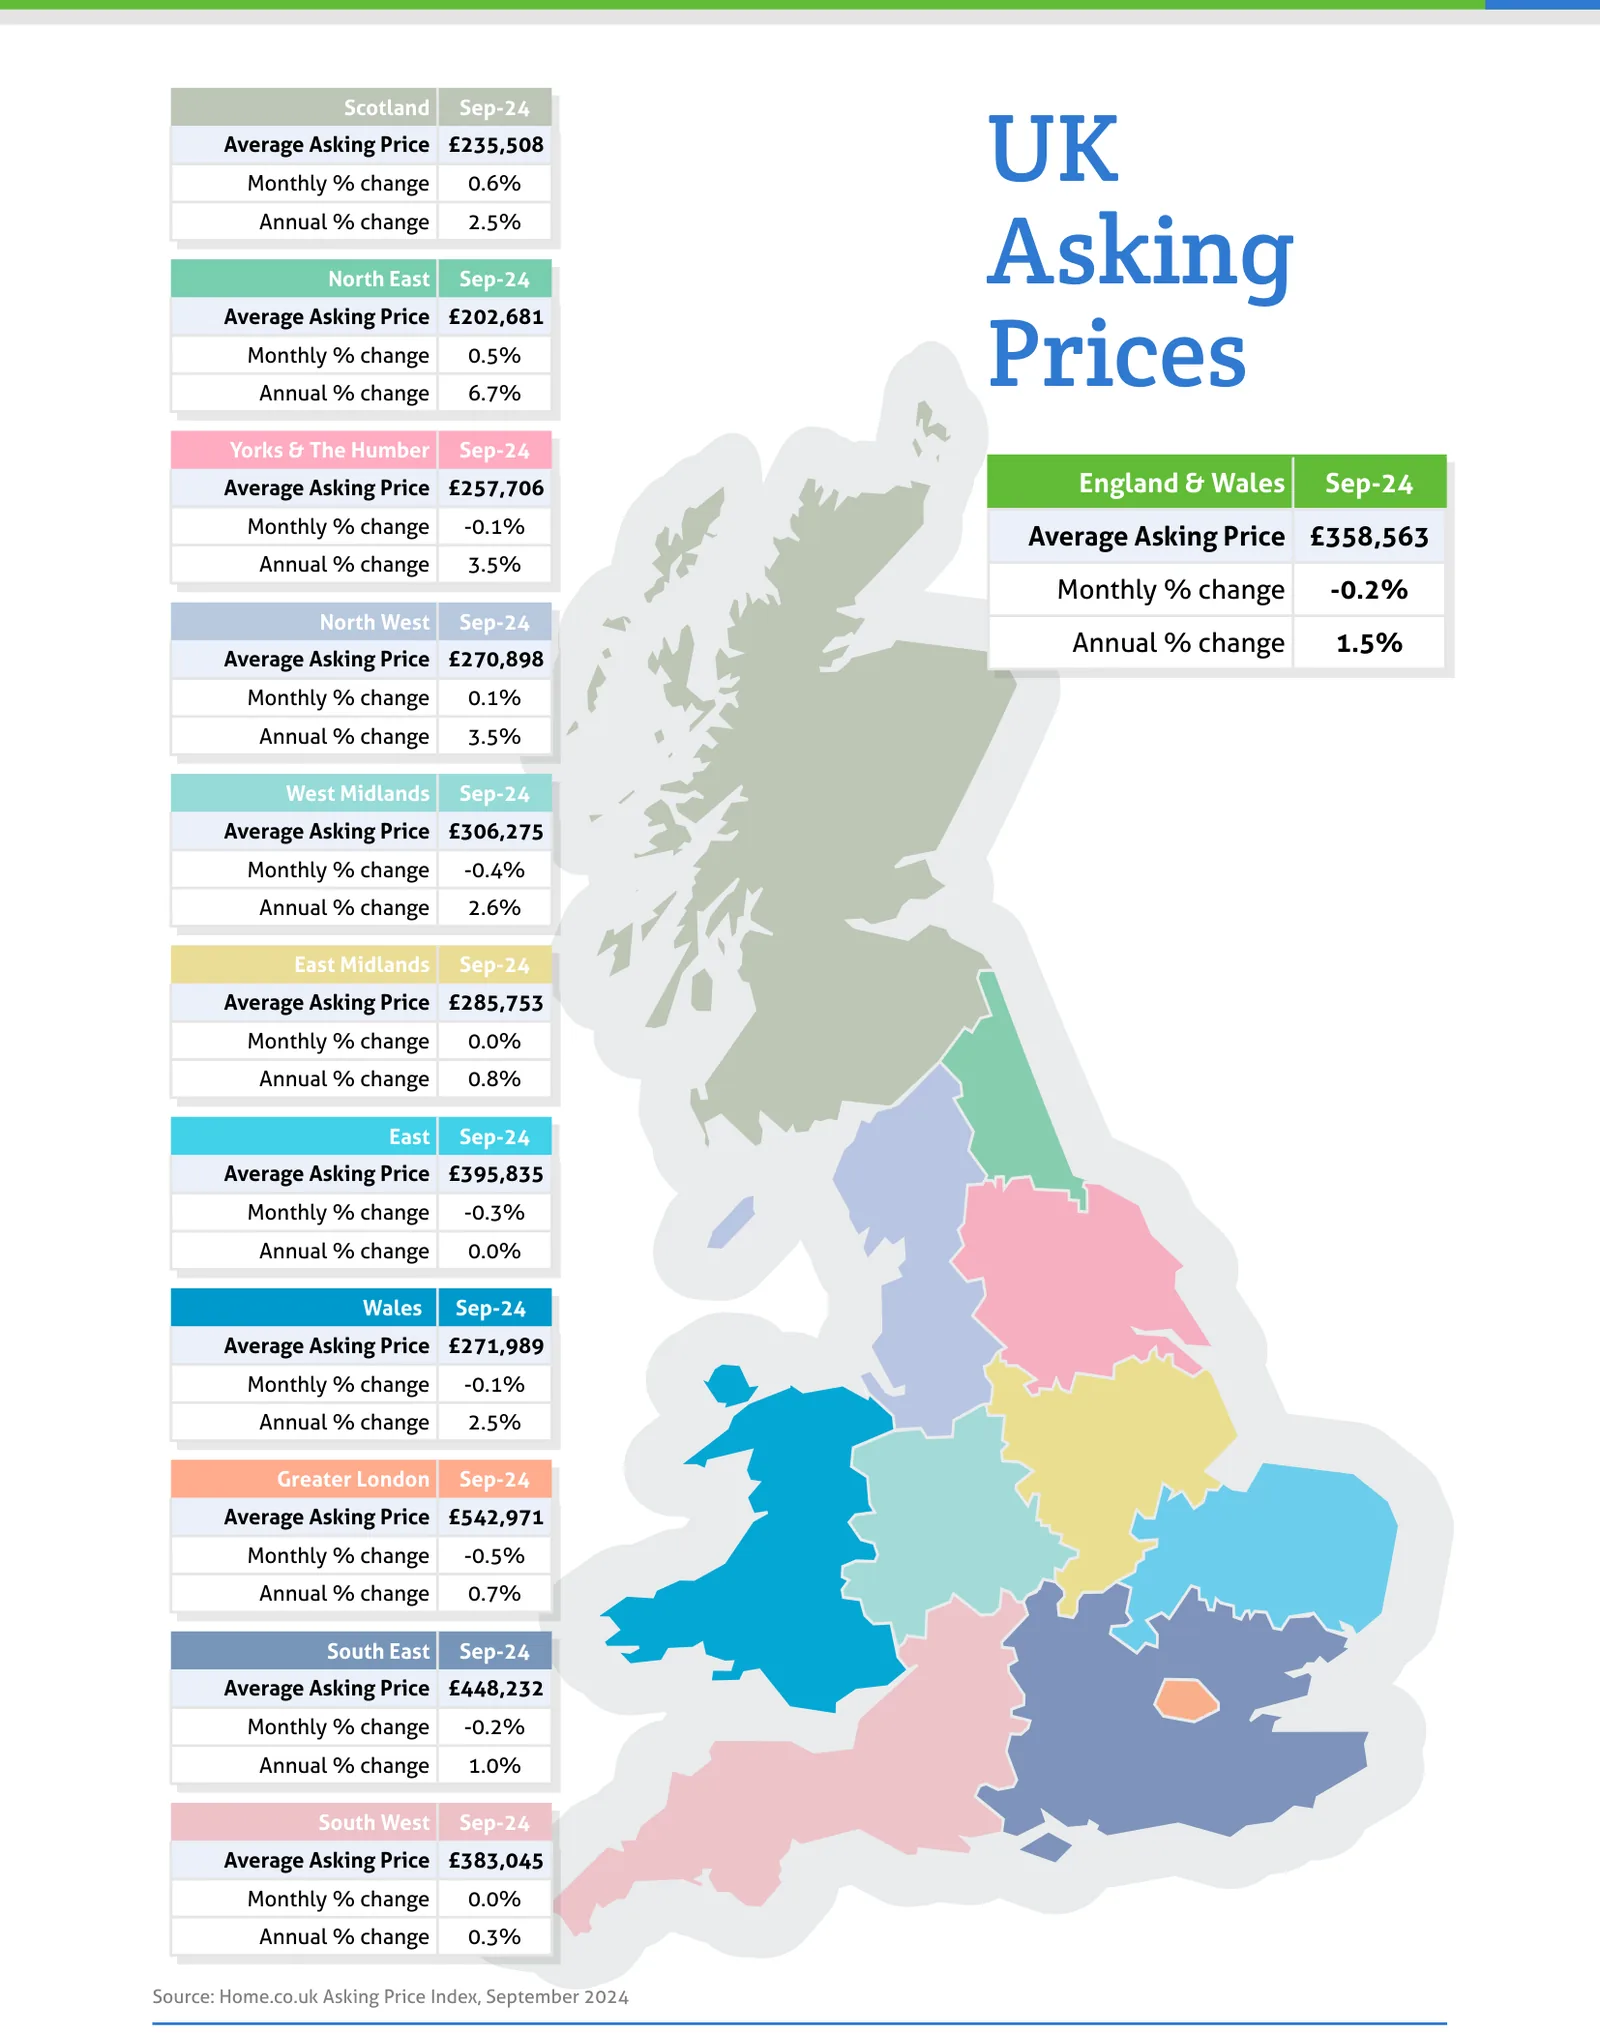
Source: Home.co.uk Asking Price Index, September 2024
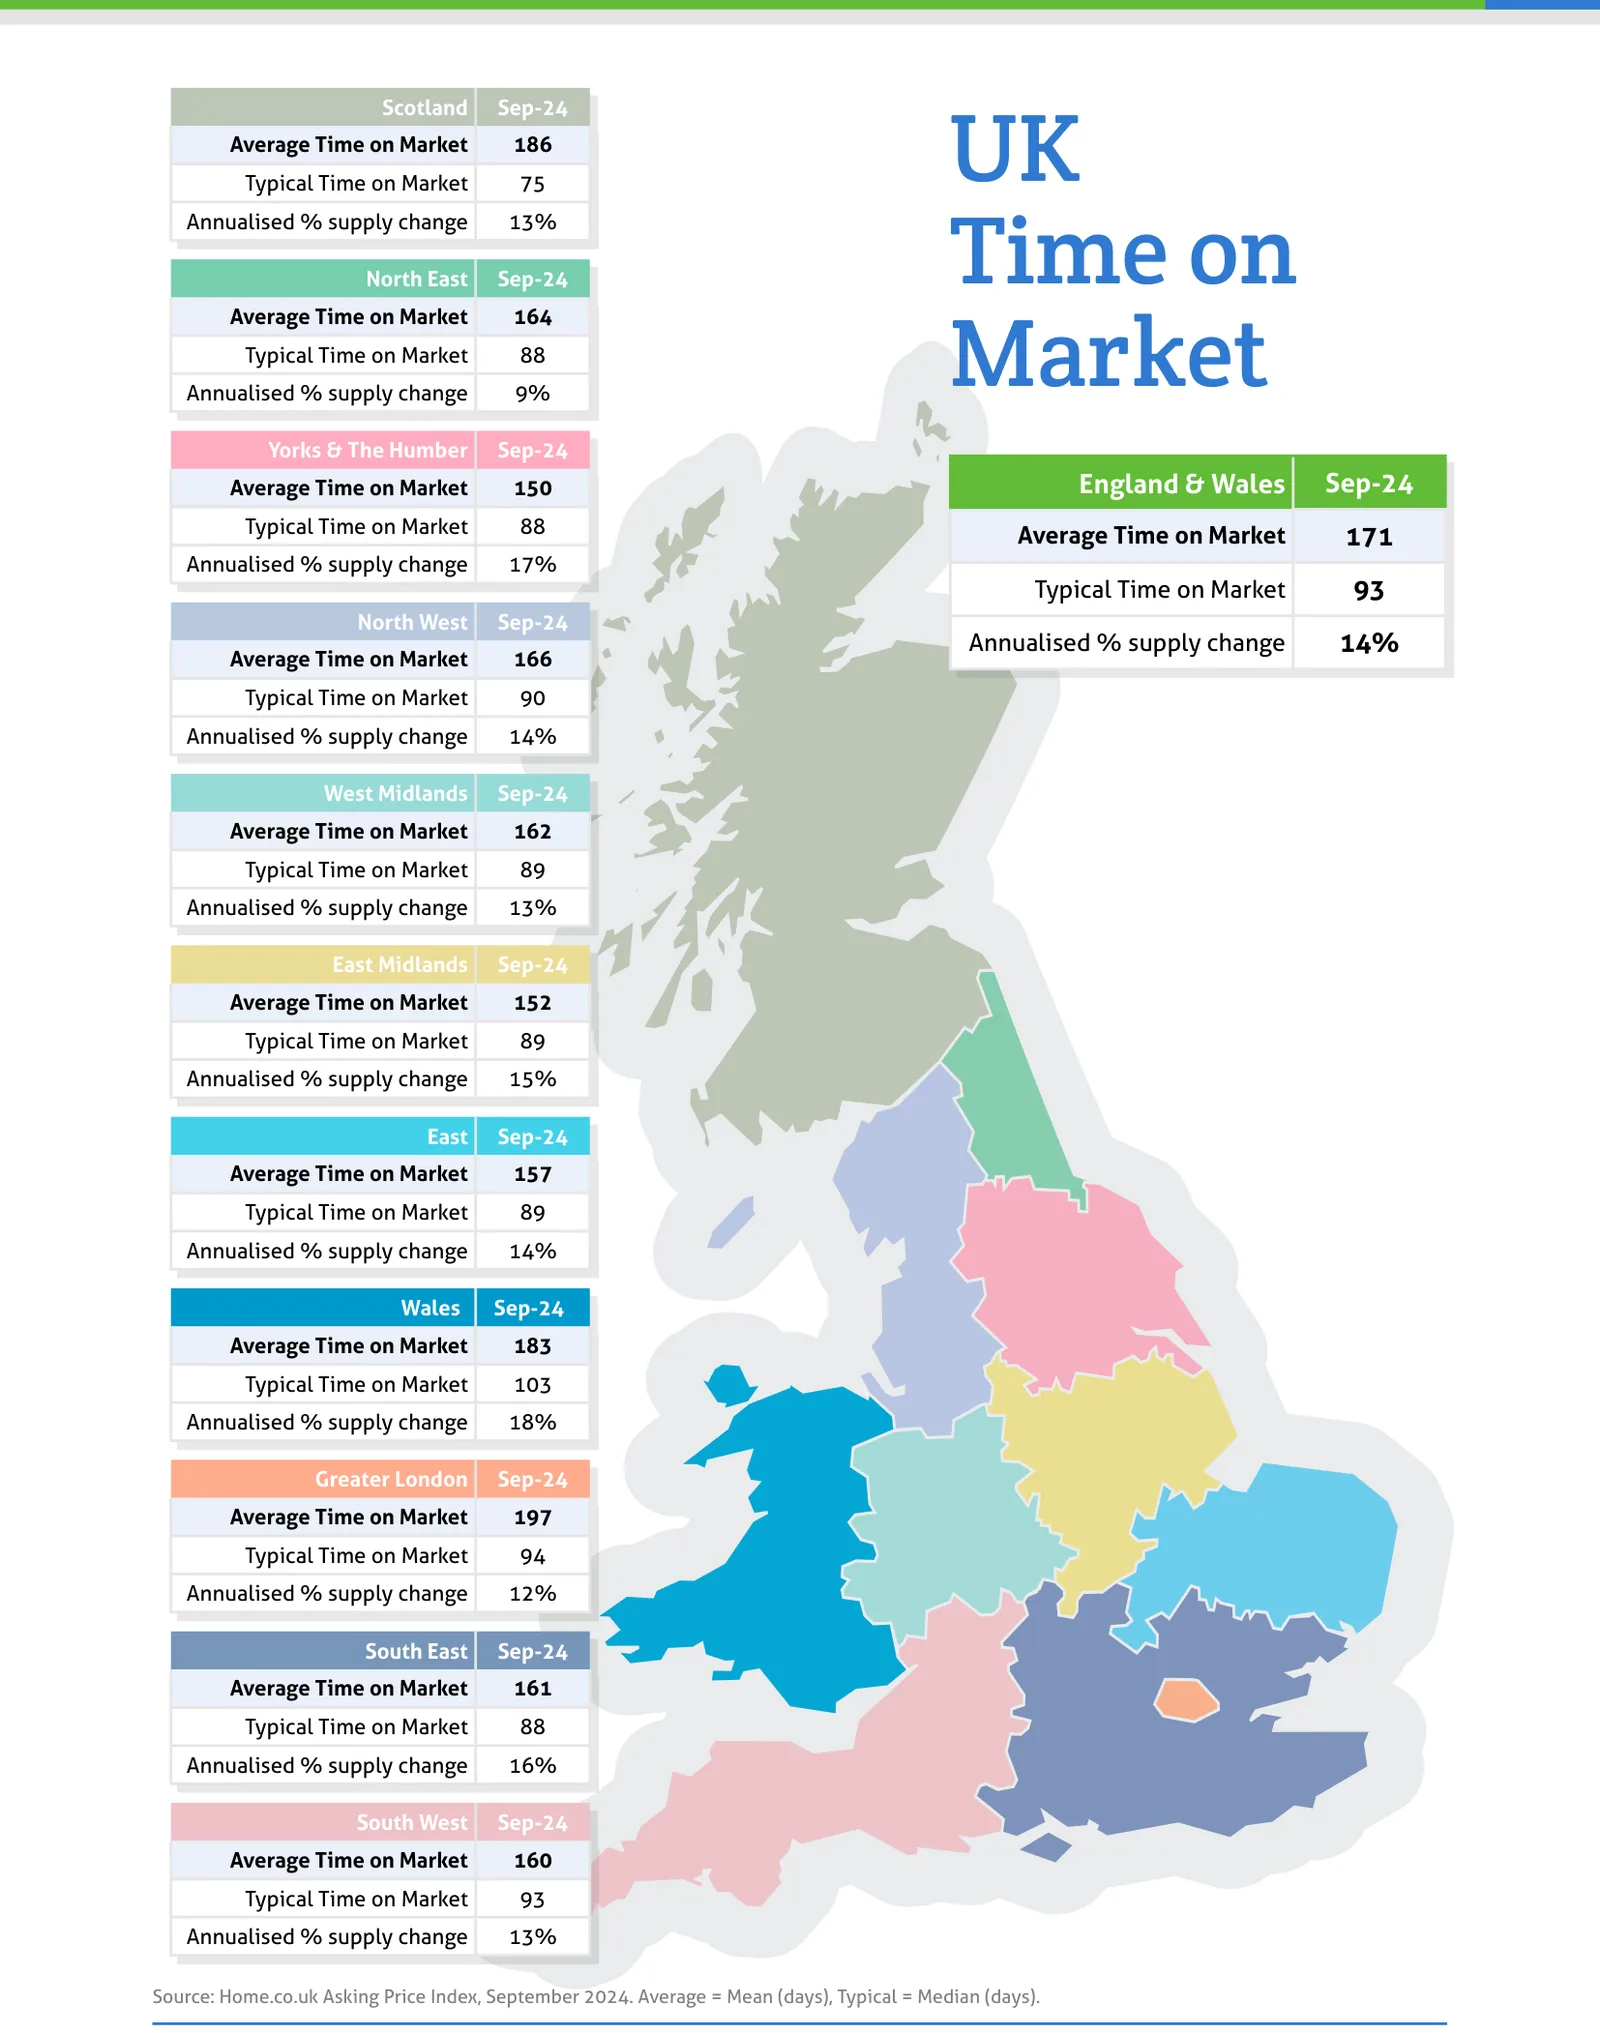
Source: Home.co.uk Asking Price Index, September 2024. Average = Mean (days), Typical = Median (days).
Regional tables
UK Asking Prices, Sep-24
| Region | Average Asking Price | Monthly % change | Annual % change |
|---|---|---|---|
| Scotland | £235,508 | 0.6% | 2.5% |
| North East | £202,681 | 0.5% | 6.7% |
| Yorks & The Humber | £257,706 | -0.1% | 3.5% |
| England & Wales | £358,563 | -0.2% | 1.5% |
| North West | £270,898 | 0.1% | 3.5% |
| West Midlands | £306,275 | -0.4% | 2.6% |
| East Midlands | £285,753 | 0.0% | 0.8% |
| East | £395,835 | -0.3% | 0.0% |
| Wales | £271,989 | -0.1% | 2.5% |
| Greater London | £542,971 | -0.5% | 0.7% |
| South East | £448,232 | -0.2% | 1.0% |
| South West | £383,045 | 0.0% | 0.3% |
UK Time on Market, Sep-24
| Region | Average Time on Market | Typical Time on Market | Annualised % supply change |
|---|---|---|---|
| Scotland | 186 | 75 | 13% |
| North East | 164 | 88 | 9% |
| Yorks & The Humber | 150 | 88 | 17% |
| England & Wales | 171 | 93 | 14% |
| North West | 166 | 90 | 14% |
| West Midlands | 162 | 89 | 13% |
| East Midlands | 152 | 89 | 15% |
| East | 157 | 89 | 14% |
| Wales | 183 | 103 | 18% |
| Greater London | 197 | 94 | 12% |
| South East | 161 | 88 | 16% |
| South West | 160 | 93 | 13% |
From the director's commentary
"Cornered in a Sadiq Khan ULEZ and threatened by Keir Starmer's ruthless tax plans, they've had enough. Just a glance at London's poor price growth over the last ten years (16.5%) compared to inflation over the same period which, according to the RPI, is 51.4%, suggests that they've perhaps hung on too long."
Doug Shephard, Director at Home.co.uk
Read the full September 2024 edition (PDF, 10 pages)
About the Home Asking Price Index
The Home Asking Price Index measures the change in the prices sellers ask for residential property across England, Wales and Scotland. Today it is computed every month from around half a million advertised homes and is mix-adjusted, so a change in what happens to be on the market does not move the figure; earlier editions state the sample they were built from. Because an asking price is set months before a sale completes, the index runs around five months ahead of completed-sale measures such as the UK House Price Index.
Every edition in the archive, back to October 2006, is listed on the index page. How we measure the UK property market explains the listing data behind it, and today's figures by area are on house prices and rental prices.
Text and figures above are quoted from the September 2024 edition as published, with punctuation normalised for the web, and are not revised. Later editions may restate them.
More in What is happening to house prices: the Home guide
Thinking about your next move?
See what your home's worth in seconds, with the UK's longest-running property data behind it.
Get an instant valuation