

























Home Asking Price Index, September 2023: prices wilt but marketing times remain below pre-COVID figures
Average asking prices in England and Wales fell 0.4% in August, leaving them down 1.8% year on year while unsold stock rose to 456,548.

This is the September 2023 edition of the Home Asking Price Index, released on 13 September 2023, under the headline:
Prices Wilt but Marketing Times Remain Below Pre-COVID Figures
The headlines and summary below are the report's own words, with the key figures as it published them, followed by the report's charts and regional tables as printed.
Headlines
- Asking prices across England and Wales have slipped a further 0.4% since last month, although the year-on-year fall remains just -1.8%.
- The Typical Time on Market for unsold property in England and Wales increased by four days during August, which is consistent with seasonal expectations again. The current median is 84 days; in September 2019 the same measure was 96 days.
- The total sales stock count for England and Wales continues to rise but as yet remains below the total for September 2019. The current total of unsold property is 456,548.
- Prices fell in most English regions and Wales since last month, but rose in the North East, Yorkshire and Scotland, confirming the continued strength of these northern markets.
- Most notably, the supply rate of new instructions entering the market remains restrained: down 4% vs. August 2022 and down 10% vs. August 2018. No increases at the regional level were observed.
- The Scottish property market remains the leader in terms of annualised price growth (5.7%), while falls in the East of England amount to -3.4%, making it the hardest hit English region.
- Rents across the UK continue to rise overall (11.0% annualised) and are now led by the North West (up 15.6%). Small increases in supply are observable but this is from a very low base in most regions.
- The current rent growth leaders in London asking rents are still the boroughs of Bexley and Hillingdon (+35% and +27% annualised respectively).
Summary
Rising borrowing costs are putting the squeeze on asking prices. Home values slipped for the second consecutive month albeit not as sudden and profound as the drop seen in December 2022. Supply and demand are rebalancing in an orderly manner, with little or no panic-selling and no buyers' strike. Residual demand and a strong rental market mean the market is not stagnating but marketing times are significantly higher than a year ago, during the final months of the post-COVID boom. However, the market retains sufficient momentum to indicate that the Typical Time on Market for England and Wales is significantly lower than in either 2018 or 2019.
Prices did not fall in all regions last month. The North East and Yorkshire both posted modest rises while Scotland added a whopping 1.4% to the mix-adjusted average. The northern regions, Wales and Scotland all continue to show the best price performance and elevated momentum (more than in pre-COVID years), thanks to considerable residual demand.
Rents continue their rapid rise in most English regions, Scotland and Wales, although there are signs of slight cooling in the Welsh and London markets. Overall, the mix-adjusted average annualised rise for the UK stands at 11.0%, while rent inflation in the North West now leads the regional growth table at 15.6%.
Key figures
| Measure | Figure |
|---|---|
| Monthly change in asking prices | -0.4% |
| Annual change in asking prices | -1.8% |
| Typical Time on Market | 84 days |
| Total unsold stock | 456,548 |
| New instructions vs August 2022 | -4% |
| New instructions vs August 2018 | -10% |
| UK average asking rent growth (annualised) | 11.0% |
| North West rent growth (annualised) | 15.6% |
Figures are for England and Wales unless the report states otherwise, as published in the edition.
Charts from the report
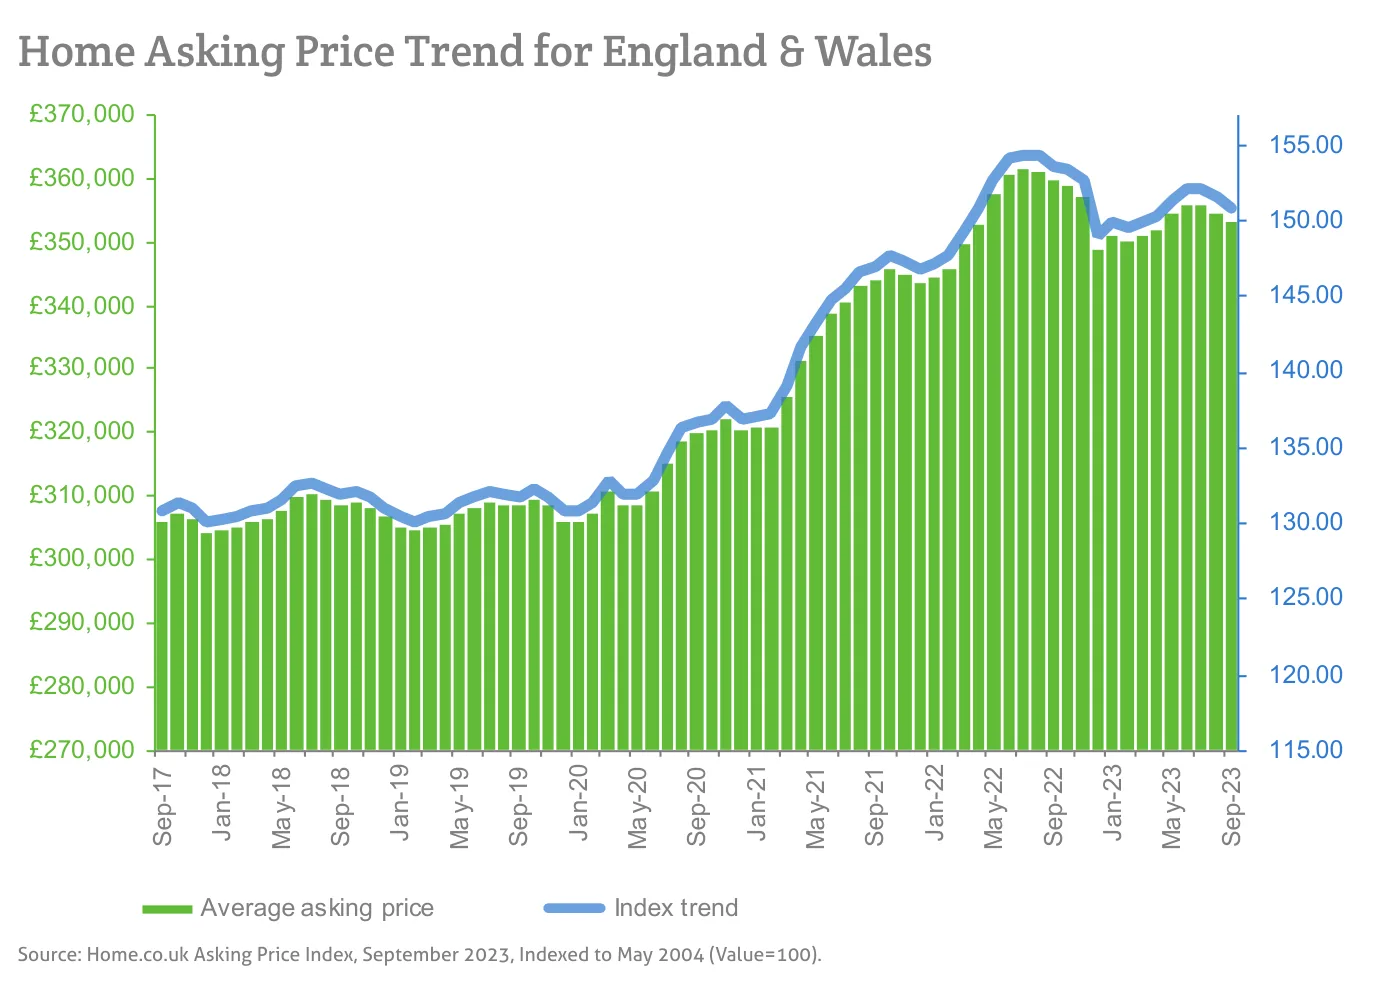
Source: Home.co.uk Asking Price Index, September 2023, Indexed to May 2004 (Value=100).
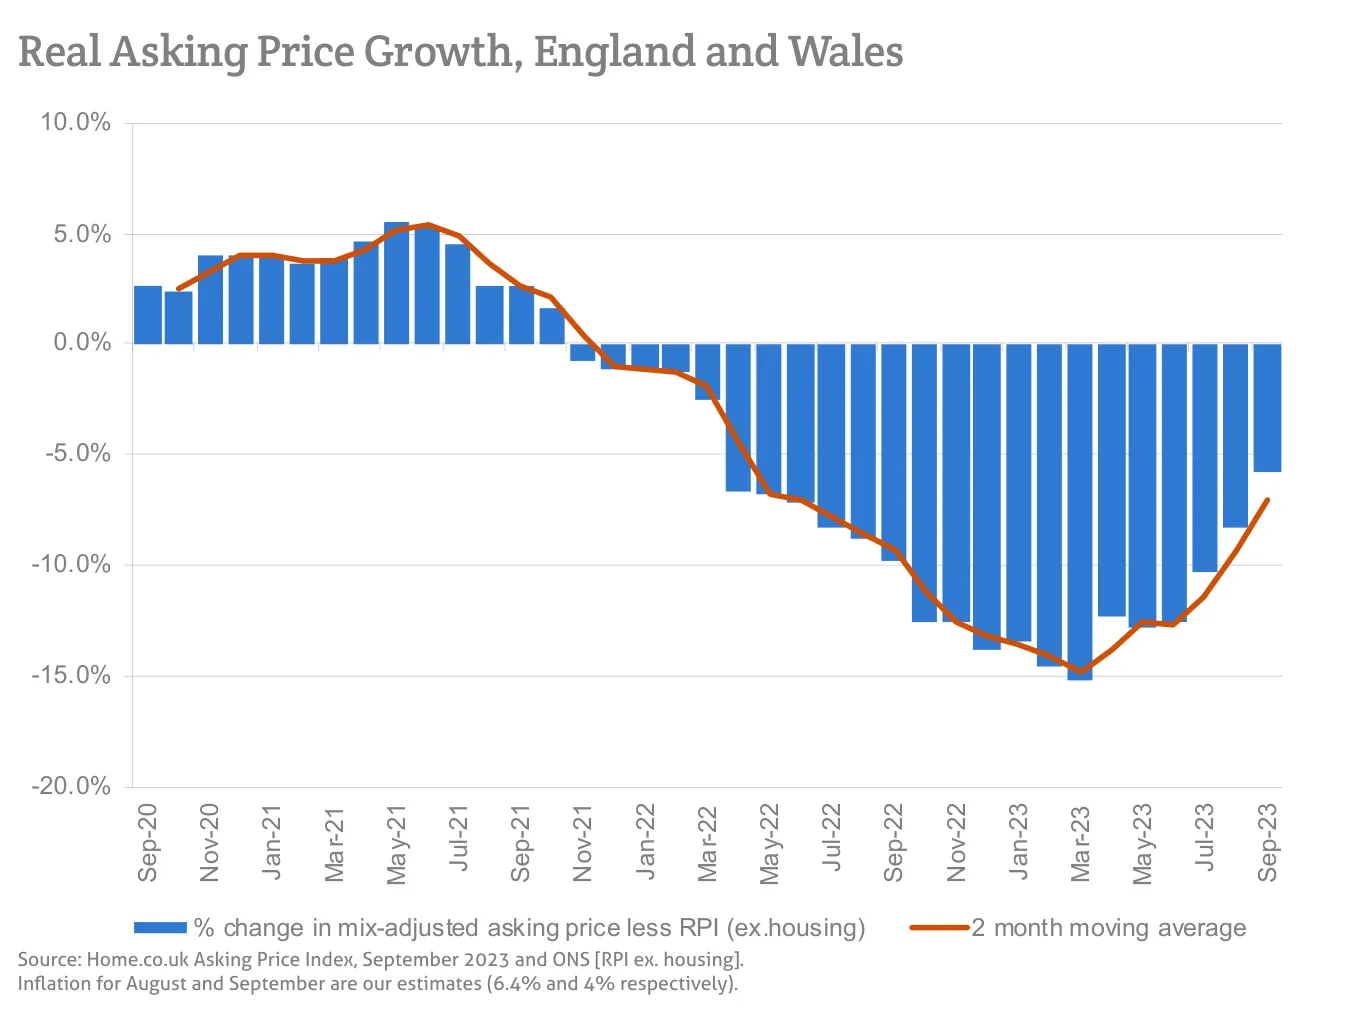
Source: Home.co.uk Asking Price Index, September 2023 and ONS [RPI ex. housing].
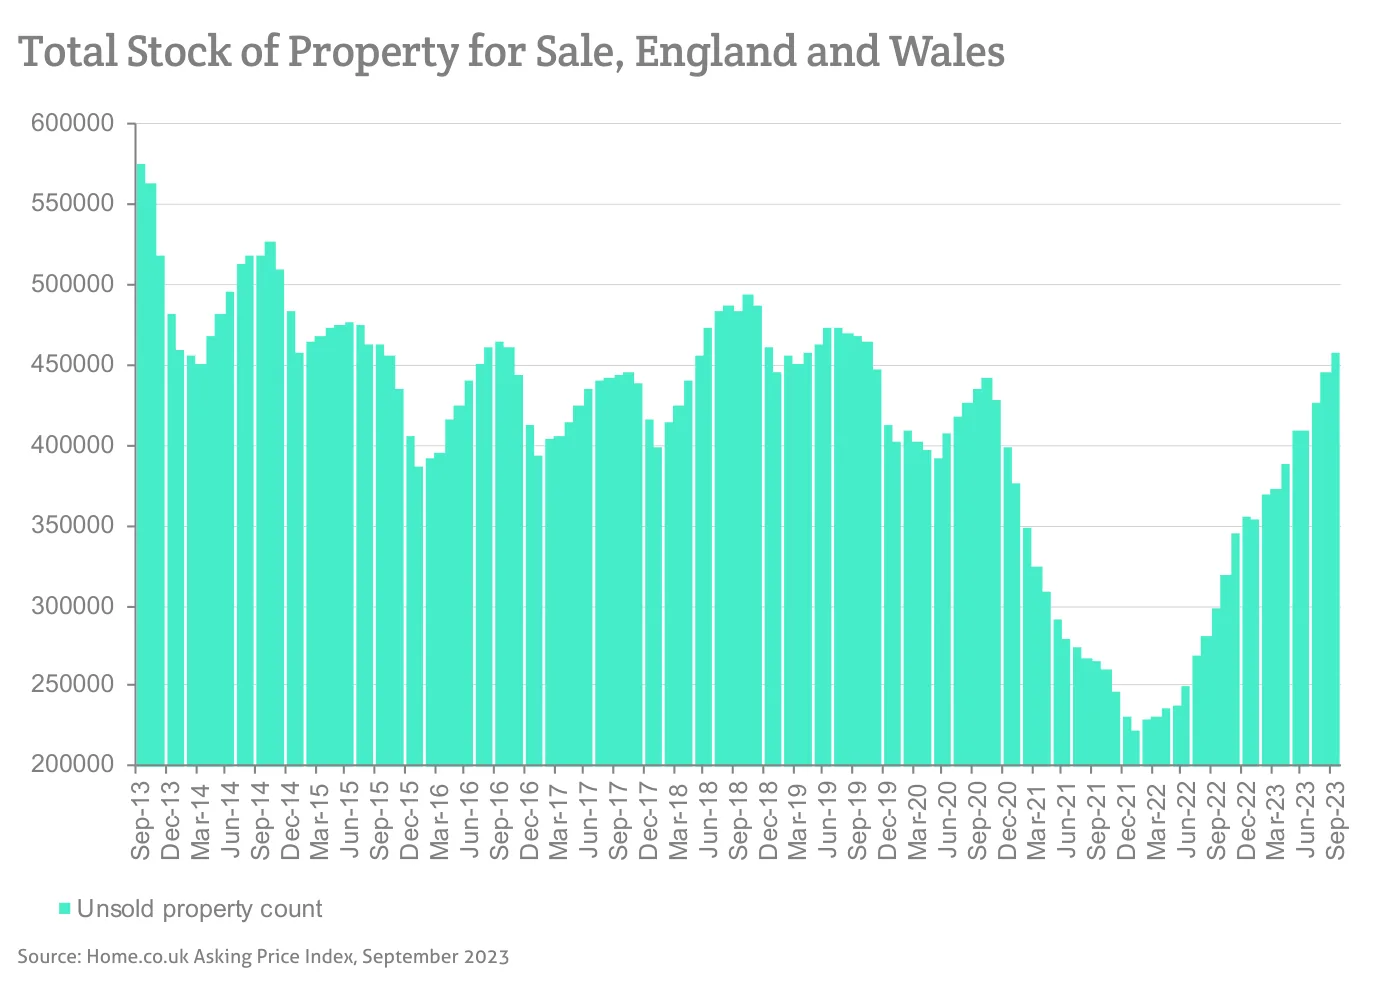
Source: Home.co.uk Asking Price Index, September 2023
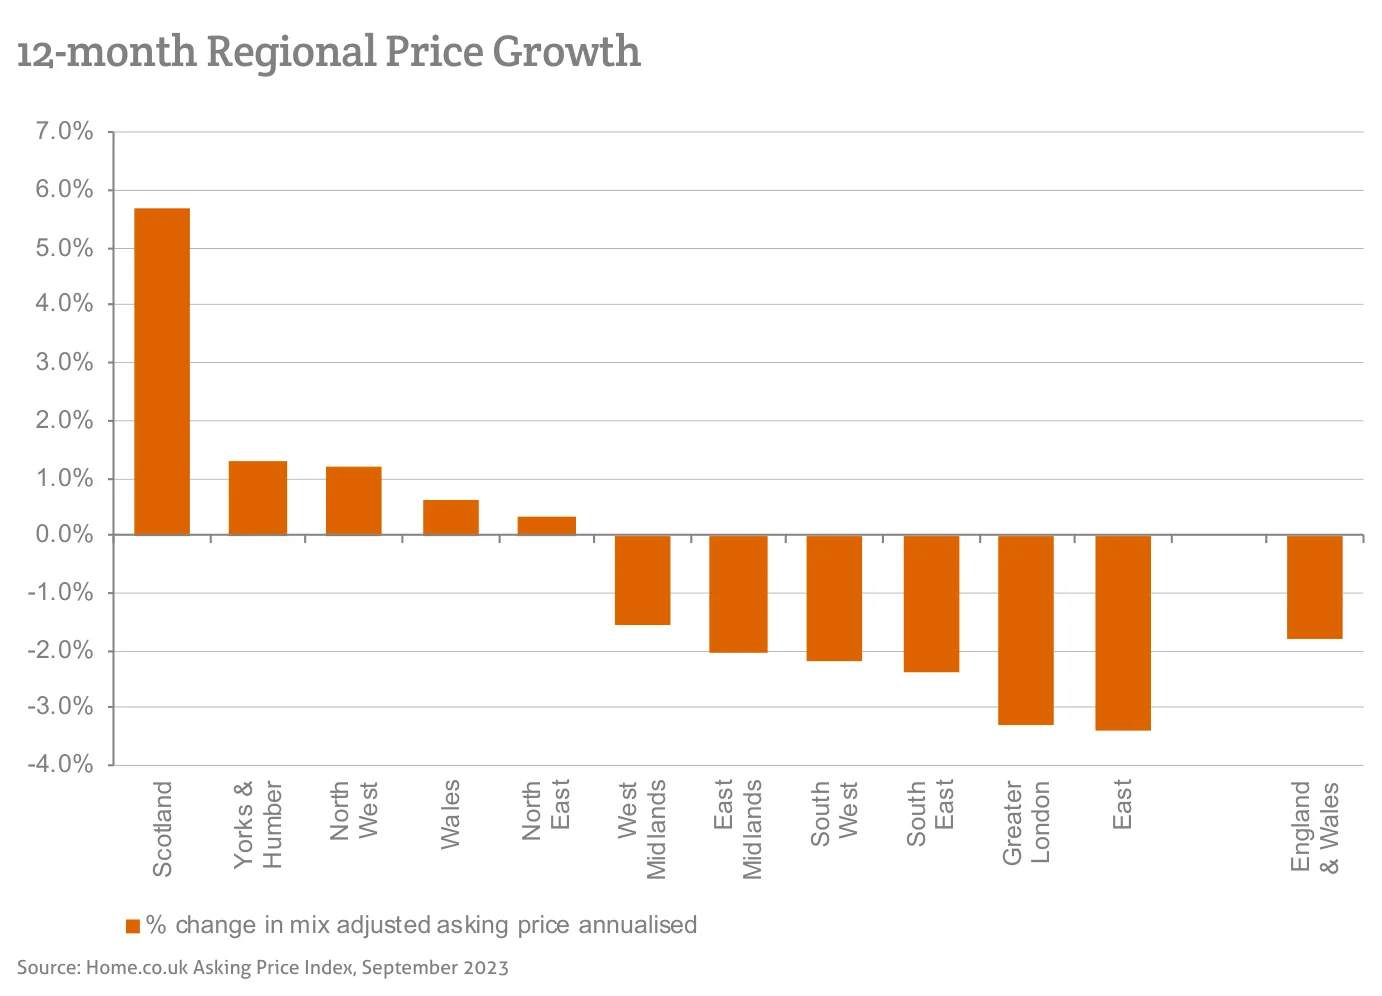
Source: Home.co.uk Asking Price Index, September 2023
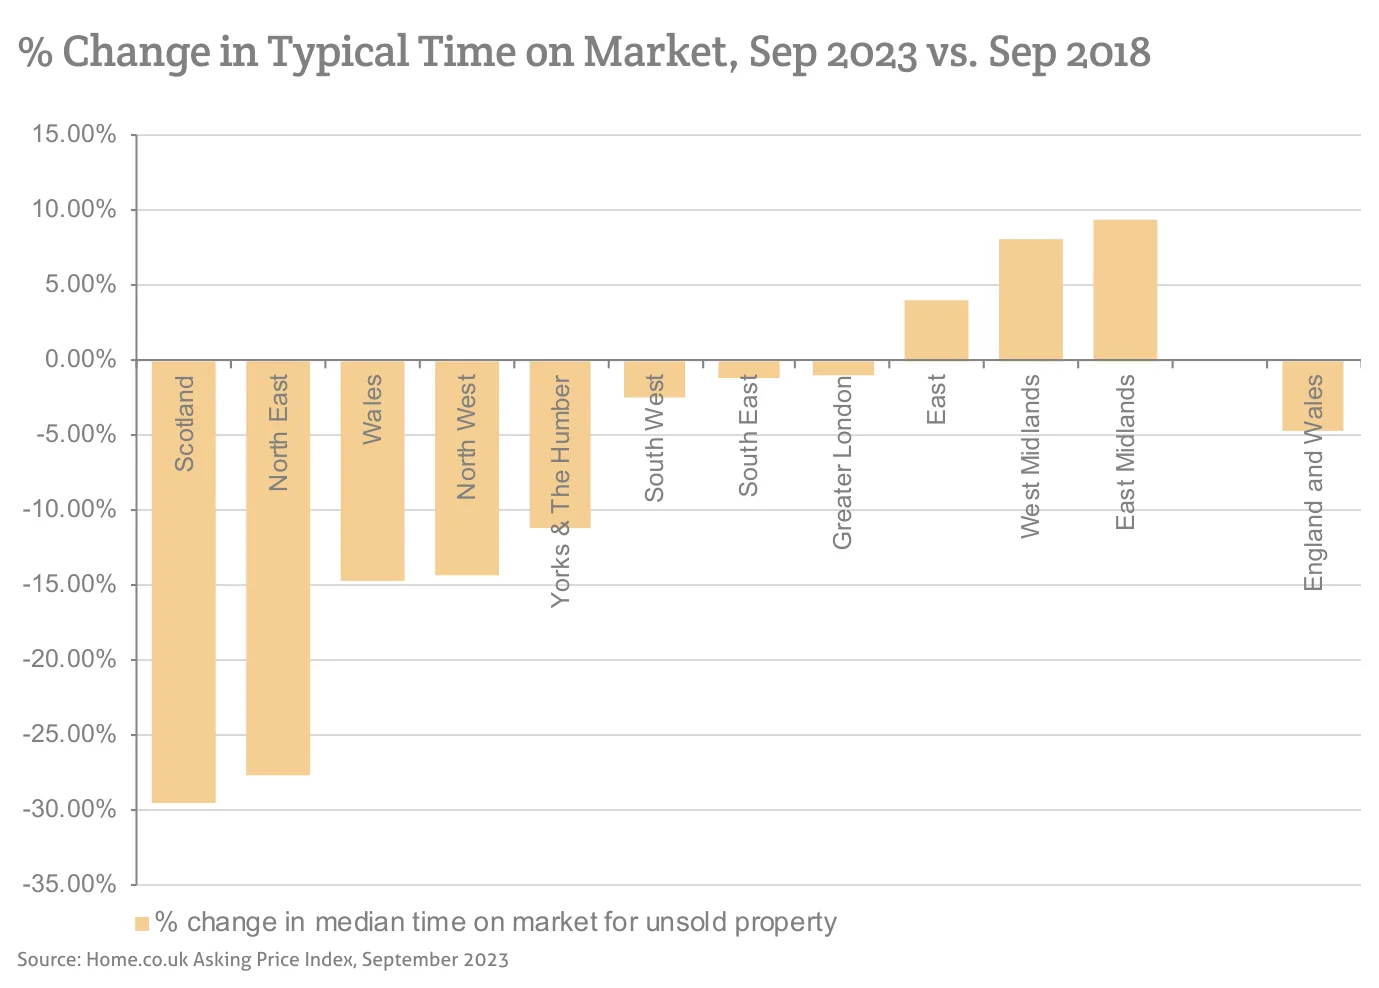
Source: Home.co.uk Asking Price Index, September 2023
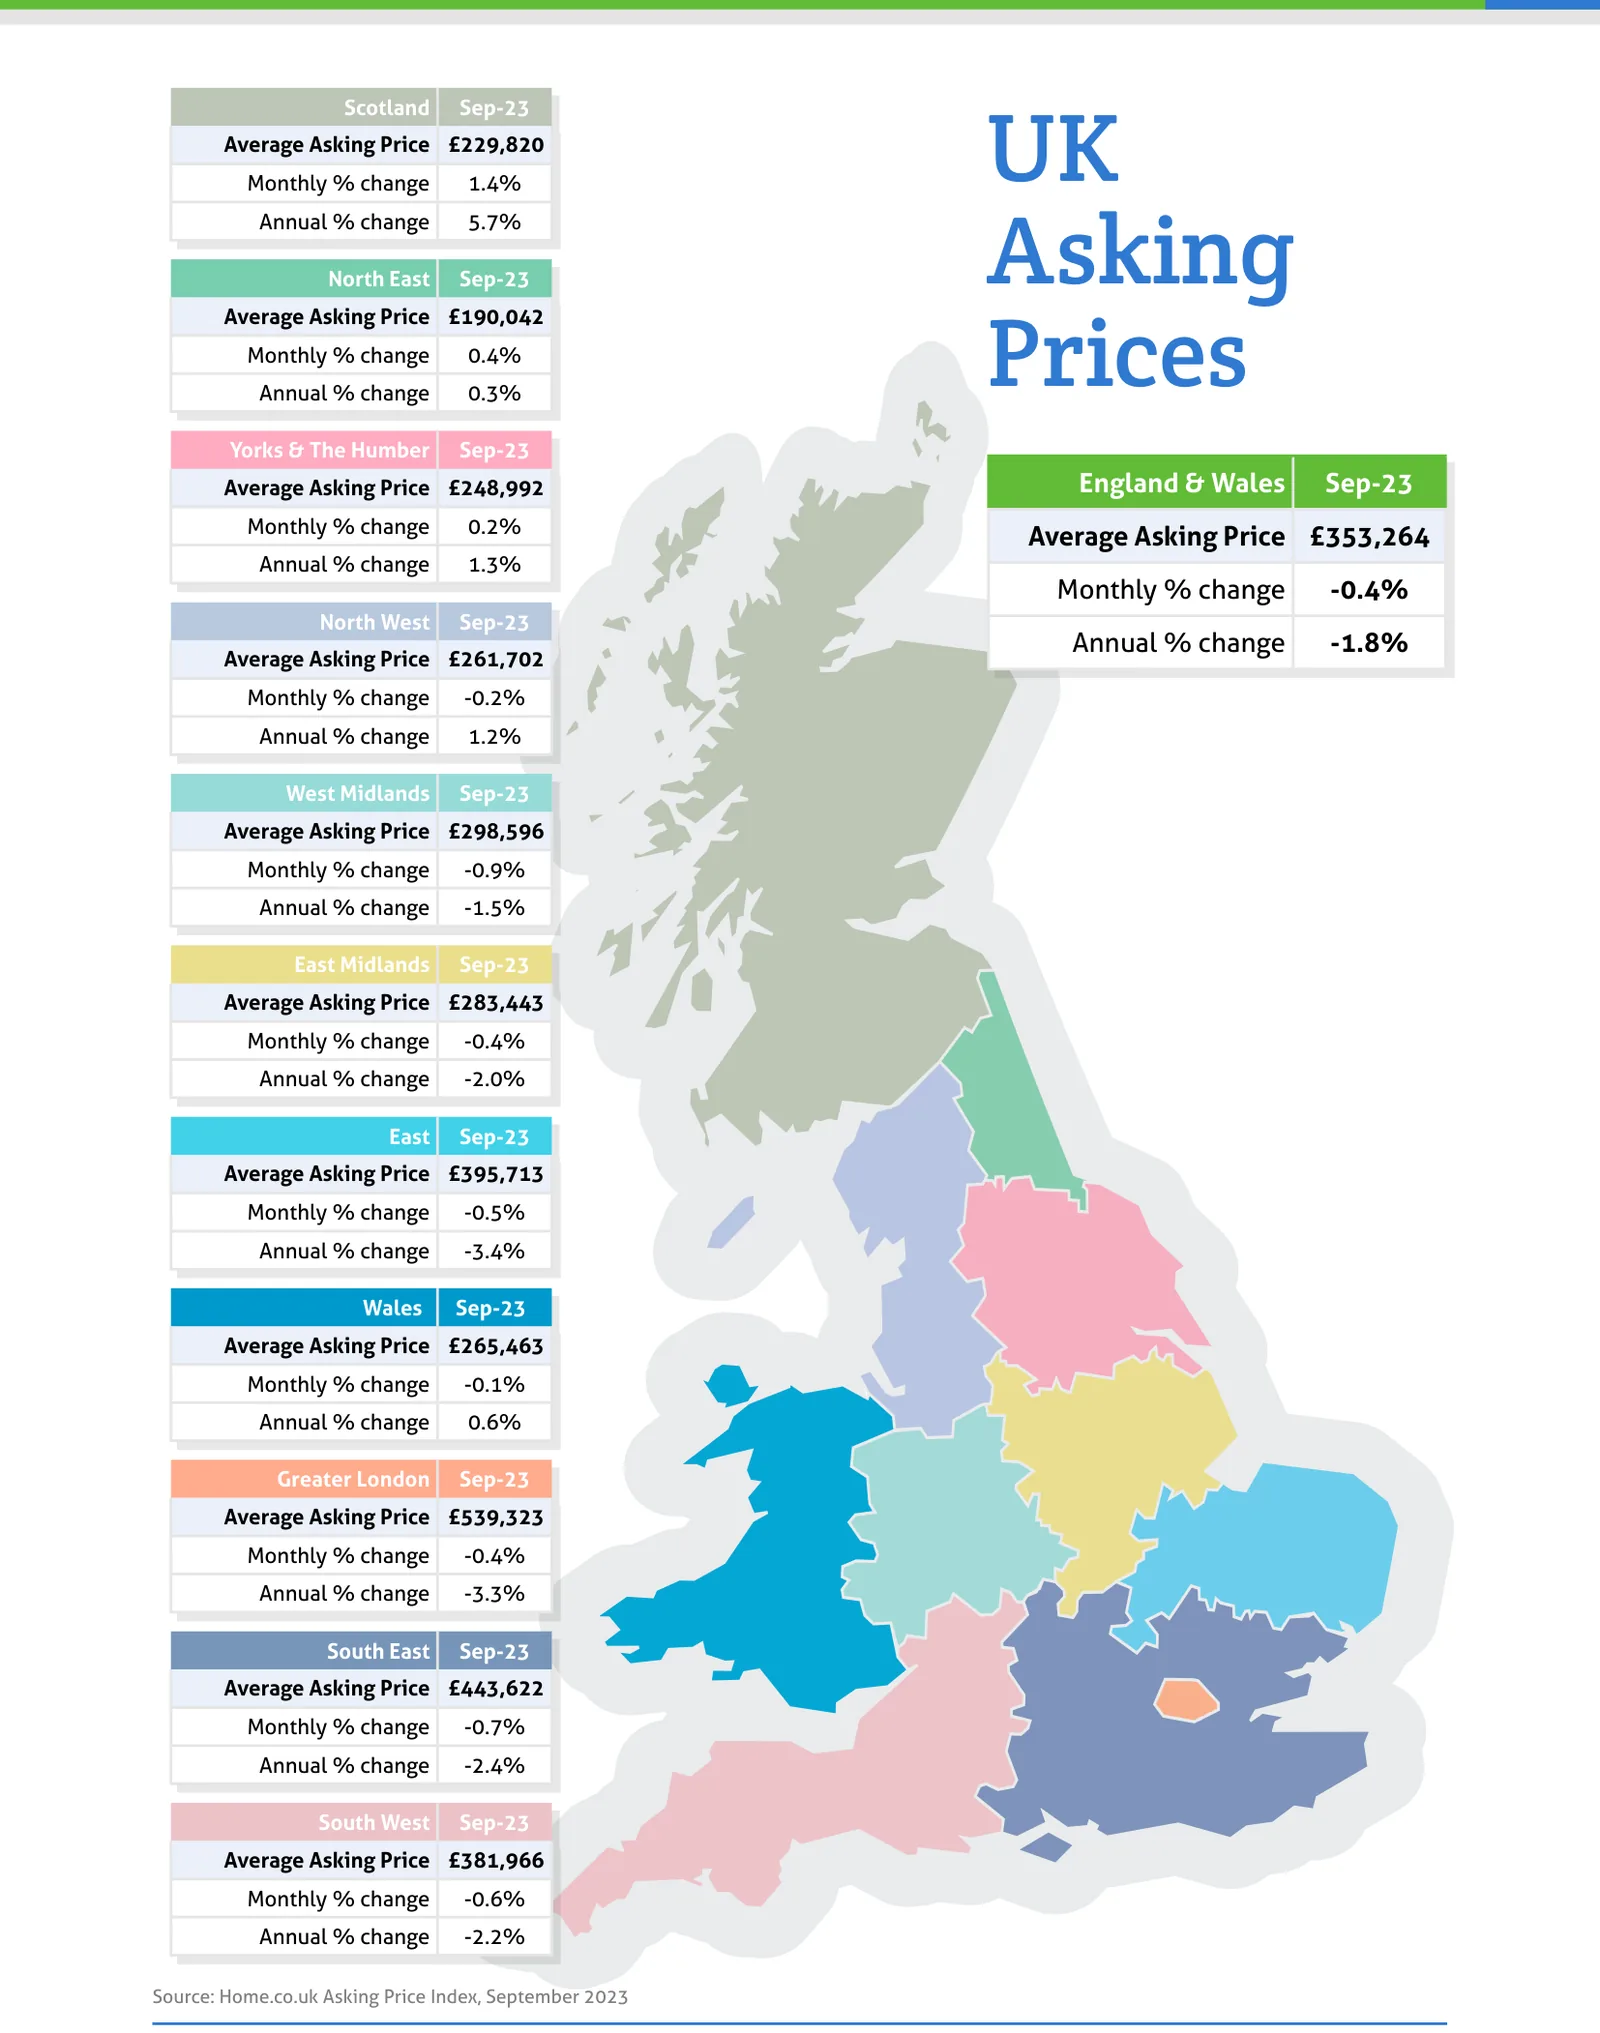
Source: Home.co.uk Asking Price Index, September 2023
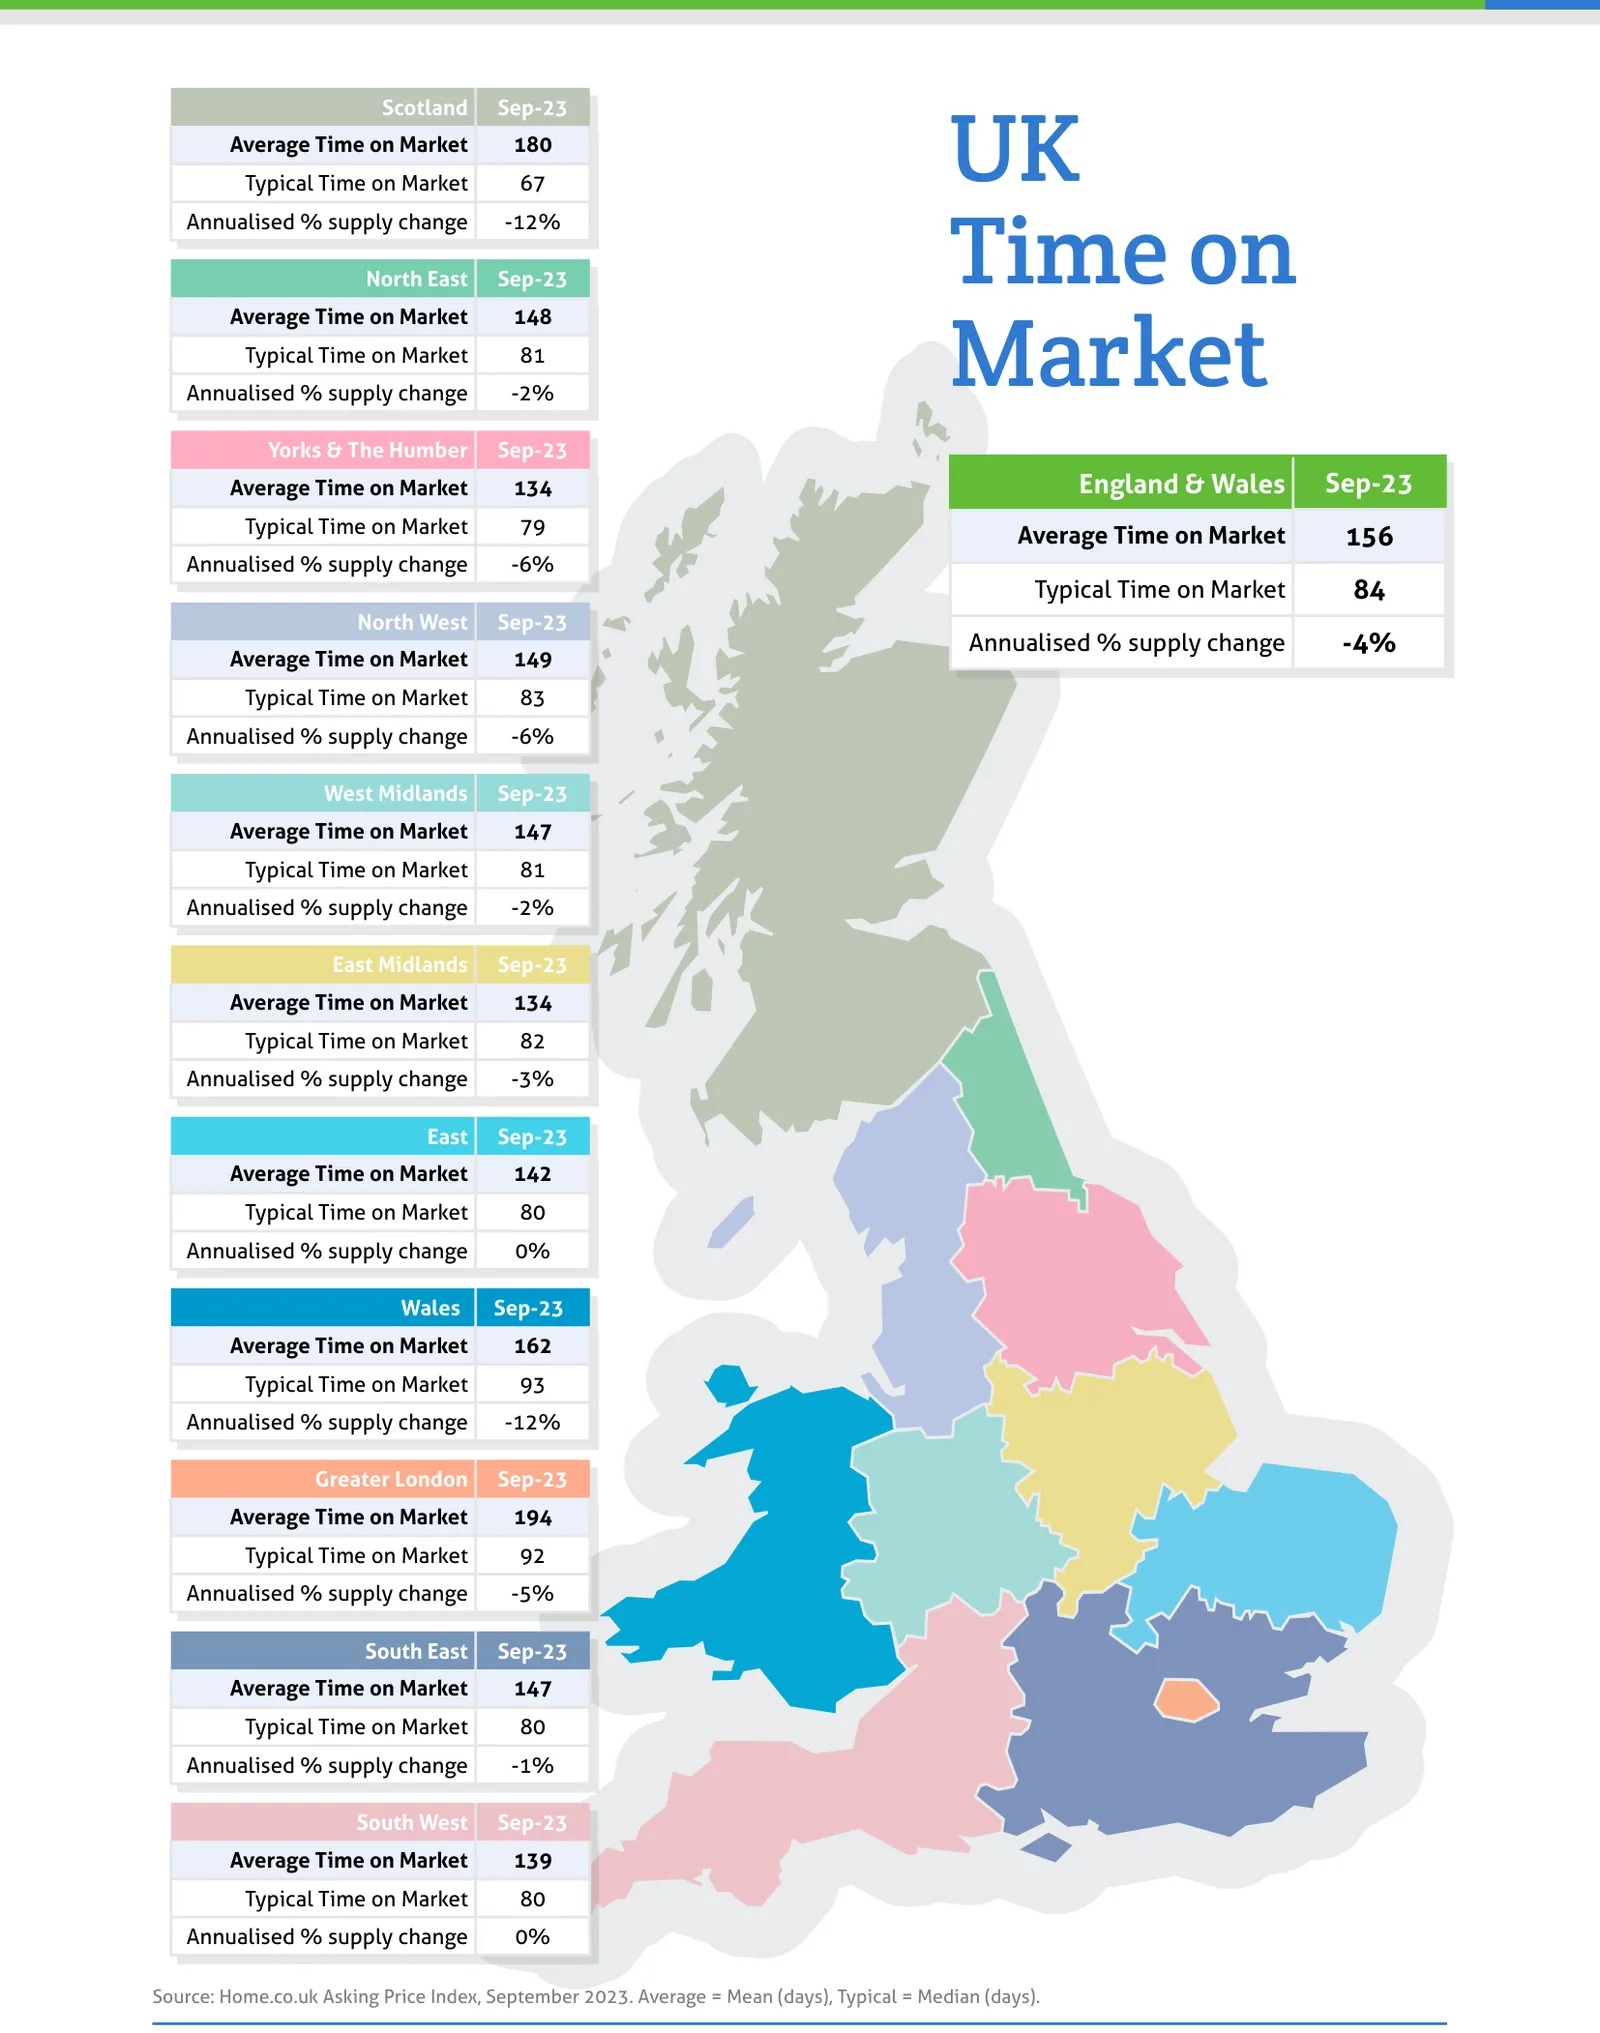
Source: Home.co.uk Asking Price Index, September 2023. Average = Mean (days), Typical = Median (days).
Regional tables
UK Asking Prices, Sep-23
| Region | Average Asking Price | Monthly % change | Annual % change |
|---|---|---|---|
| Scotland | £229,820 | 1.4% | 5.7% |
| North East | £190,042 | 0.4% | 0.3% |
| Yorks & The Humber | £248,992 | 0.2% | 1.3% |
| England & Wales | £353,264 | -0.4% | -1.8% |
| North West | £261,702 | -0.2% | 1.2% |
| West Midlands | £298,596 | -0.9% | -1.5% |
| East Midlands | £283,443 | -0.4% | -2.0% |
| East | £395,713 | -0.5% | -3.4% |
| Wales | £265,463 | -0.1% | 0.6% |
| Greater London | £539,323 | -0.4% | -3.3% |
| South East | £443,622 | -0.7% | -2.4% |
| South West | £381,966 | -0.6% | -2.2% |
UK Time on Market, Sep-23
| Region | Average Time on Market | Typical Time on Market | Annualised % supply change |
|---|---|---|---|
| Scotland | 180 | 67 | -12% |
| North East | 148 | 81 | -2% |
| Yorks & The Humber | 134 | 79 | -6% |
| England & Wales | 156 | 84 | -4% |
| North West | 149 | 83 | -6% |
| West Midlands | 147 | 81 | -2% |
| East Midlands | 134 | 82 | -3% |
| East | 142 | 80 | 0% |
| Wales | 162 | 93 | -12% |
| Greater London | 194 | 92 | -5% |
| South East | 147 | 80 | -1% |
| South West | 139 | 80 | 0% |
From the director's commentary
"Climate alarmism is driving this heavy-handed approach, which is clearly much more stick than carrot. Properties with poor EPCs will likely become more of a liability than an asset."
Doug Shephard, Director at Home.co.uk
Read the full September 2023 edition (PDF, 9 pages)
About the Home Asking Price Index
The Home Asking Price Index measures the change in the prices sellers ask for residential property across England, Wales and Scotland. Today it is computed every month from around half a million advertised homes and is mix-adjusted, so a change in what happens to be on the market does not move the figure; earlier editions state the sample they were built from. Because an asking price is set months before a sale completes, the index runs around five months ahead of completed-sale measures such as the UK House Price Index.
Every edition in the archive, back to October 2006, is listed on the index page. How we measure the UK property market explains the listing data behind it, and today's figures by area are on house prices and rental prices.
Text and figures above are quoted from the September 2023 edition as published, with punctuation normalised for the web, and are not revised. Later editions may restate them.
More in What is happening to house prices: the Home guide
Thinking about your next move?
See what your home's worth in seconds, with the UK's longest-running property data behind it.
Get an instant valuation