

























Home Asking Price Index, September 2022: the market corrects, prices cool as supply increases
England and Wales asking prices fell 0.4% in the month but remained 4.6% higher year-on-year as unsold stock and new instructions both rose.

This is the September 2022 edition of the Home Asking Price Index, released on 14 September 2022, under the headline:
The Market Corrects: Prices Cool as Supply Increases
The headlines and summary below are the report's own words, with the key figures as it published them, followed by the report's charts and regional tables as printed.
Headlines
- Asking prices across England and Wales have dipped slightly since August (by 0.4%), bringing the year-on-year rise to 4.6%, consistent with both seasonal expectations and typical price adjustments in the wake of a rapid surge.
- Good news for buyers as the total stock of property for sale in England and Wales ticked up again, albeit more strongly this month. However, it will take perhaps a year before total stock reaches what might be considered normal.
- No slowdown is evident as the Typical Time on Market (median) for unsold property remains unchanged at 65 days, 17 days less than in September 2021, indicating that properties continue to move through the market at a near-record pace.
- Supply of new instructions continues the upward trend, albeit from a very low base. Record-high prices are, as expected, encouraging more vendors to enter the market. 17% more properties were placed on the market last month compared to August 2021.
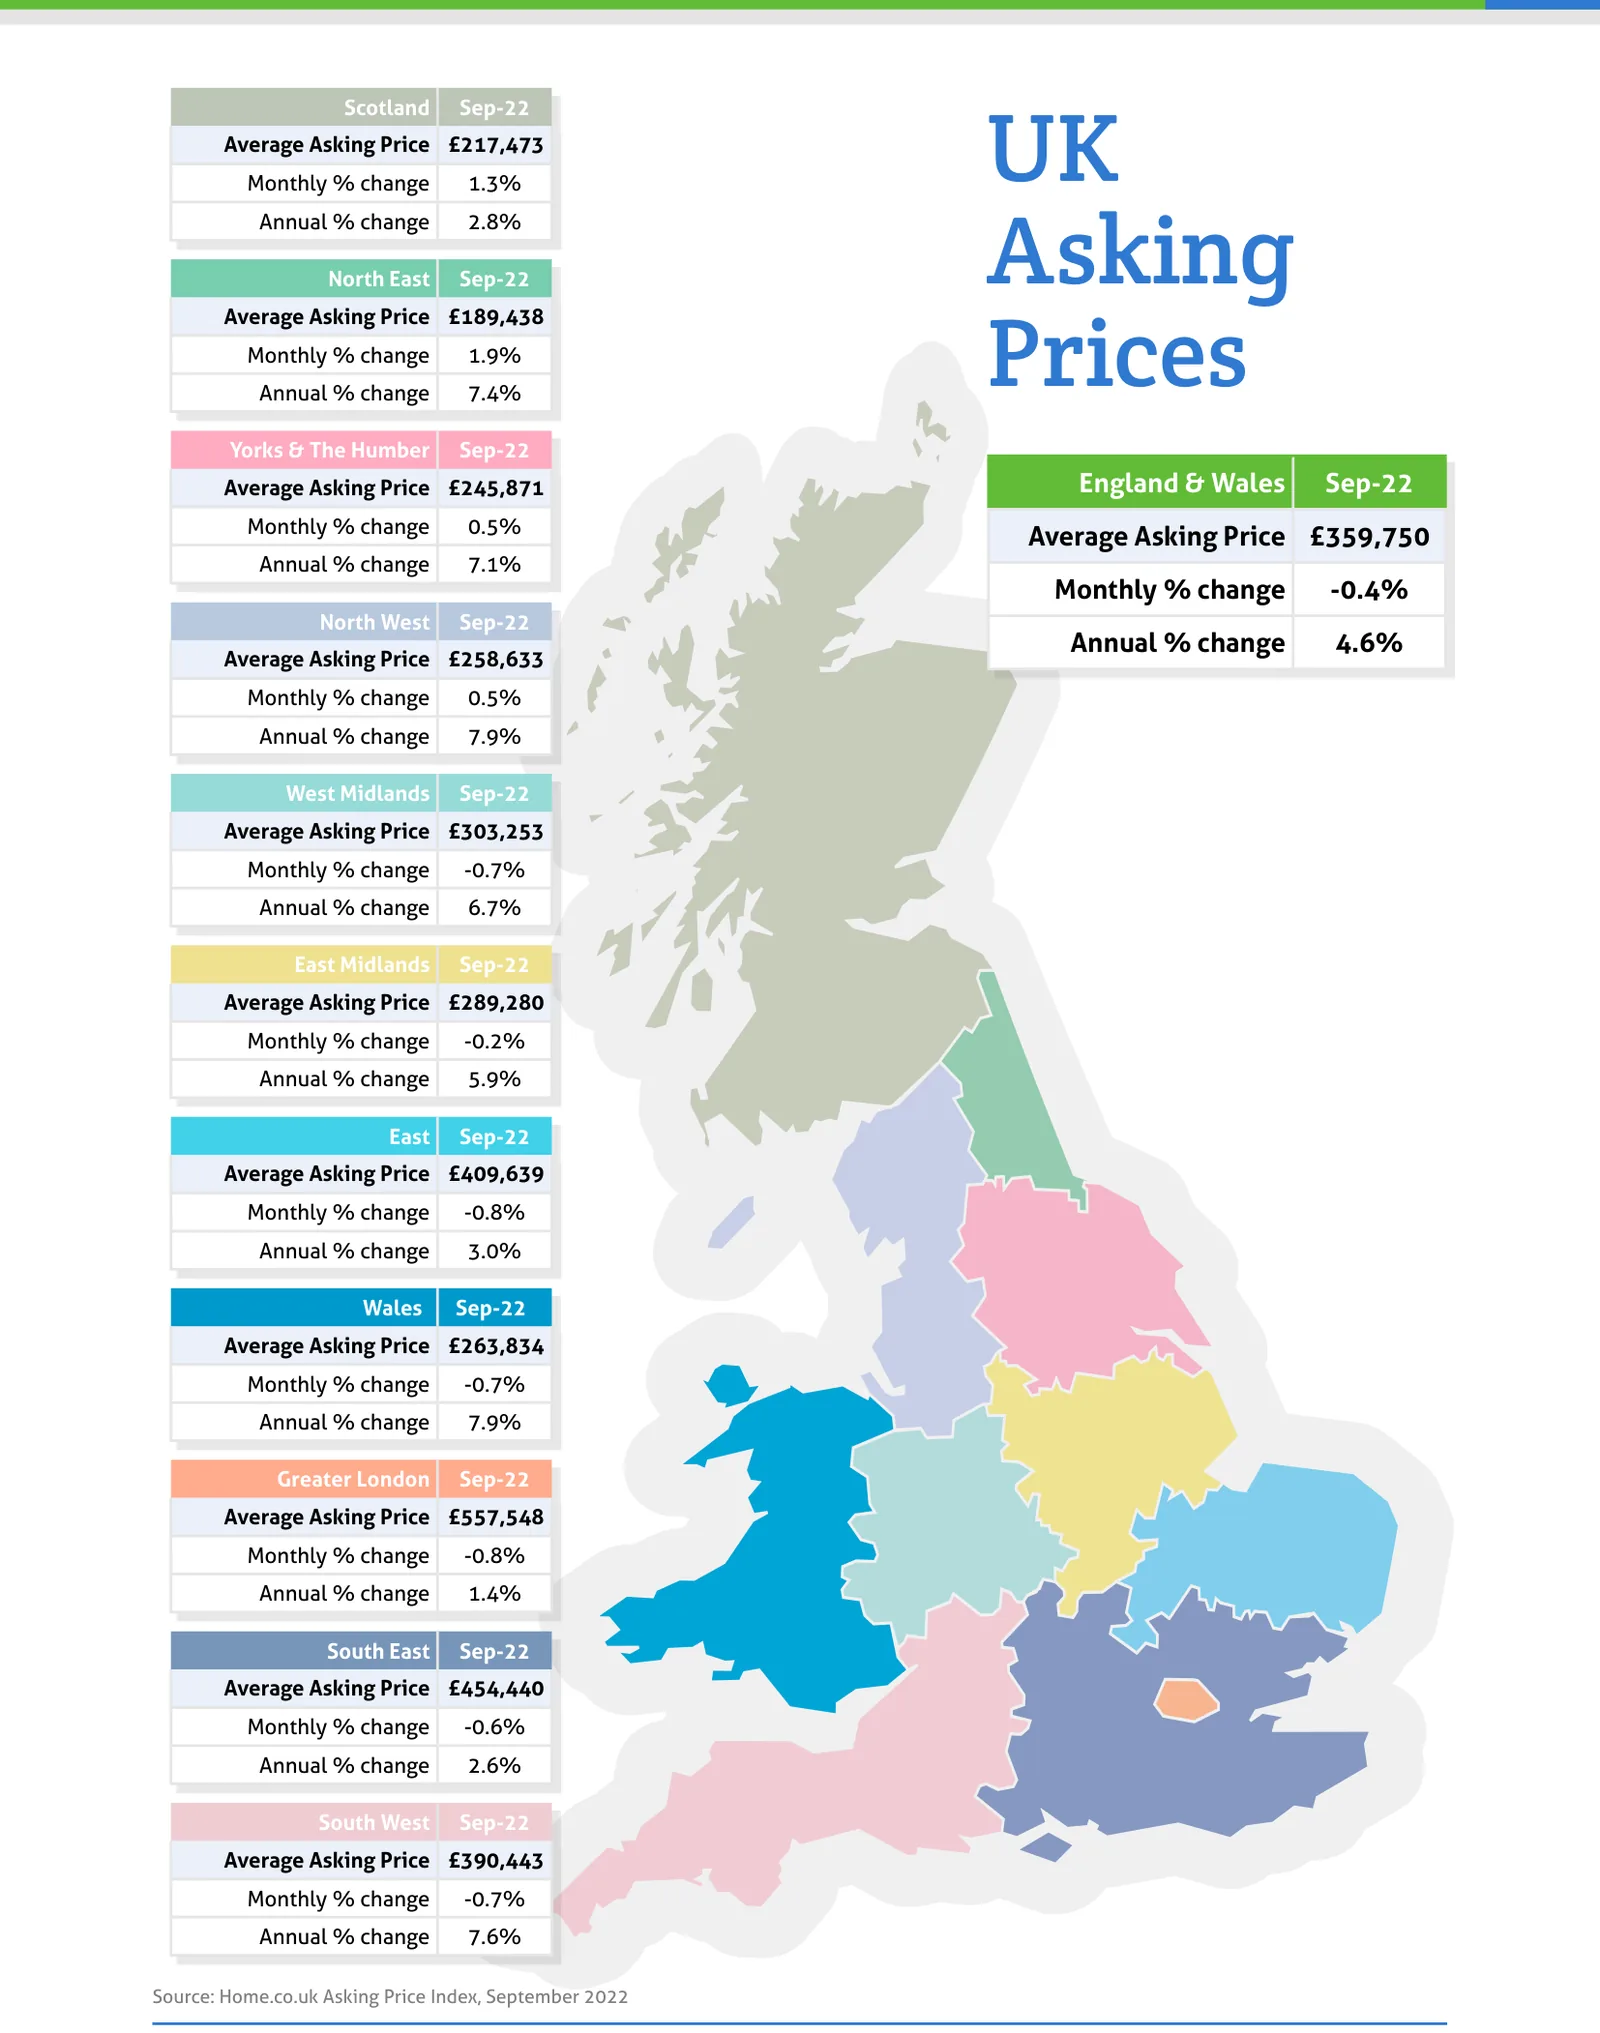
- The North West and Welsh property markets now lead in annualised regional price growth (both +7.9%), ahead of the previous leader, the South West (+7.6%).
- Meanwhile, monetary inflation increased further to 14.4% (RPI ex. housing), making current real growth around -10% year-on-year and, perhaps more importantly, the real mortgage interest rate around -11%.
- Spectacular hikes in Greater London rents continue. Demand is completely overwhelming supply of available properties, driving annualised rental growth to a shocking 29.2%.
- Central London rents have risen by far the fastest over the last twelve months and continue to do so, led by Hackney (+48%), Lambeth (+44%) and Islington (+43%) boroughs.
- Asking rent growth across the UK currently stands at an astonishing 21.8% year-on-year as rents rise in every English region, Scotland and Wales.
Summary
The UK property market continues to show significant momentum. Frothy valuations are being dialled back as the post-lockdown buying frenzy fades away. Stock levels are recovering in all regions except London, where renewed demand is gobbling up properties faster than agents can put them on the market. Higher nominal mortgage rates appear not to be deterring buyers and this is understandable when, owing to inflation, real mortgage lending rates are highly negative. Of course, real home price growth is also negative by a growing margin.
The property drought is over and a greater sense of normalcy prevails. However, property continues to move through the market at an exceptional pace. The average time on the market for unsold property is now at the lowest it has been since the financial crisis of 2008 (144 days in England and Wales).
Moreover, the turnover rate for properties passing through the market has recovered vastly from the low set in January when stock levels hit a record low. This measure of the number of properties passing through the market per day, which may be regarded as the 'pulse of the market,' has nearly doubled since the January low of 1163 properties per day to the current rate of 2075. This latest measure is broadly approaching the longer-term average for the UK property market.
Key figures
| Measure | Figure |
|---|---|
| Monthly change in asking prices | -0.4% |
| Annual change in asking prices | 4.6% |
| Typical Time on Market | 65 days |
| Rise in new instructions | +17% |
| UK asking rent growth (year-on-year) | 21.8% |
| Average time on market for unsold property (England and Wales) | 144 days |
Figures are for England and Wales unless the report states otherwise, as published in the edition.
Charts from the report
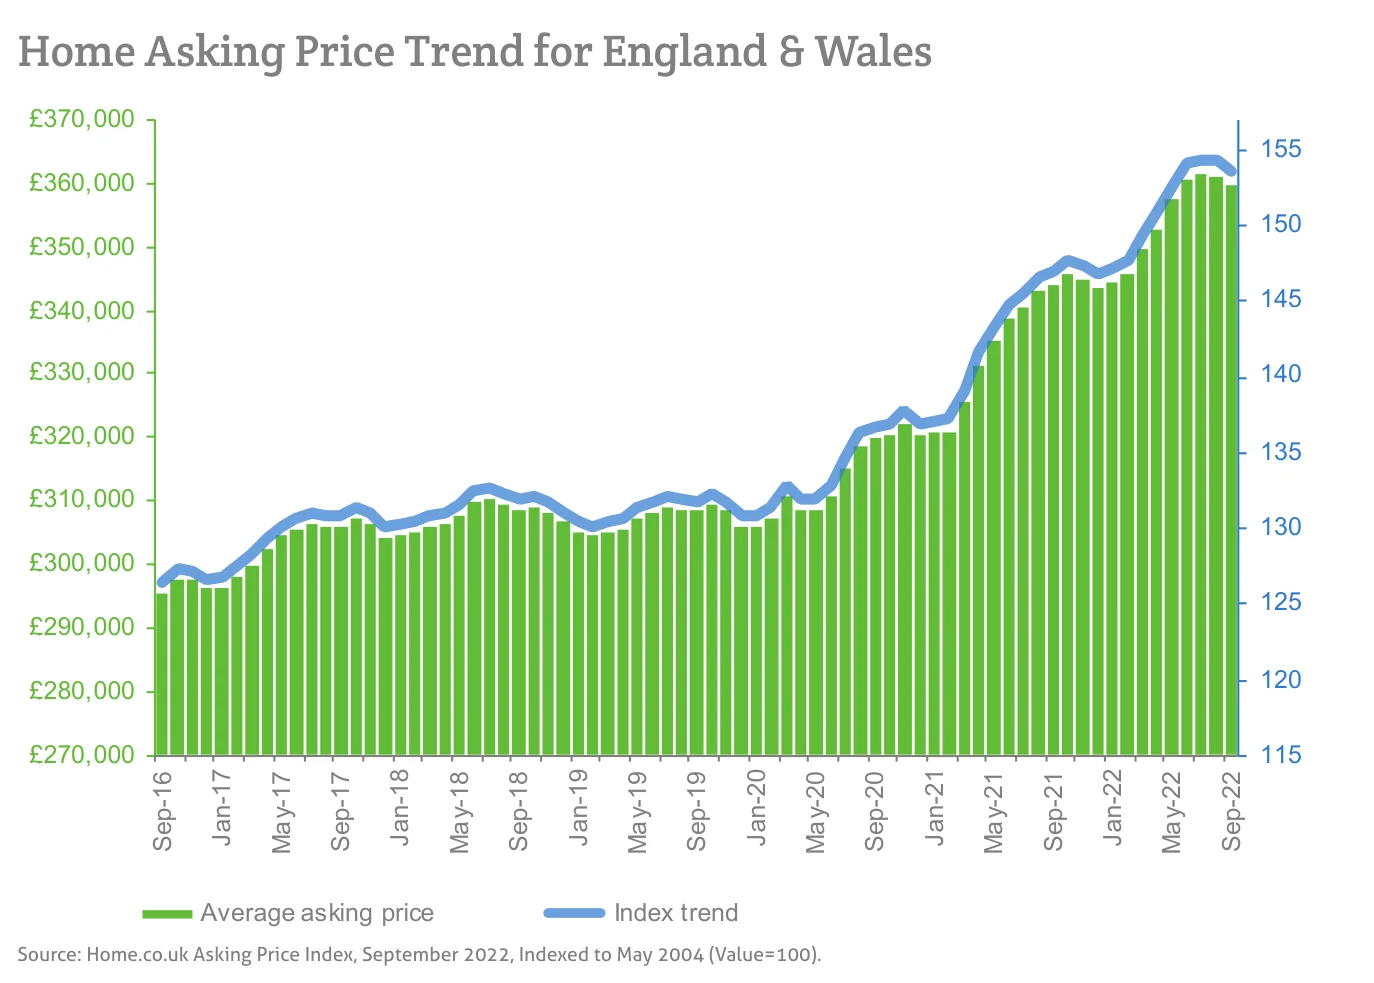
Source: Home.co.uk Asking Price Index, September 2022, Indexed to May 2004 (Value=100).
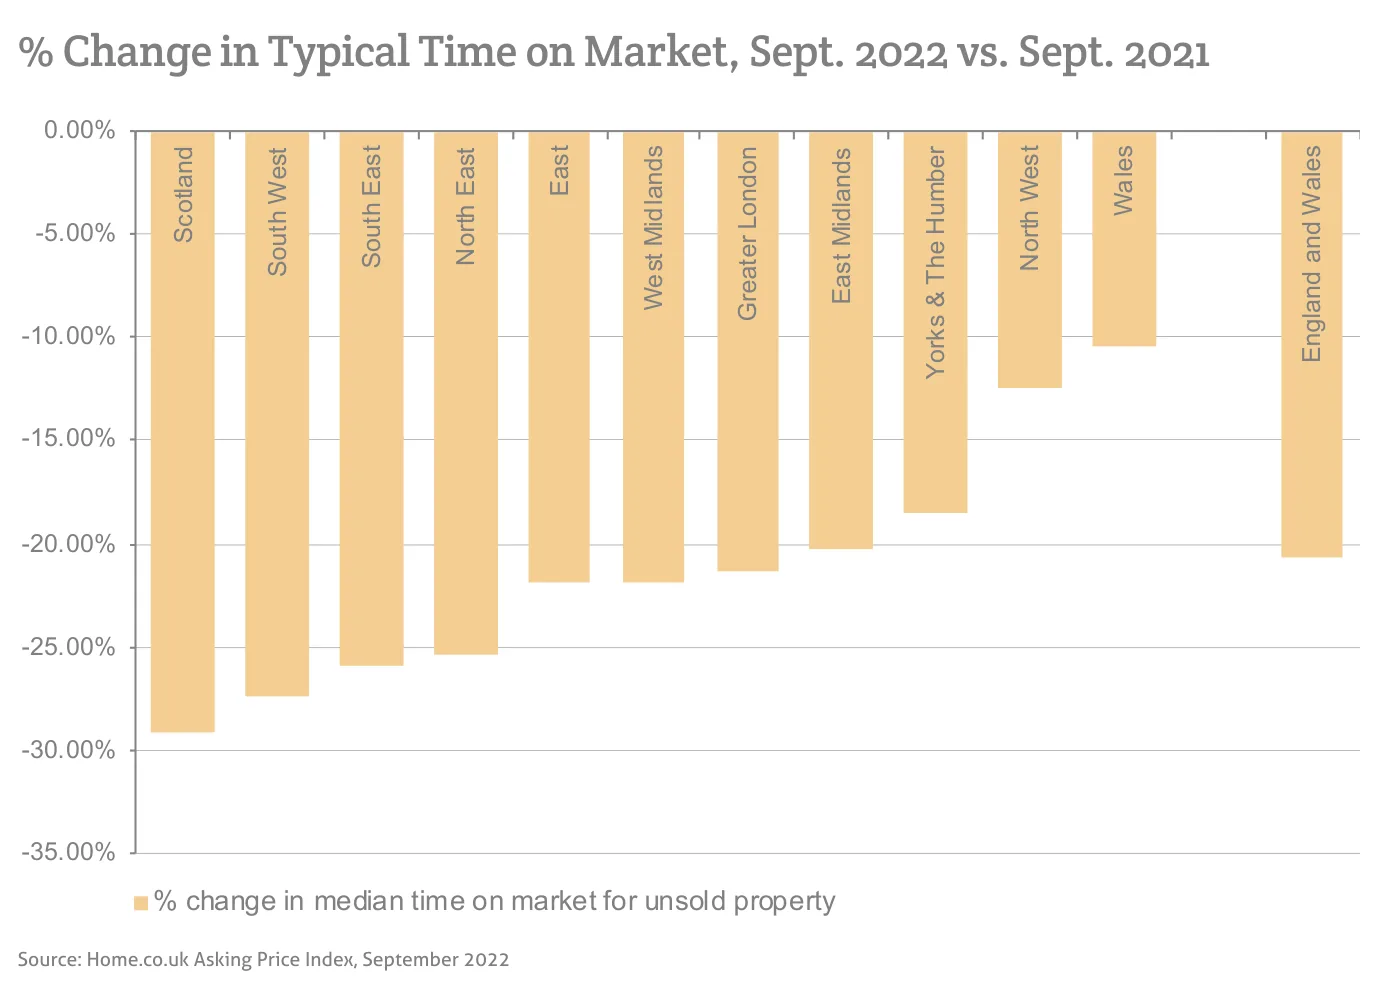
Source: Home.co.uk Asking Price Index, September 2022
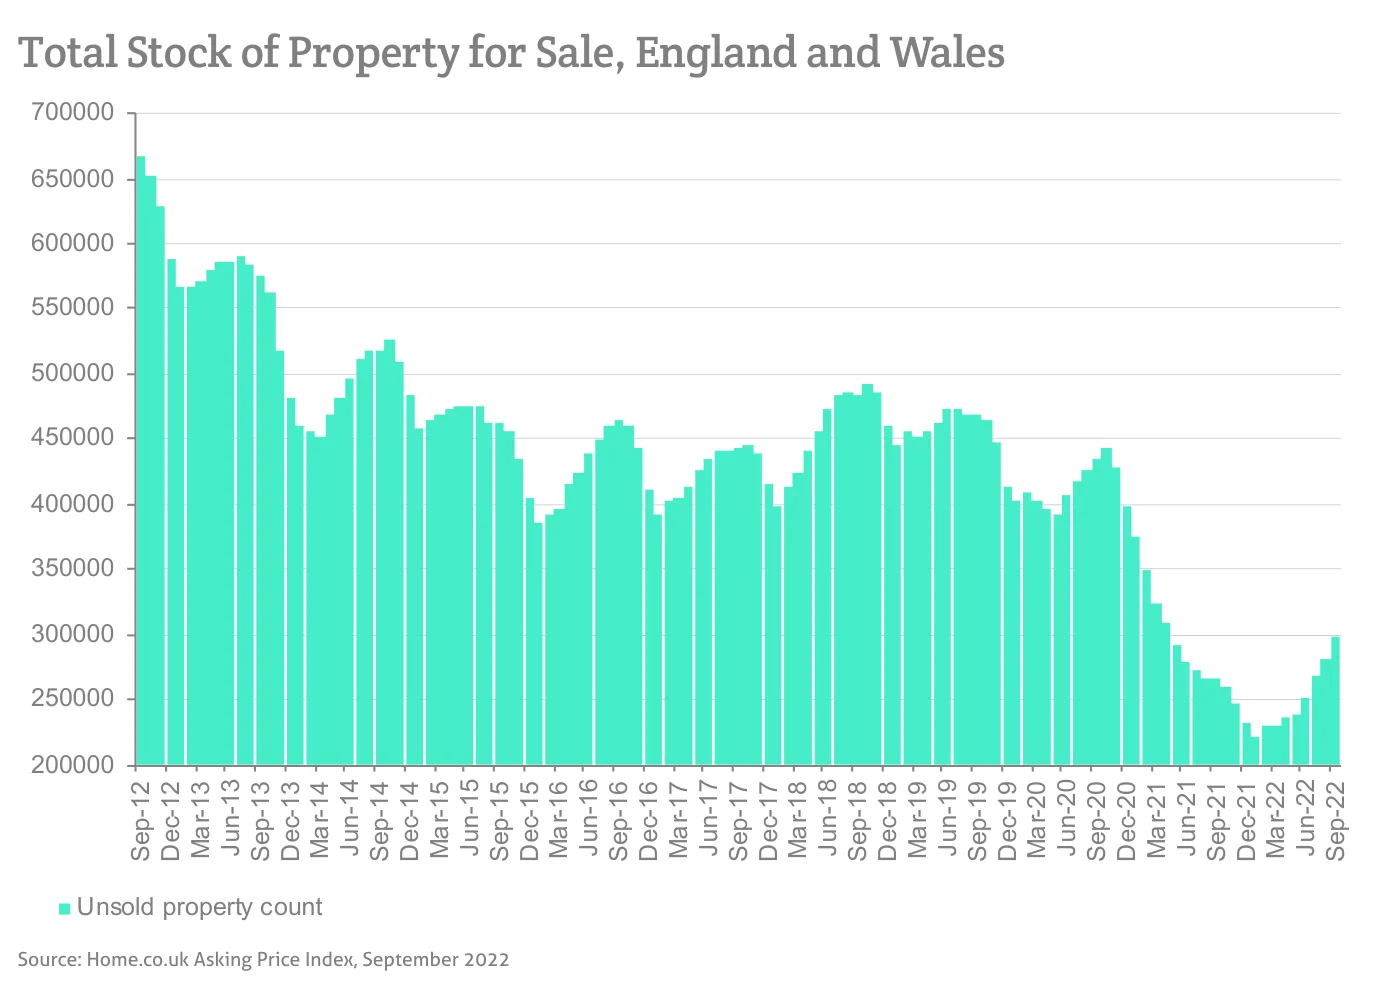
Source: Home.co.uk Asking Price Index, September 2022
Source: Home.co.uk Asking Price Index, September 2022
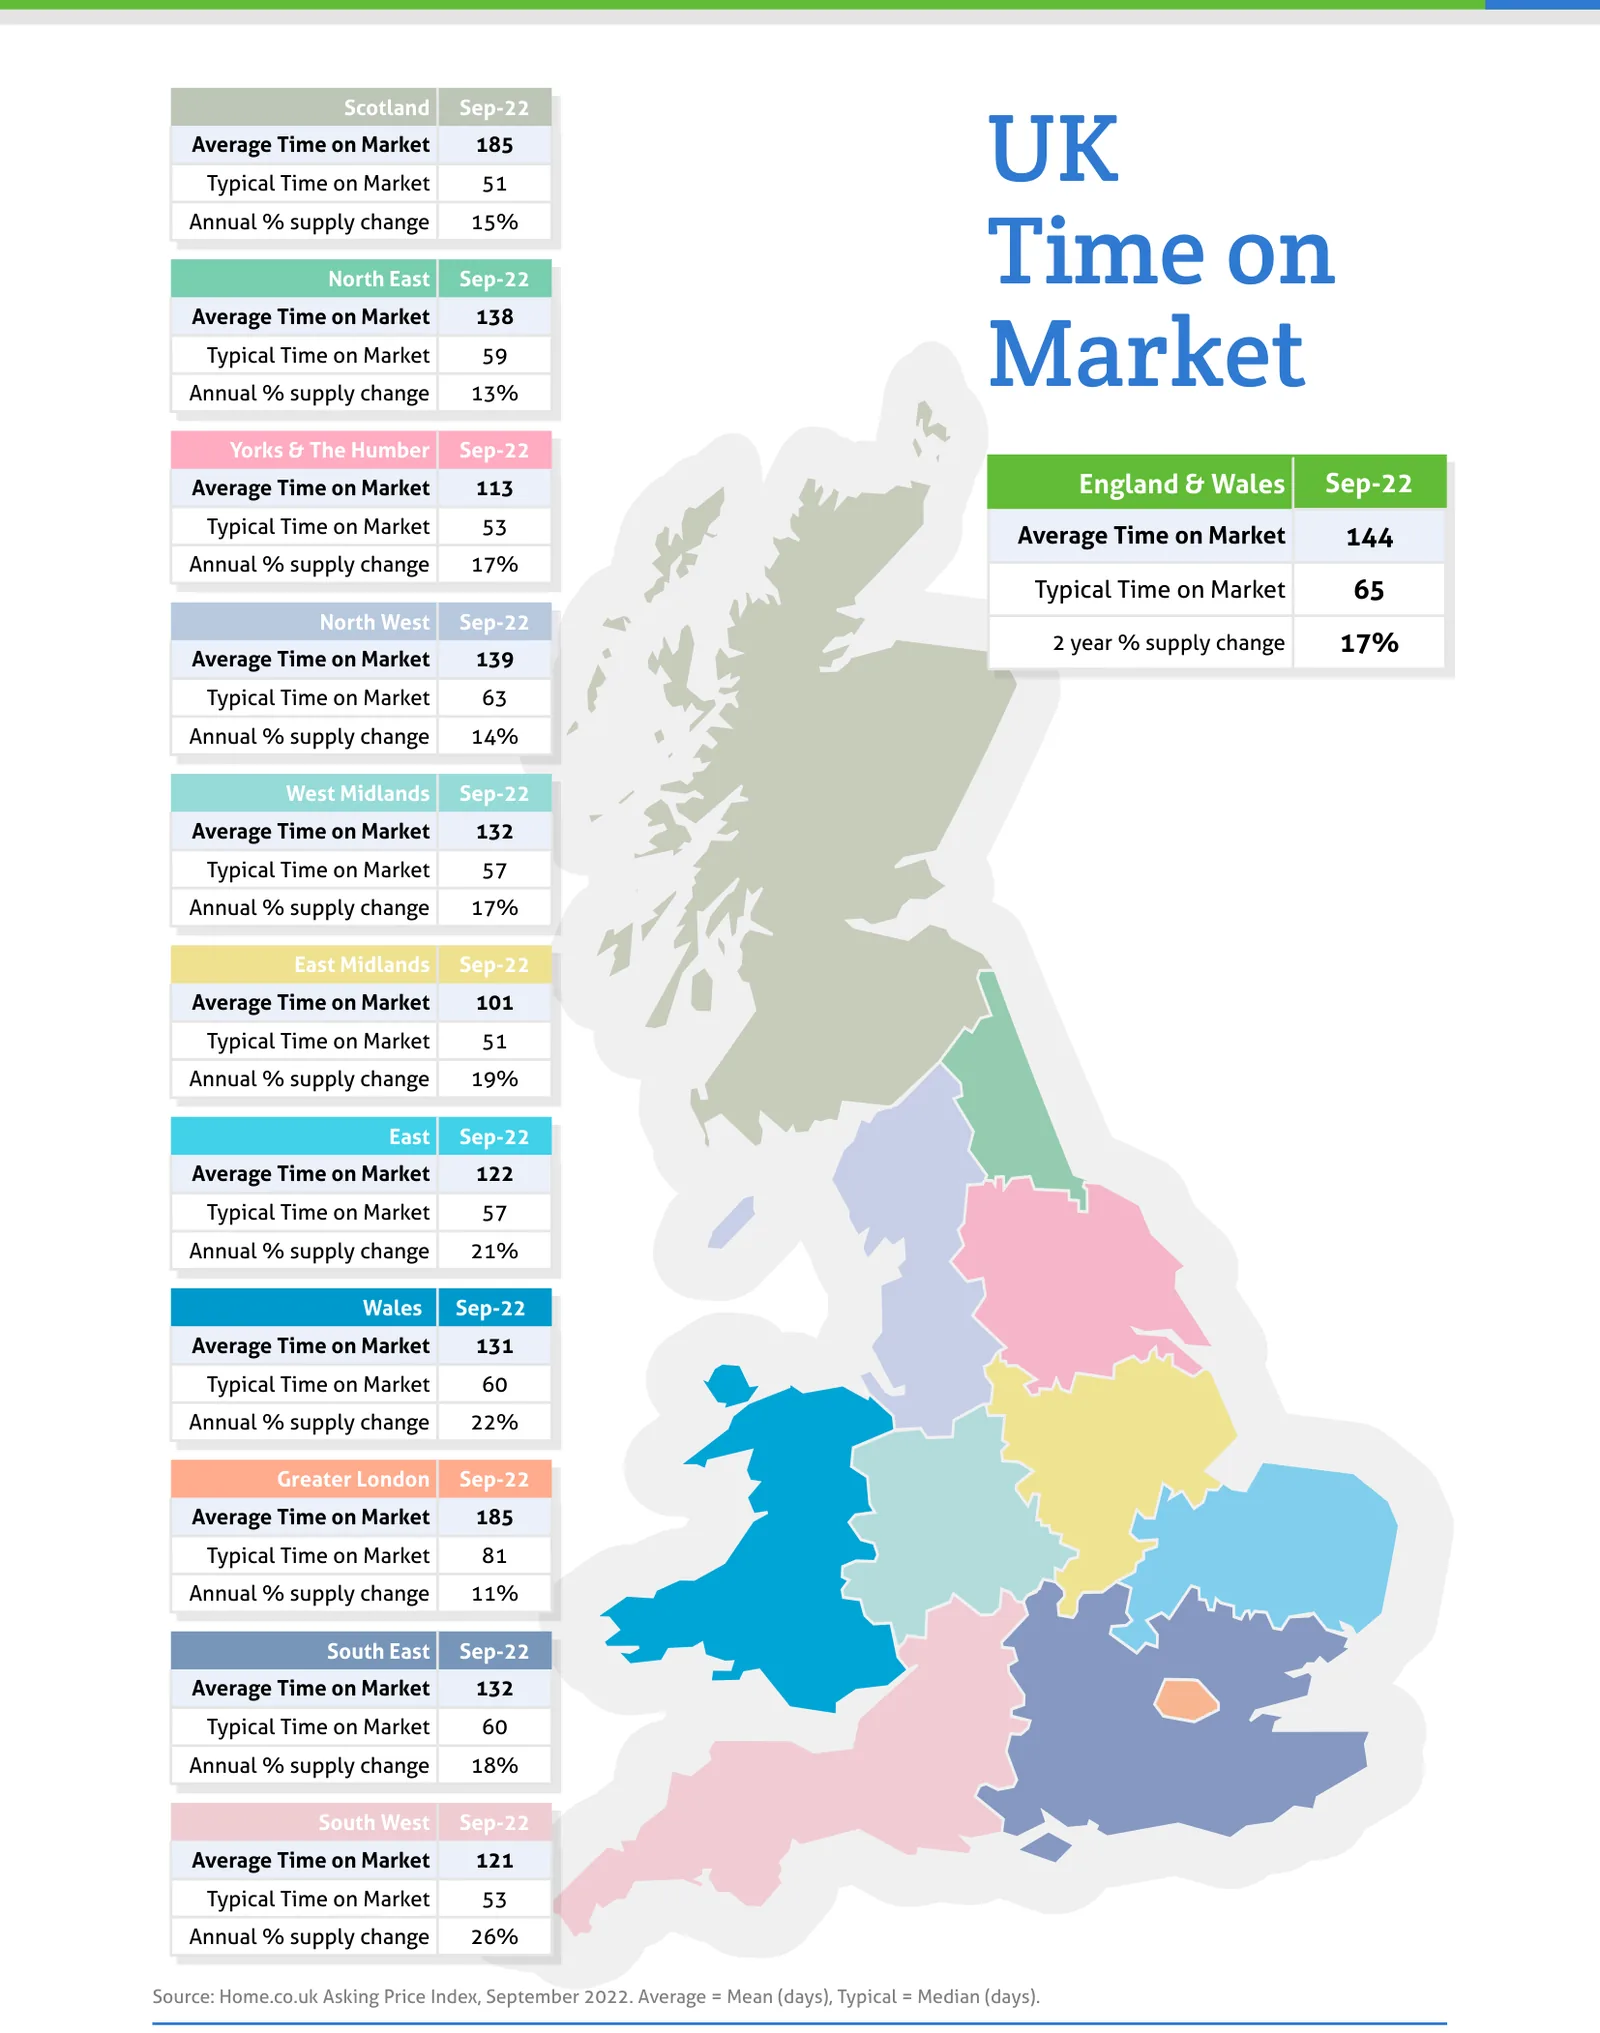
Source: Home.co.uk Asking Price Index, September 2022. Average = Mean (days), Typical = Median (days).
Regional tables
UK Asking Prices, Sep-22
| Region | Average Asking Price | Monthly % change | Annual % change |
|---|---|---|---|
| Scotland | £217,473 | 1.3% | 2.8% |
| North East | £189,438 | 1.9% | 7.4% |
| Yorks & The Humber | £245,871 | 0.5% | 7.1% |
| England & Wales | £359,750 | -0.4% | 4.6% |
| North West | £258,633 | 0.5% | 7.9% |
| West Midlands | £303,253 | -0.7% | 6.7% |
| East Midlands | £289,280 | -0.2% | 5.9% |
| East | £409,639 | -0.8% | 3.0% |
| Wales | £263,834 | -0.7% | 7.9% |
| Greater London | £557,548 | -0.8% | 1.4% |
| South East | £454,440 | -0.6% | 2.6% |
| South West | £390,443 | -0.7% | 7.6% |
UK Time on Market, Sep-22
| Region | Average Time on Market | Typical Time on Market | Annual % supply change |
|---|---|---|---|
| Scotland | 185 | 51 | 15% |
| North East | 138 | 59 | 13% |
| Yorks & The Humber | 113 | 53 | 17% |
| England & Wales | 144 | 65 | |
| North West | 139 | 63 | 14% |
| West Midlands | 132 | 57 | 17% |
| East Midlands | 101 | 51 | 19% |
| East | 122 | 57 | 21% |
| Wales | 131 | 60 | 22% |
| Greater London | 185 | 81 | 11% |
| South East | 132 | 60 | 18% |
| South West | 121 | 53 | 26% |
The report also prints '2 year % supply change' in 1 of its 12 region boxes (England & Wales 17%), so it is not a column of this table.
From the director's commentary
"However, the good news is, as I stated last month, UK property can weather this storm. Rental yields are considerably higher than borrowing costs and this fundamentally underpins the value of property."
Doug Shephard, Director at Home.co.uk
Read the full September 2022 edition (PDF, 9 pages)
About the Home Asking Price Index
The Home Asking Price Index measures the change in the prices sellers ask for residential property across England, Wales and Scotland. Today it is computed every month from around half a million advertised homes and is mix-adjusted, so a change in what happens to be on the market does not move the figure; earlier editions state the sample they were built from. Because an asking price is set months before a sale completes, the index runs around five months ahead of completed-sale measures such as the UK House Price Index.
Every edition in the archive, back to October 2006, is listed on the index page. How we measure the UK property market explains the listing data behind it, and today's figures by area are on house prices and rental prices.
Text and figures above are quoted from the September 2022 edition as published, with punctuation normalised for the web, and are not revised. Later editions may restate them.
More in What is happening to house prices: the Home guide
Thinking about your next move?
See what your home's worth in seconds, with the UK's longest-running property data behind it.
Get an instant valuation