

























Home Asking Price Index, September 2021: record low stock and easy lending support prices as market slows
England and Wales property stock hit a record low of 265,774 while asking prices rose 0.2% in September 2021, slowing annual growth to 7.4%.

This is the September 2021 edition of the Home Asking Price Index, released on 15 September 2021, under the headline:
Record Low Stock and Easy Lending Support Prices as Market Slows
The headlines and summary below are the report's own words, with the key figures as it published them, followed by the report's charts and regional tables as printed.
Headlines
- The total stock of property for sale in England and Wales has been eroded further to a new record low of 265,774, 38.8% lower than in September 2020 and 45.0% less than in September 2018.
- Monthly supply of new instructions continues to weigh in below expectations across the UK (-40% compared to August 2020). The South East is worst hit (-49%) while Greater London, formerly plagued by vast oversupply, indicates a further drop in the number of new instructions (down 48% compared to August 2020).
- Thanks to lower supply, asking prices across England and Wales nudged up again despite the looming end of the stamp duty tax break, adding another 0.2% since last month, although the annualised average growth slipped a little to 7.4%.
- Whilst relatively low, Typical Time on Market for unsold property in England and Wales has risen slightly by five days since last month to 82 days, in line with seasonal expectations.
- Low supply and considerable residual demand continue to push up prices in most English regions (except the North East, West Midlands and Yorkshire) and in Scotland. Welsh prices showed their first monthly fall since December. The largest monthly rises are in the East of England (+1.1) and the East Midlands (+1.0%).
- The East of England property market continues to head up the 12-month regional price growth chart with a stunning gain of 12.1%, followed closely by the East Midlands (+10.1%).
- Greater London remains the UK's worst-performing region with 3.9% annualised growth although the trend is now upward. There are clear signals that the capital's sales market may soon catch up and overtake Yorkshire and the North East as demand returns and supply is much reduced.
- The sales market is now supported by rising rents in the Greater London lettings market. Annualised growth in asking rents has now firmly moved into positive territory following the COVID exodus (+6.9%). The greatest rises in asking rents over the last twelve months are in the City (+23.2%), Kensington and Chelsea (+22.4%) and Wandsworth (+18.9%), confirming the continued return to city living.
- Scarcity of rental properties persists in all English regions, Scotland and Wales, further supporting record rents outside of London. Rents are up 4.8% across the UK since September 2020.
- The largest annualised average rent hikes remain in the South West of England (+10.0%) and the West Midlands (+11.1%).
Summary
Across the UK, scarcity continues to push up both prices and rents. The number of new instructions entering the sales market continues to be very low compared to pre-COVID levels (down 16% August 2021 vs. August 2019). The number of newly available rental properties entering the market is also down considerably across the UK (down 35% August 2021 vs. August 2020).
The current state of the property market is a direct result of overall low supply of both rental and sales instructions. Moreover, London now shows a return to strength with rising demand and reduced availability of both rental and sales stock. Scarcity is driving up rents across the UK and supply is continuing to fall rapidly. The total stock of property for sale indicates a record low in the history of this index and the trend suggests that it may not fall much further. Meanwhile, the supply rate of new sales listings remains consistently low across all English regions, Scotland and Wales, more than compensating for any reduction in demand owing to the end of the stamp duty holiday.
Key figures
| Measure | Figure |
|---|---|
| Total stock for sale | 265,774 |
| Annual change in stock | -38.8% |
| Monthly change in new instructions (UK) | -40% |
| Monthly asking price change | +0.2% |
| Annual asking price growth | +7.4% |
| Typical Time on Market | 82 days |
| Annual rent growth (UK) | +4.8% |
| New instructions vs pre-COVID (UK) | -16% |
Figures are for England and Wales unless the report states otherwise, as published in the edition.
Charts from the report
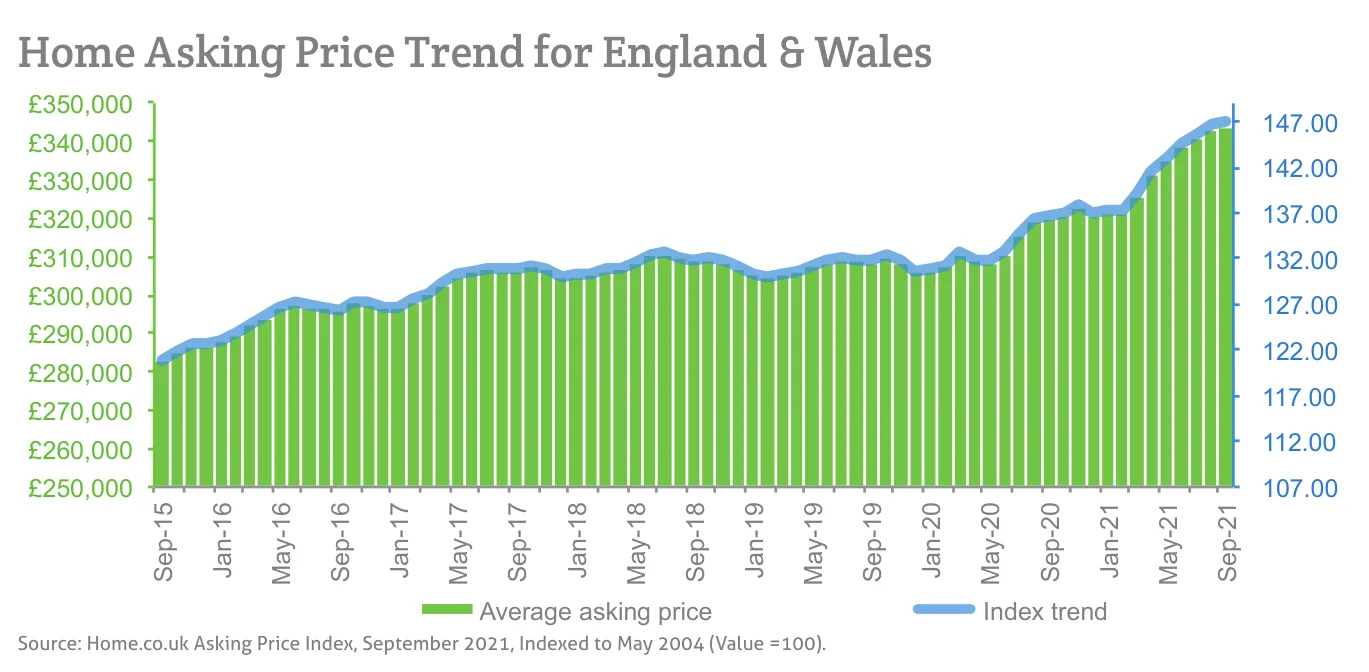
Source: Home.co.uk Asking Price Index, September 2021, Indexed to May 2004 (Value =100).
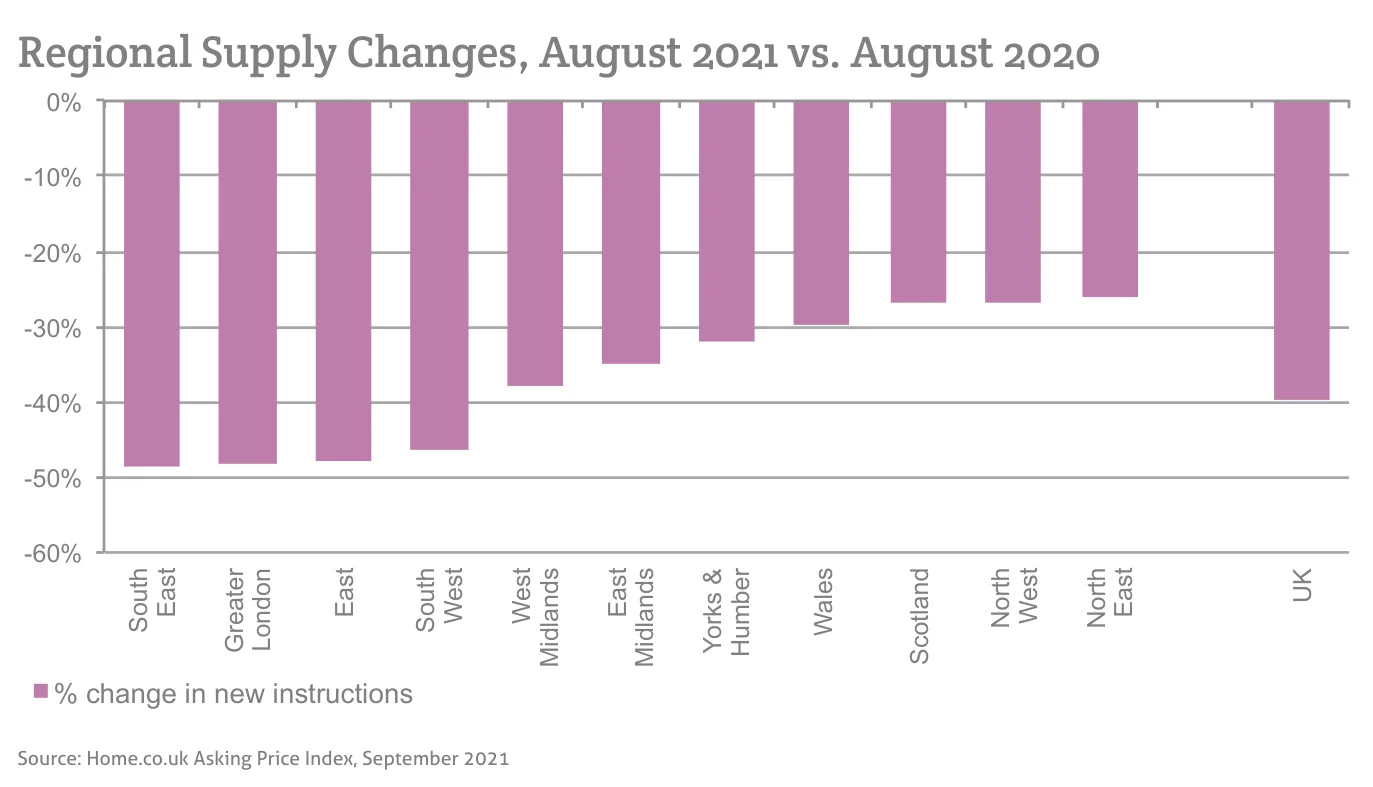
Source: Home.co.uk Asking Price Index, September 2021
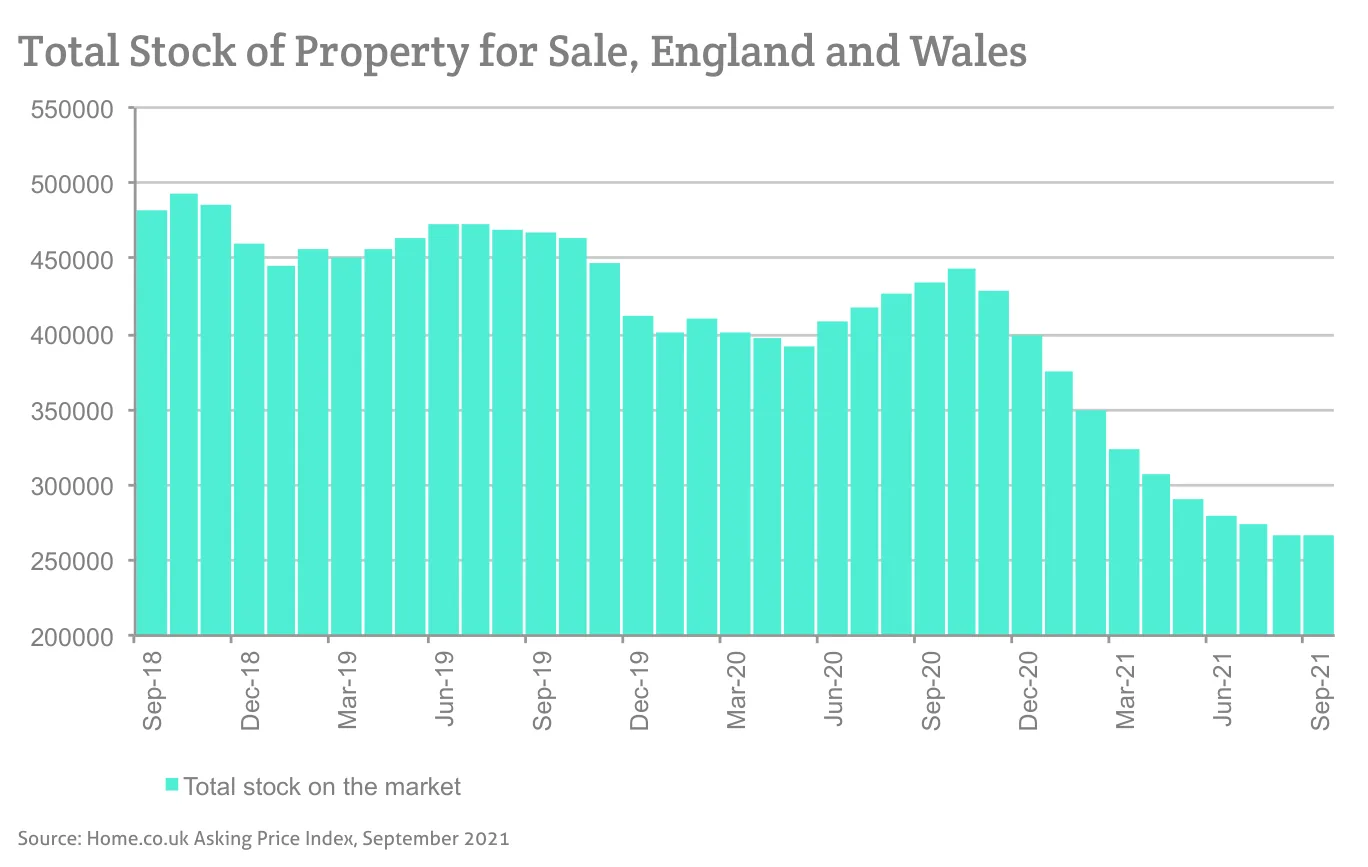
Source: Home.co.uk Asking Price Index, September 2021
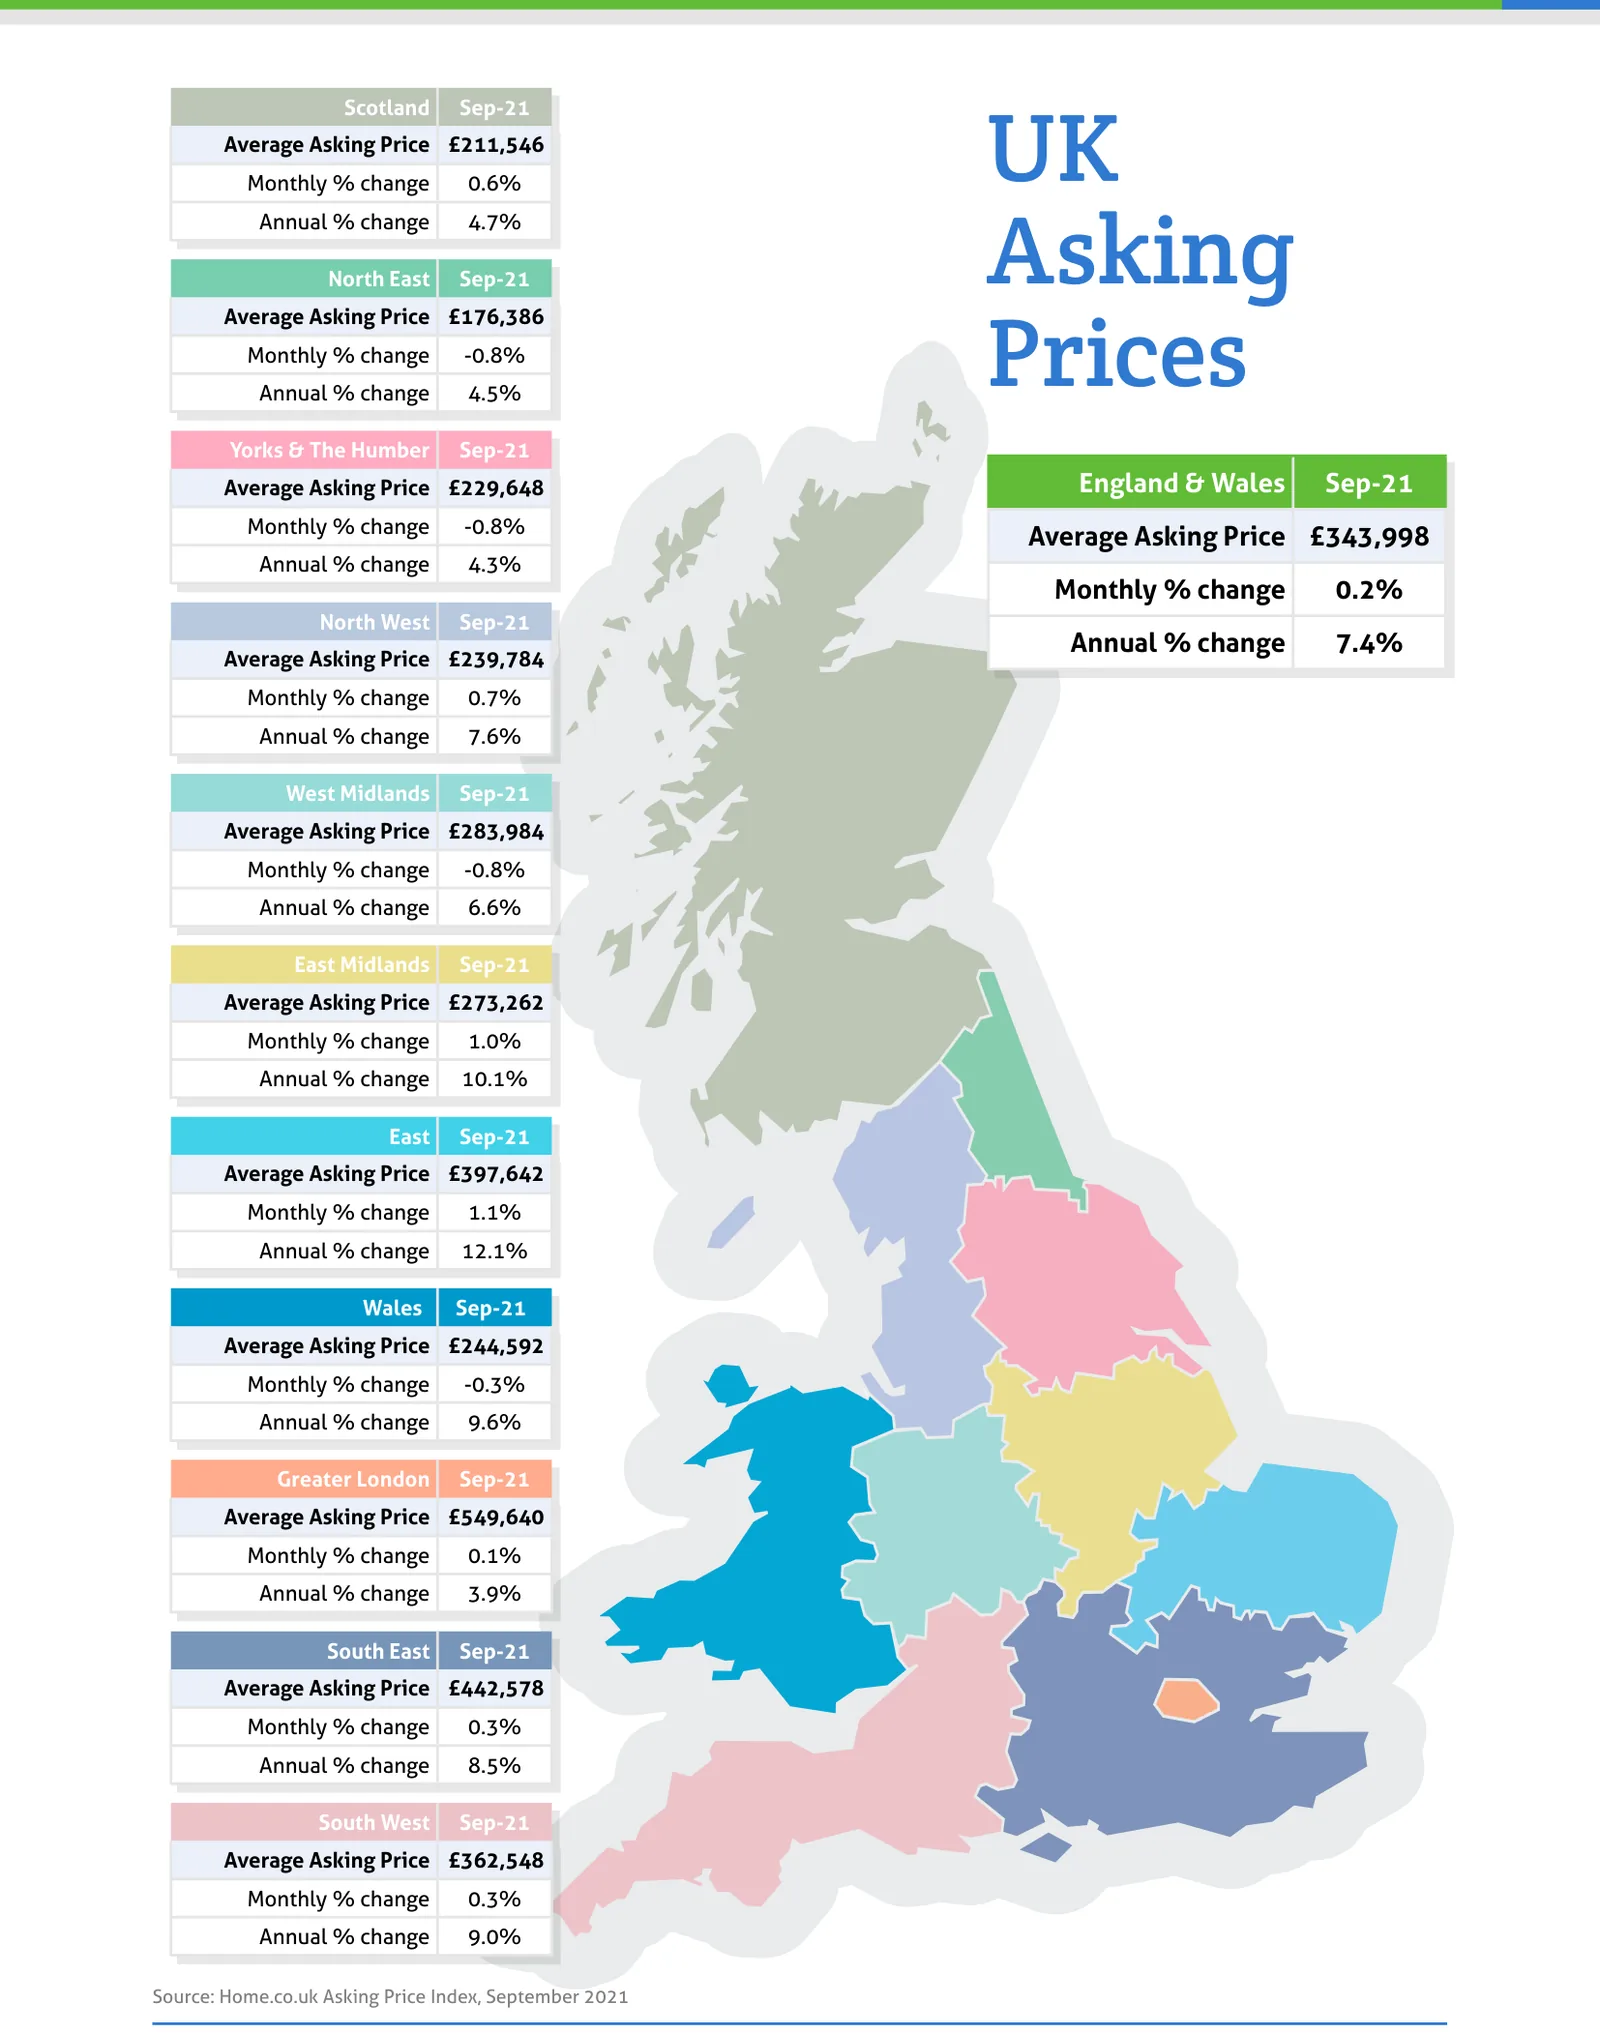
Source: Home.co.uk Asking Price Index, September 2021
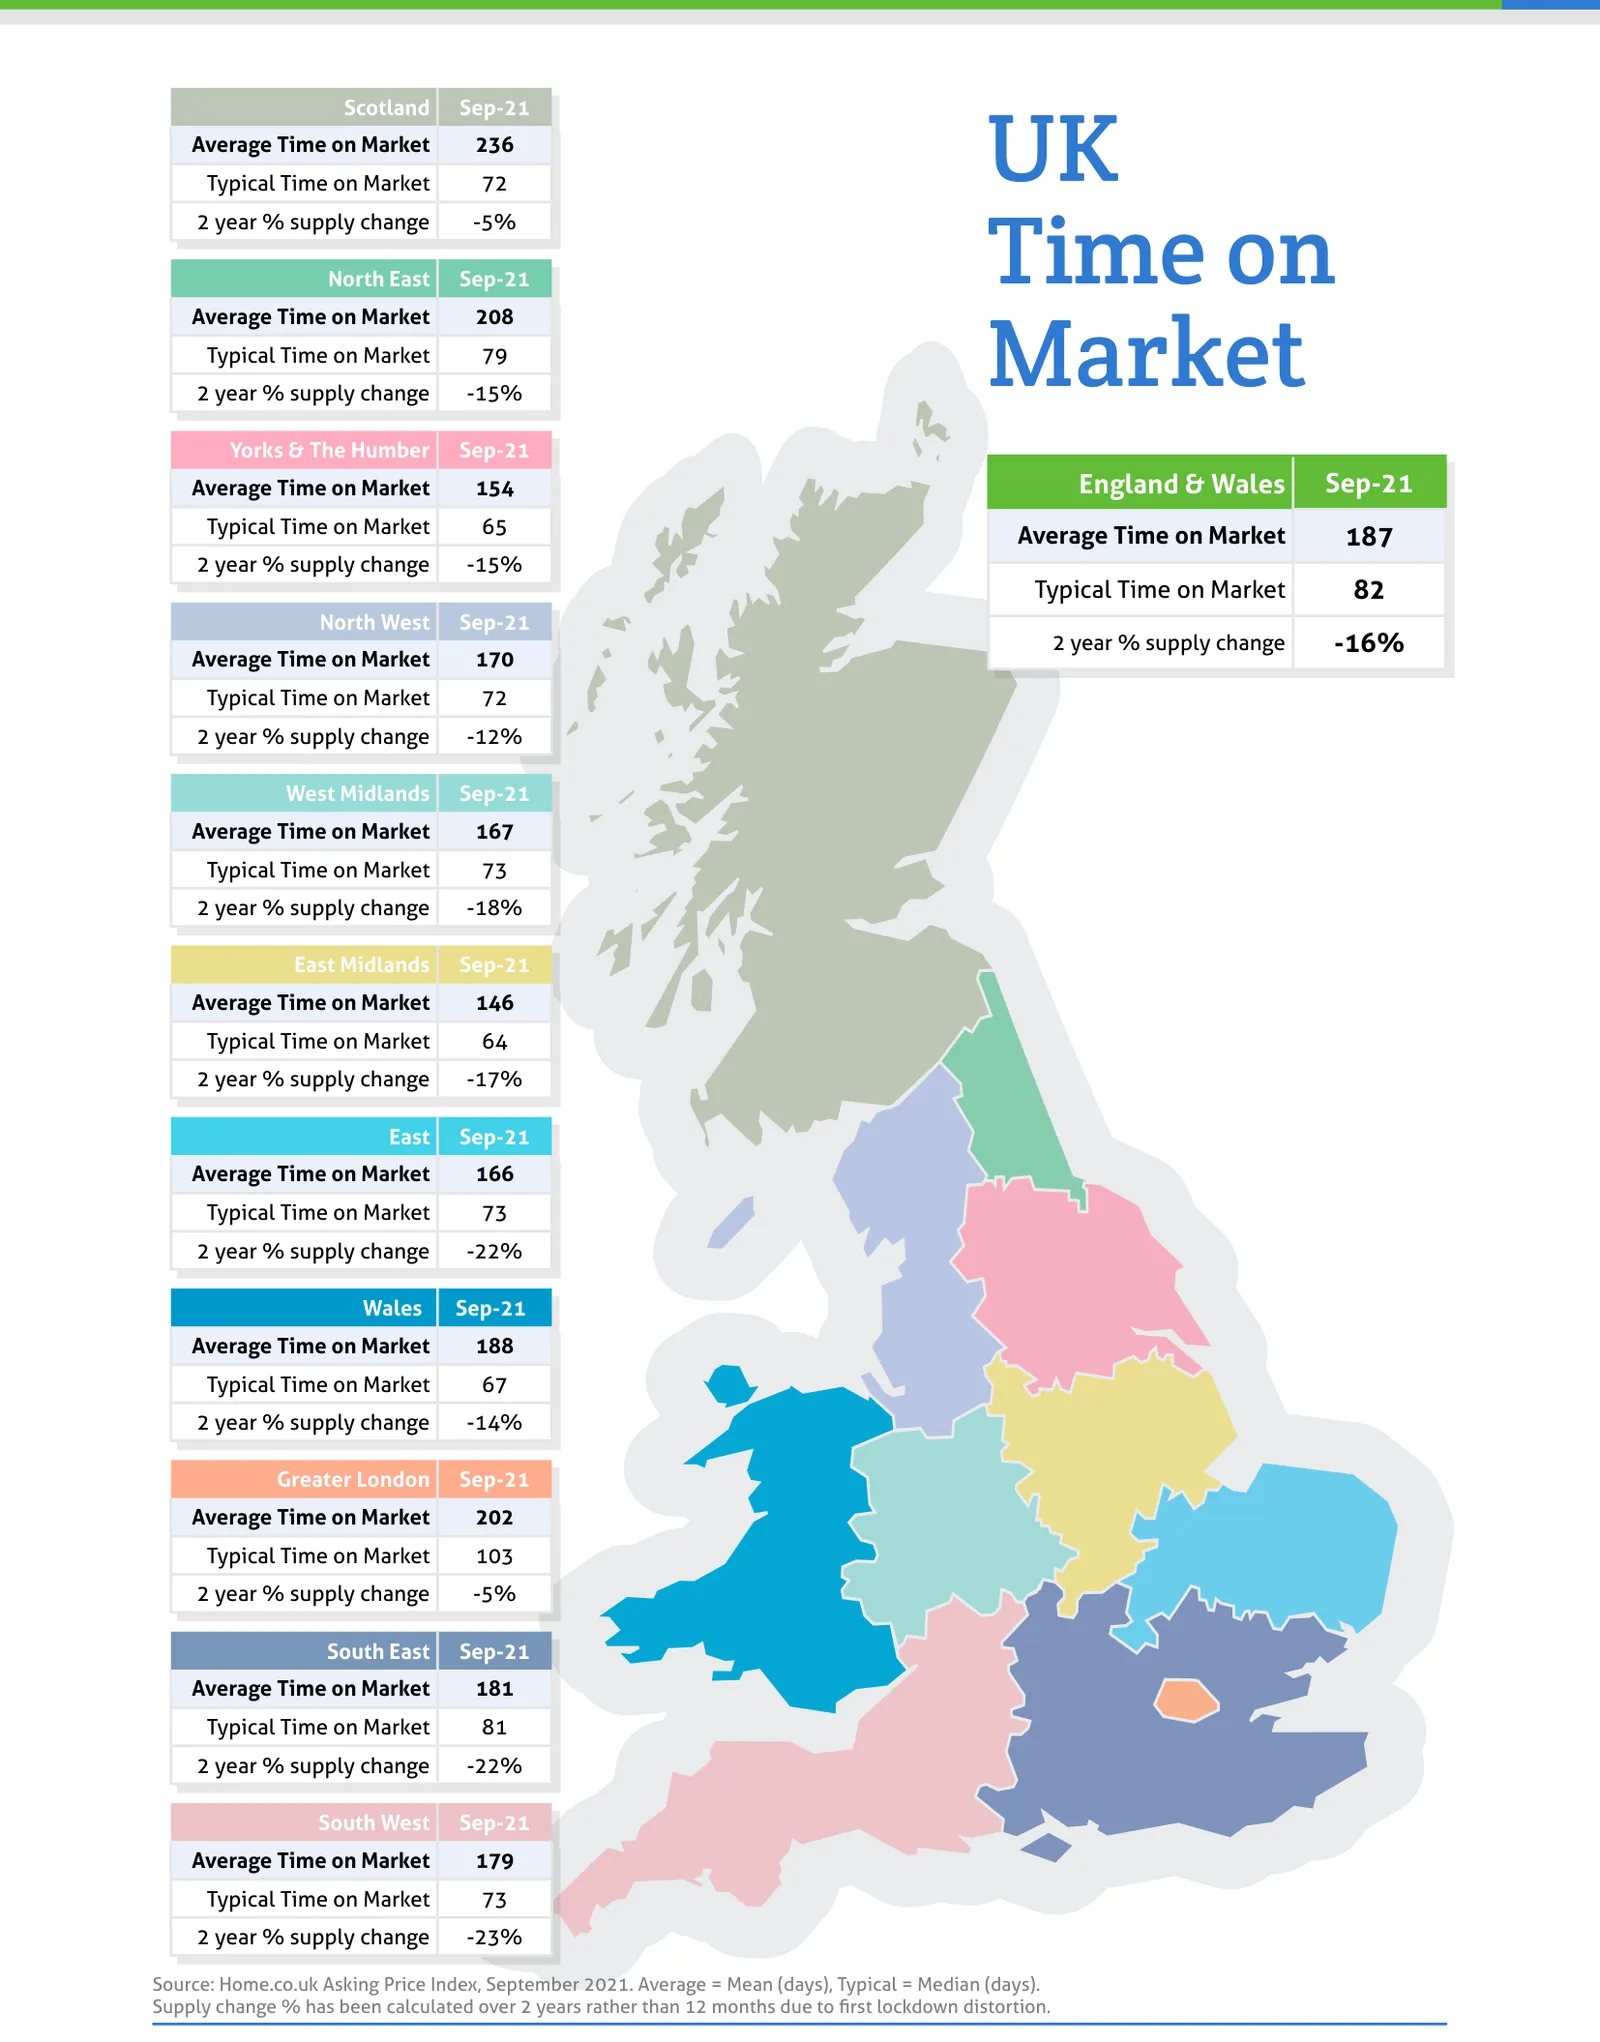
Source: Home.co.uk Asking Price Index, September 2021. Average = Mean (days), Typical = Median (days).
Regional tables
UK Asking Prices, Sep-21
| Region | Average Asking Price | Monthly % change | Annual % change |
|---|---|---|---|
| Scotland | £211,546 | 0.6% | 4.7% |
| North East | £176,386 | -0.8% | 4.5% |
| Yorks & The Humber | £229,648 | -0.8% | 4.3% |
| England & Wales | £343,998 | 0.2% | 7.4% |
| North West | £239,784 | 0.7% | 7.6% |
| West Midlands | £283,984 | -0.8% | 6.6% |
| East Midlands | £273,262 | 1.0% | 10.1% |
| East | £397,642 | 1.1% | 12.1% |
| Wales | £244,592 | -0.3% | 9.6% |
| Greater London | £549,640 | 0.1% | 3.9% |
| South East | £442,578 | 0.3% | 8.5% |
| South West | £362,548 | 0.3% | 9.0% |
UK Time on Market, Sep-21
| Region | Average Time on Market | Typical Time on Market | 2 year % supply change |
|---|---|---|---|
| Scotland | 236 | 72 | -5% |
| North East | 208 | 79 | -15% |
| Yorks & The Humber | 154 | 65 | -15% |
| England & Wales | 187 | 82 | -16% |
| North West | 170 | 72 | -12% |
| West Midlands | 167 | 73 | -18% |
| East Midlands | 146 | 64 | -17% |
| East | 166 | 73 | -22% |
| Wales | 188 | 67 | -14% |
| Greater London | 202 | 103 | -5% |
| South East | 181 | 81 | -22% |
| South West | 179 | 73 | -23% |
From the director's commentary
"What a wild ride it has been for property this year. From a macroeconomic standpoint, lack of supply coupled with artificially stoked demand led to alarming price hikes with several regions topping 10% growth, whilst at the same time the wider economy was brought to its knees by the pandemic."
Doug Shephard, Director at Home.co.uk
Read the full September 2021 edition (PDF, 7 pages)
About the Home Asking Price Index
The Home Asking Price Index measures the change in the prices sellers ask for residential property across England, Wales and Scotland. Today it is computed every month from around half a million advertised homes and is mix-adjusted, so a change in what happens to be on the market does not move the figure; earlier editions state the sample they were built from. Because an asking price is set months before a sale completes, the index runs around five months ahead of completed-sale measures such as the UK House Price Index.
Every edition in the archive, back to October 2006, is listed on the index page. How we measure the UK property market explains the listing data behind it, and today's figures by area are on house prices and rental prices.
Text and figures above are quoted from the September 2021 edition as published, with punctuation normalised for the web, and are not revised. Later editions may restate them.
More in What is happening to house prices: the Home guide
Thinking about your next move?
See what your home's worth in seconds, with the UK's longest-running property data behind it.
Get an instant valuation