

























Home Asking Price Index, September 2020: prices up again but oversupply risks London correction
Asking prices in England and Wales rose 0.4% in August, taking annual growth to 3.8%, while oversupply threatens a correction in London.

This is the September 2020 edition of the Home Asking Price Index, released on 15 September 2020, under the headline:
Prices Up Again but Oversupply Risks London Correction
The headlines and summary below are the report's own words, with the key figures as it published them, followed by the report's charts and regional tables as printed.
Headlines
- Yet another strong month for asking prices as the market recovery continues.
- Mix-adjusted average asking price for England and Wales rises a further 0.4% since the August reading, bringing the year-on-year rise to 3.8%.
- Supply of new sales instructions exceeds normal levels for the mainland UK (up 25% in August compared to August 2019).
- Excessive supply in Greater London now threatens a market correction (new listings up 71% in August compared to August 2019).
- Despite surging supply, the current stock count for England and Wales remains lower than in September 2019 by 7.3%, as pent-up demand eats into the new listings.
- Scottish vendors continue to show exceptional confidence (second month out of a prolonged lockdown) with a further large hike in the average home price of 1.5% since last month, making the annualised growth 7.7%.
Summary
Prices remain robust but the current spate of new listings suggests that the road to full recovery may soon be marred by oversupply, especially in London. Estate agents had another phenomenally busy month in August, taking on even greater amounts of new instructions, especially in the capital region, East and South East of England. Fortunately, mortgage approvals have also bounced back to more normal levels and this will help digest the glut of new stock.
Of course, the market has been playing catch-up in the wake of the nationwide lockdown and large amounts of new instructions should be expected. While London's stock levels have been inflated by 37% since April, it should also be borne in mind that the sum total of new listings from March to August inclusive is around 10% less than the same period in 2019. However, greater reassurance for the capital's property market would be achieved by the attenuation of supply.
Key figures
| Measure | Figure |
|---|---|
| Mix-adjusted average asking price, monthly change | +0.4% |
| Mix-adjusted average asking price, annual change | +3.8% |
| New sales listings, annual change (mainland UK) | +25% |
| Stock count, annual change (England and Wales) | -7.3% |
| Properties reduced in price, annual change | -6.0% |
| Average price cut, annual change | +8.8% |
| Rental supply, annual change (UK) | -6.3% |
| New listings Mar-Aug, change vs 2019 | -10% |
Figures are for England and Wales unless the report states otherwise, as published in the edition.
Charts from the report
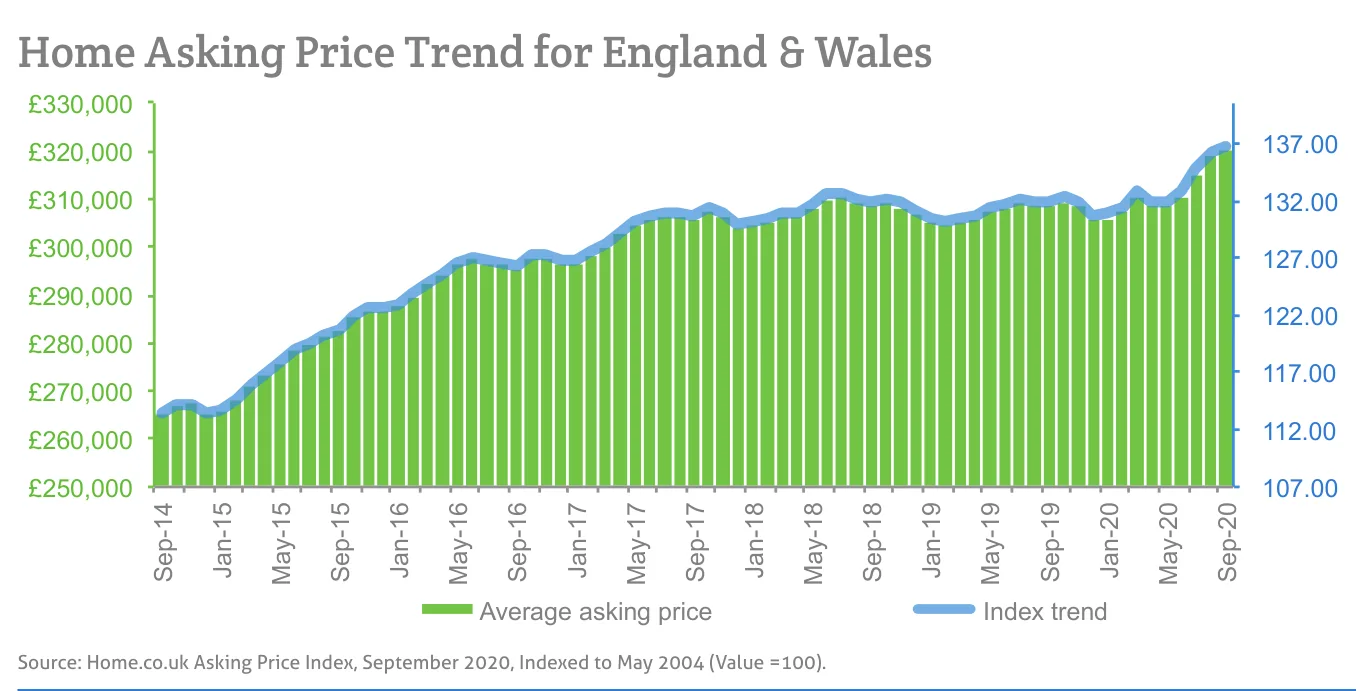
Source: Home.co.uk Asking Price Index, September 2020, Indexed to May 2004 (Value =100).
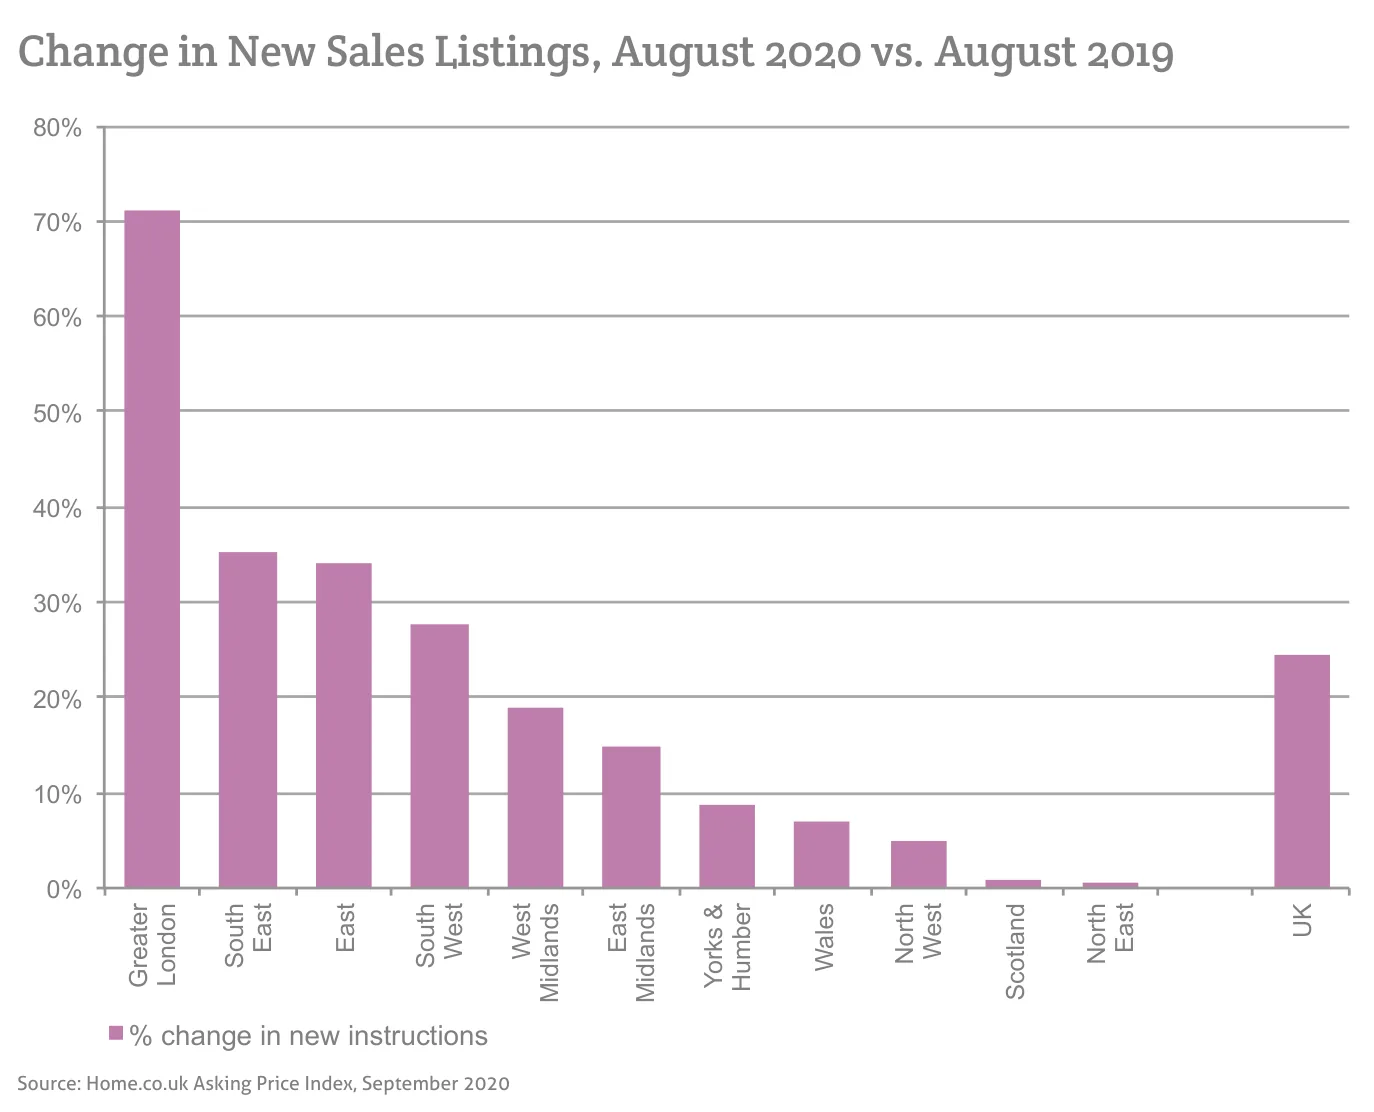
Source: Home.co.uk Asking Price Index, September 2020
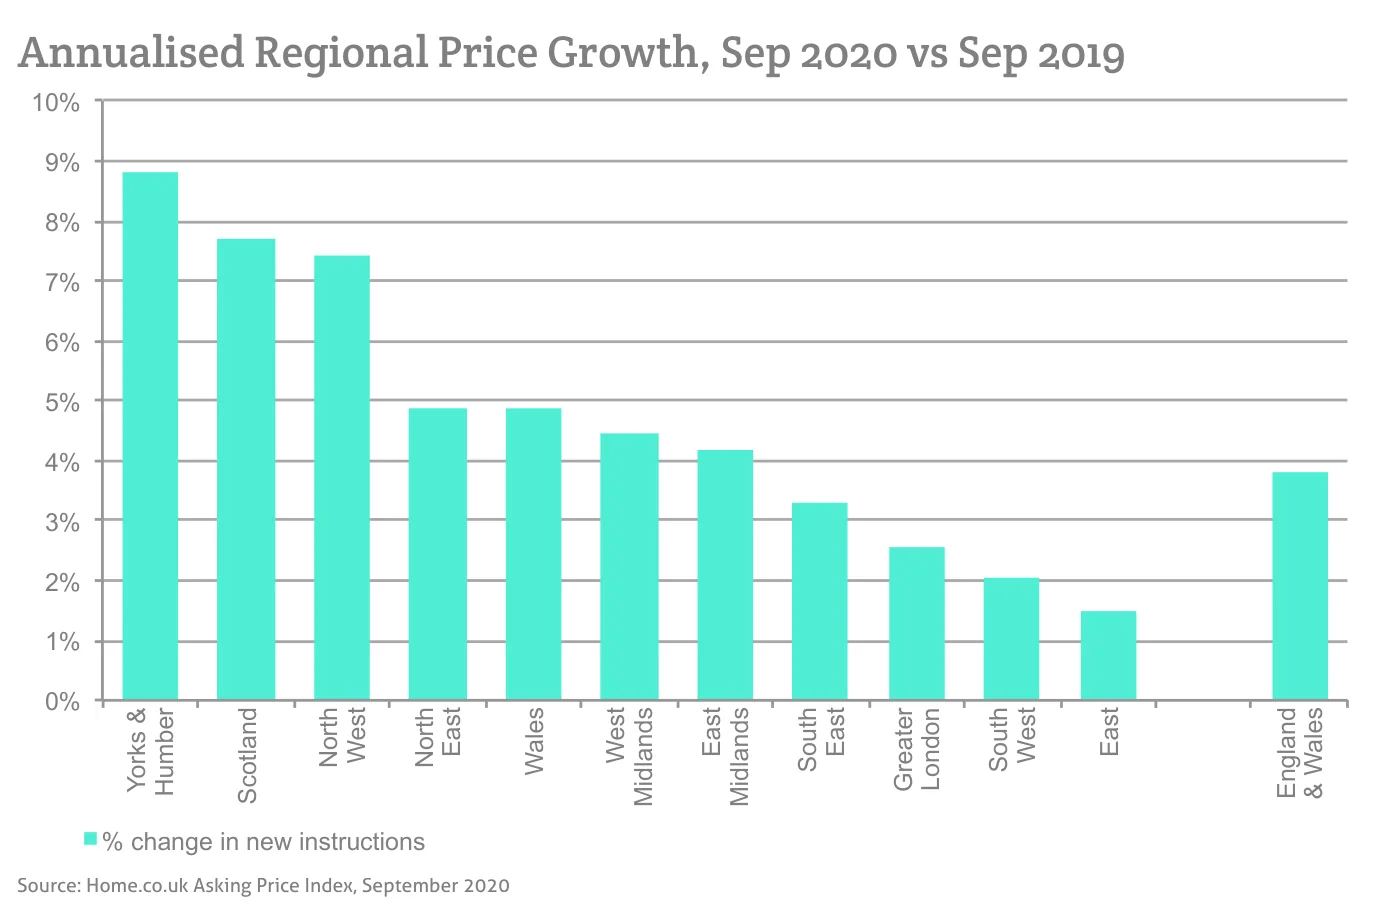
Source: Home.co.uk Asking Price Index, September 2020
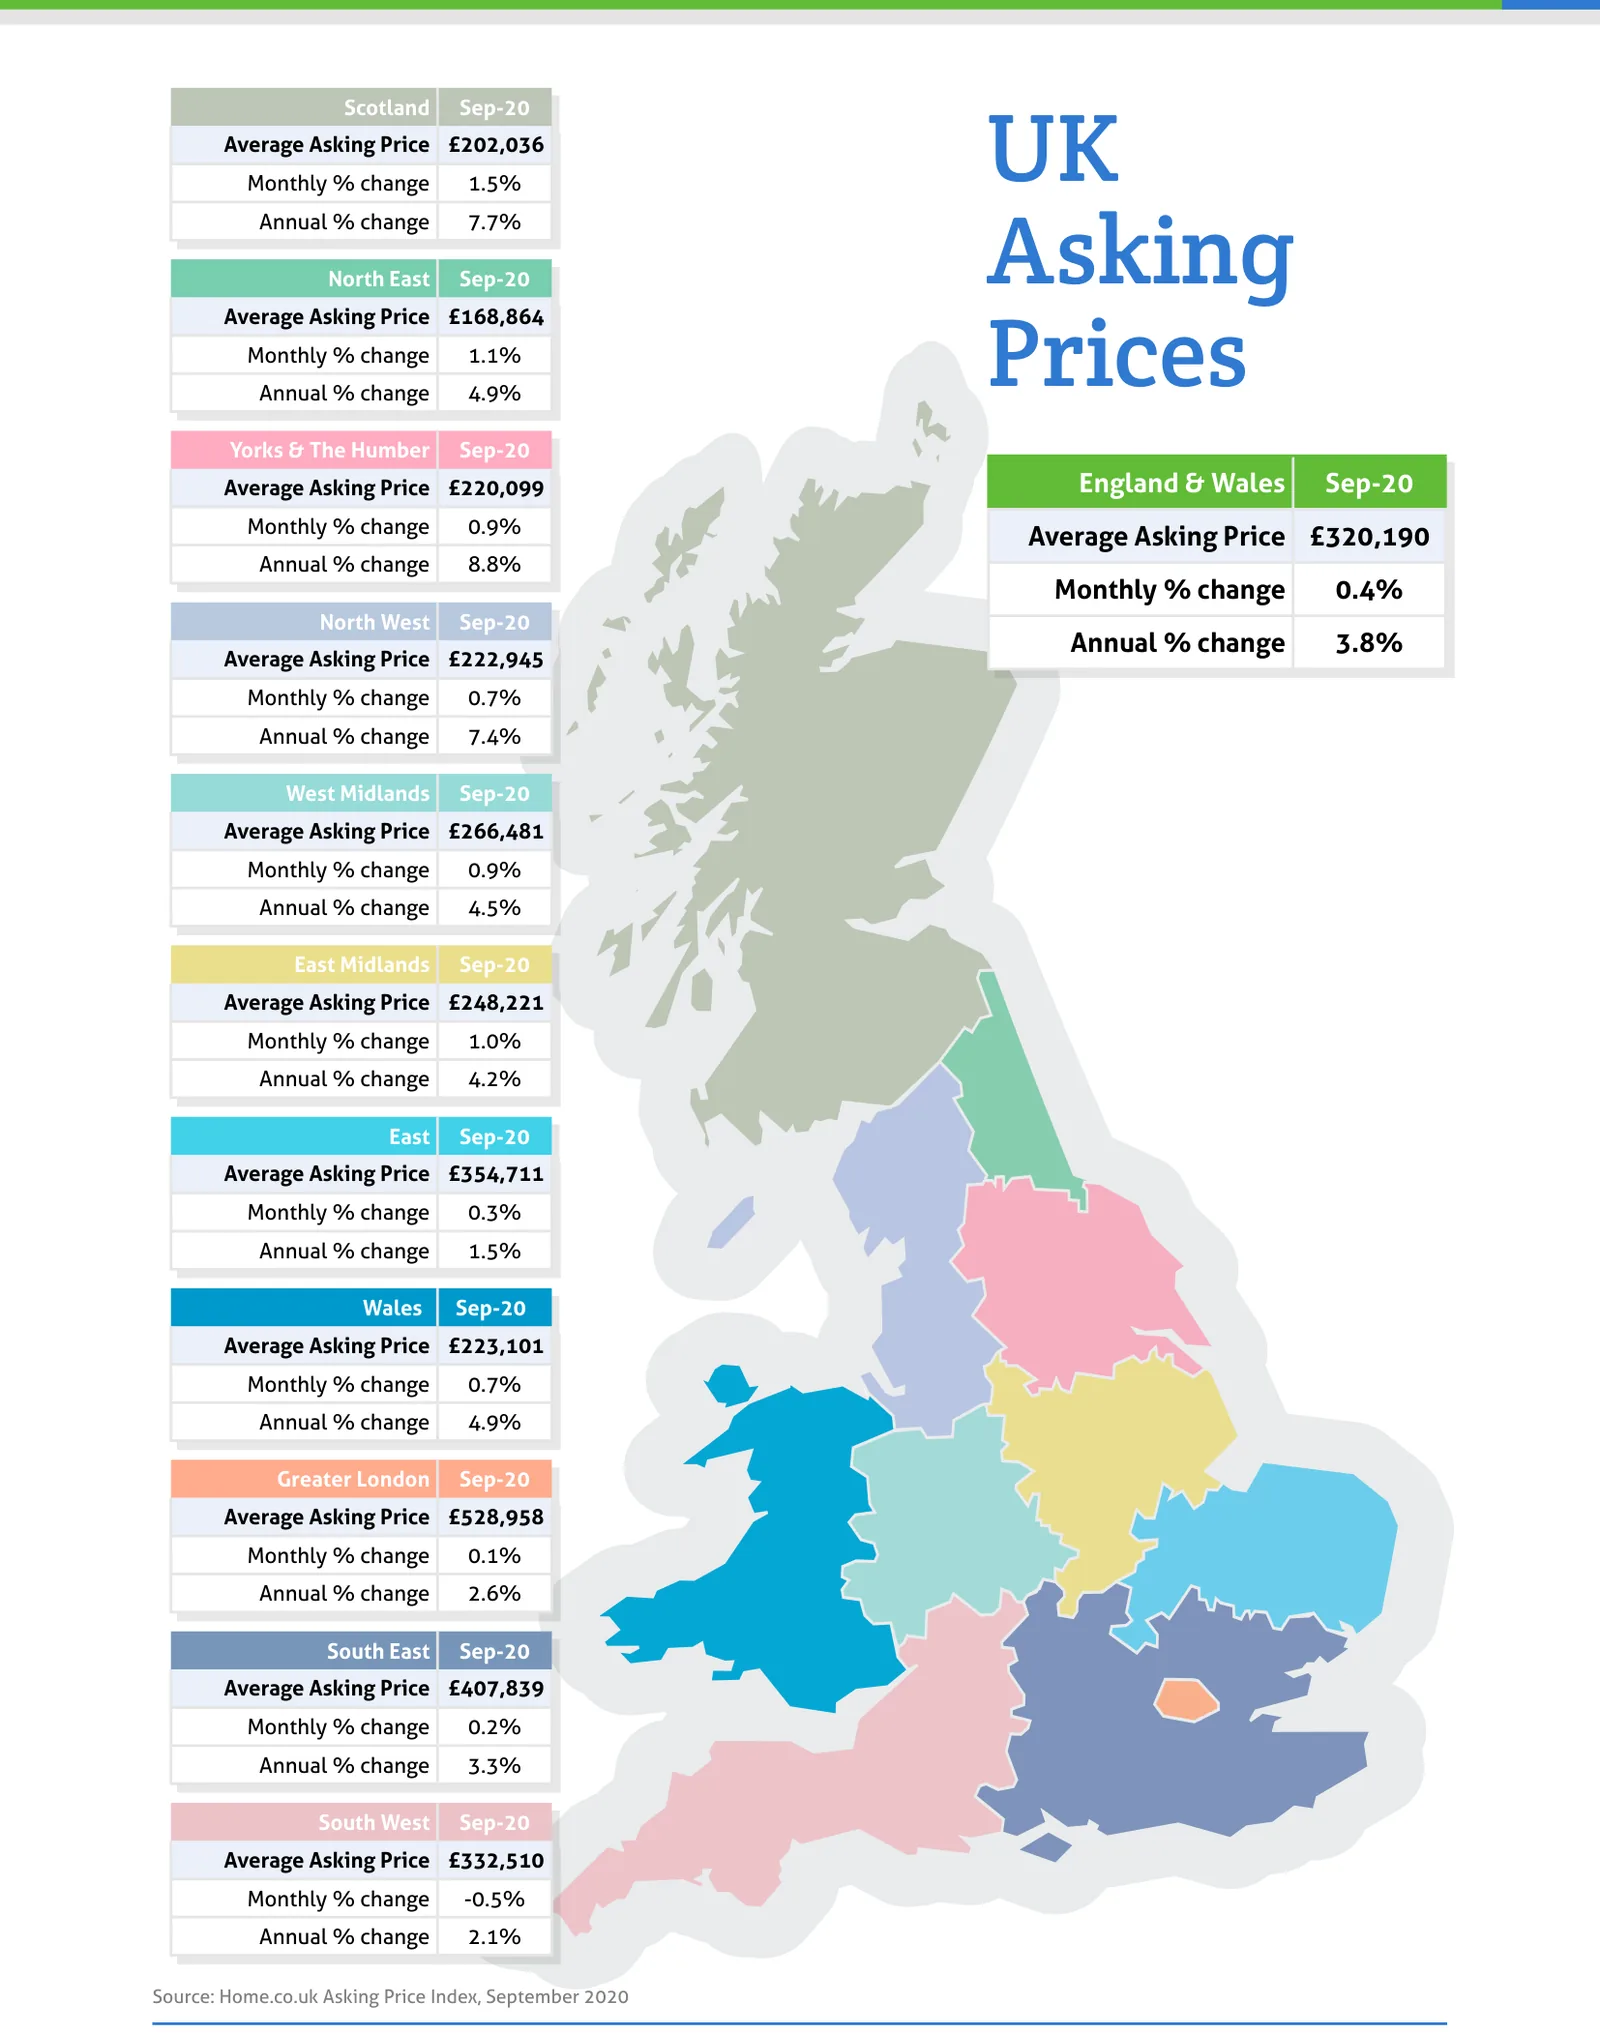
Source: Home.co.uk Asking Price Index, September 2020
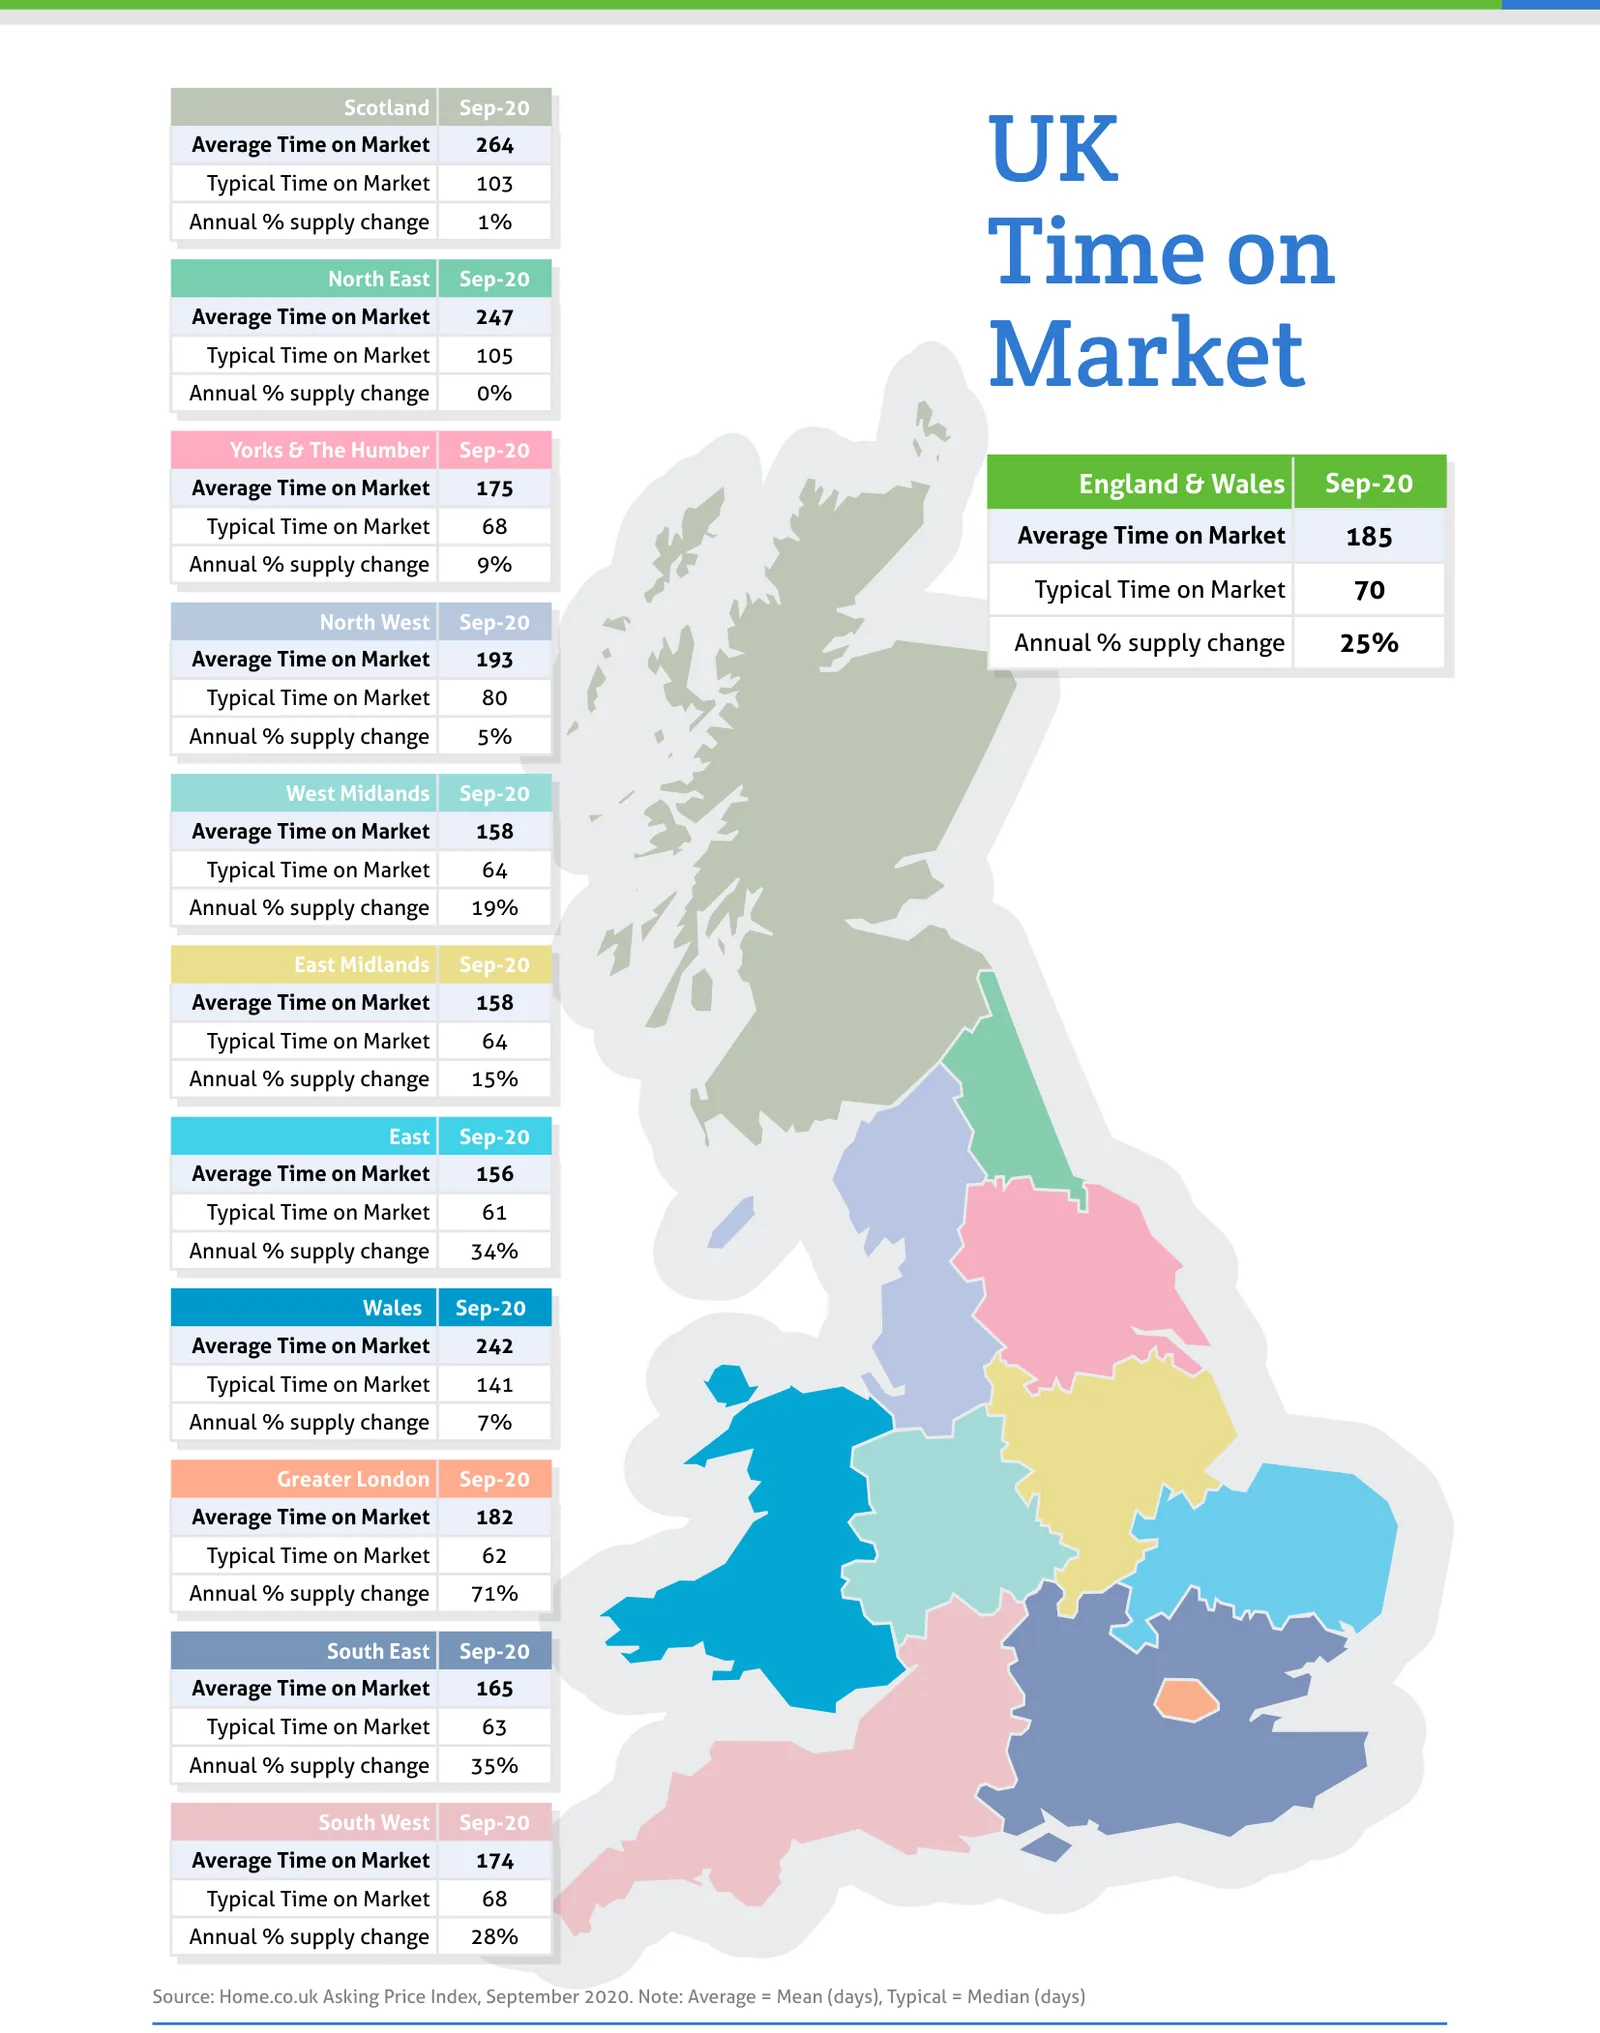
Source: Home.co.uk Asking Price Index, September 2020. Note: Average = Mean (days), Typical = Median (days)
Regional tables
UK Asking Prices, Sep-20
| Region | Average Asking Price | Monthly % change | Annual % change |
|---|---|---|---|
| Scotland | £202,036 | 1.5% | 7.7% |
| North East | £168,864 | 1.1% | 4.9% |
| Yorks & The Humber | £220,099 | 0.9% | 8.8% |
| England & Wales | £320,190 | 0.4% | 3.8% |
| North West | £222,945 | 0.7% | 7.4% |
| West Midlands | £266,481 | 0.9% | 4.5% |
| East Midlands | £248,221 | 1.0% | 4.2% |
| East | £354,711 | 0.3% | 1.5% |
| Wales | £223,101 | 0.7% | 4.9% |
| Greater London | £528,958 | 0.1% | 2.6% |
| South East | £407,839 | 0.2% | 3.3% |
| South West | £332,510 | -0.5% | 2.1% |
UK Time on Market, Sep-20
| Region | Average Time on Market | Typical Time on Market | Annual % supply change |
|---|---|---|---|
| Scotland | 264 | 103 | 1% |
| North East | 247 | 105 | 0% |
| Yorks & The Humber | 175 | 68 | 9% |
| England & Wales | 185 | 70 | 25% |
| North West | 193 | 80 | 5% |
| West Midlands | 158 | 64 | 19% |
| East Midlands | 158 | 64 | 15% |
| East | 156 | 61 | 34% |
| Wales | 242 | 141 | 7% |
| Greater London | 182 | 62 | 71% |
| South East | 165 | 63 | 35% |
| South West | 174 | 68 | 28% |
From the director's commentary
"The UK capital's property market is suffering from a multiplicity of problems. First and foremost, in complete contrast to the rest of the country, rents are falling."
Doug Shephard, Director at Home.co.uk
Read the full September 2020 edition (PDF, 8 pages)
About the Home Asking Price Index
The Home Asking Price Index measures the change in the prices sellers ask for residential property across England, Wales and Scotland. Today it is computed every month from around half a million advertised homes and is mix-adjusted, so a change in what happens to be on the market does not move the figure; earlier editions state the sample they were built from. Because an asking price is set months before a sale completes, the index runs around five months ahead of completed-sale measures such as the UK House Price Index.
Every edition in the archive, back to October 2006, is listed on the index page. How we measure the UK property market explains the listing data behind it, and today's figures by area are on house prices and rental prices.
Text and figures above are quoted from the September 2020 edition as published, with punctuation normalised for the web, and are not revised. Later editions may restate them.
More in What is happening to house prices: the Home guide
Thinking about your next move?
See what your home's worth in seconds, with the UK's longest-running property data behind it.
Get an instant valuation