

























Home Asking Price Index, September 2019: first green shoots in London despite Brexit ire
London shows early signs of recovery as stock falls 18% year-on-year, while England and Wales prices stay broadly flat, down just 0.1% annually.

This is the September 2019 edition of the Home Asking Price Index, released on 12 September 2019, under the headline:
First Green Shoots in London Despite Brexit Ire
The headlines and summary below are the report's own words, with the key figures as it published them, followed by the report's charts and regional tables as printed.
Headlines
- Hackney, Fulham and Haringey markets are on the rebound as competition for the limited stock available drives down the Typical Time on Market and stabilises the median price.
- In fact, prices are already on the rise in Haringey with the typical asking price up 2% year-on-year.
- Stock levels down 18% year-on-year in London, rebalancing supply and demand.
- Supply of new instructions down 14% in Greater London and by 2% overall (year-on-year, England and Wales).
- National average price growth remains just into the negative by a mere -0.1% month-on-month.
- Effectively no change in the mix-adjusted average home price in England and Wales (down just 0.1% year-on-year).
- Total sales stock levels across England and Wales slightly down again by 3.0%.
- Typical Time on Market for England and Wales is currently 96 days (median), just six days longer than in September 2018, a narrowing margin.
- Typical Time on Market rises indicate the worst regional slowdowns are in the East of England (+13%), the East Midlands (+13%), the South West (+11%) and the West Midlands (+11% year-on-year).
- East of England is the UK's worst-performing region, with the average asking price down by 2.9% over the last twelve months.
Summary
This month we are witness to an extraordinary part of the UK property cycle, wherein northern and western regions (especially Wales) are in the final throes of their growth phase while London shows the first green shoots following a long and protracted downturn. Such is the cyclical complexity of the British property market.
London takes the spotlight this month as soaring rents tempt investors back into the capital's letting market. Rock-bottom sales and rental stock levels are initiating a revitalisation of the London sales market, led by several key boroughs. Wandsworth, Hackney, Haringey, Hammersmith and Fulham, Southwark and Islington, are all showing double digit rent inflation, yields are soaring and, consequently, home prices are about to surge.
Concomitantly, several regions are slowing rapidly, a precursor to the inevitable period of post-boom price correction (East and West Midlands), whilst other regions, for instance the East of England, are showing negative growth as the painful rebalancing of supply and demand takes effect.
Key figures
| Measure | Figure |
|---|---|
| Monthly price change (England & Wales) | -0.1% |
| Annual price change (England & Wales) | -0.1% |
| Typical Time on Market (England & Wales) | 96 days |
| Total sales stock change (England & Wales) | -3.0% |
| New instructions change (England & Wales) | -2% |
Figures are for England and Wales unless the report states otherwise, as published in the edition.
Charts from the report
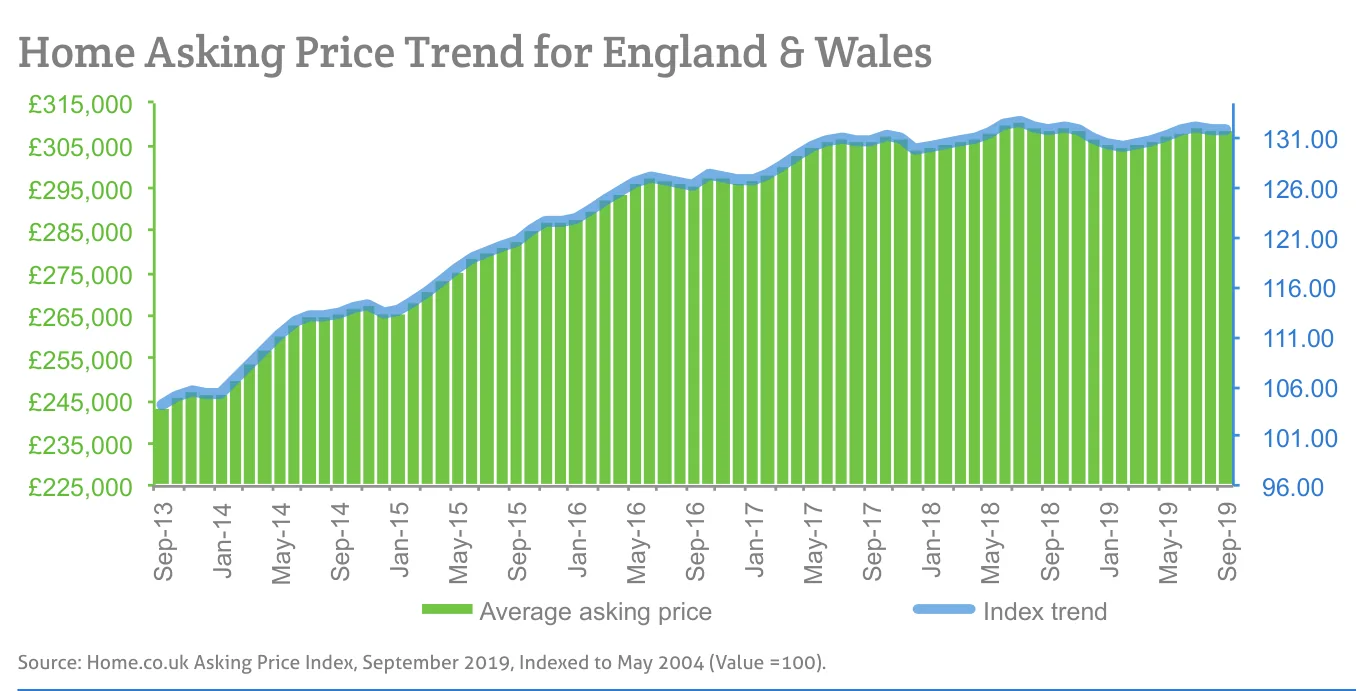
Source: Home.co.uk Asking Price Index, September 2019, Indexed to May 2004 (Value =100).
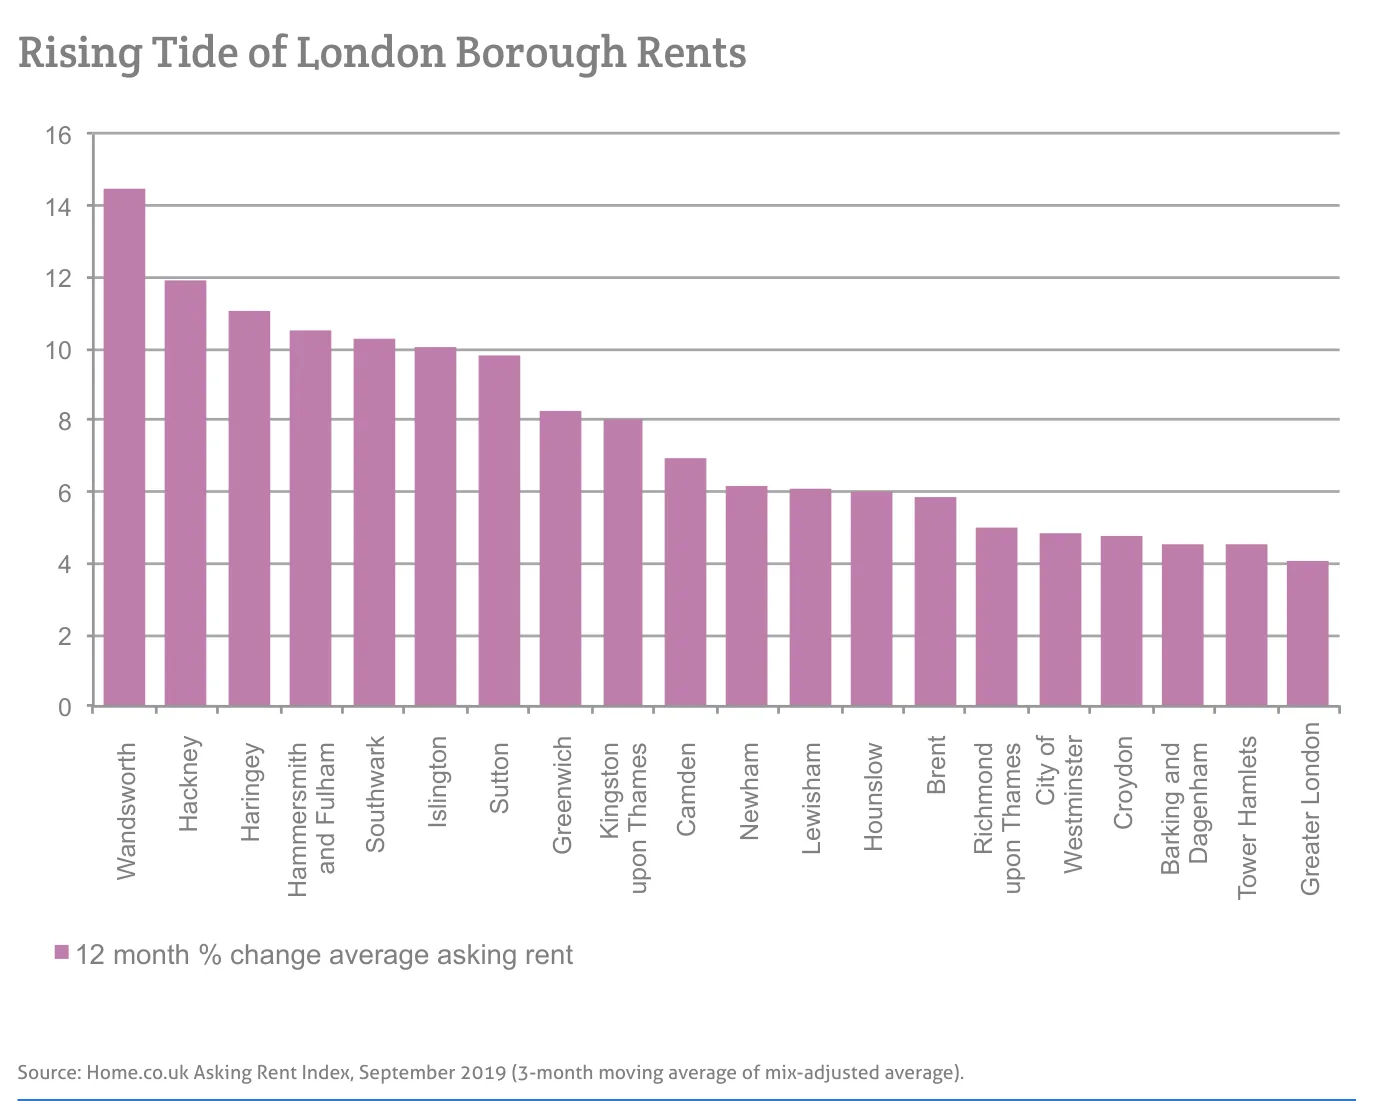
Source: Home.co.uk Asking Rent Index, September 2019 (3-month moving average of mix-adjusted average).
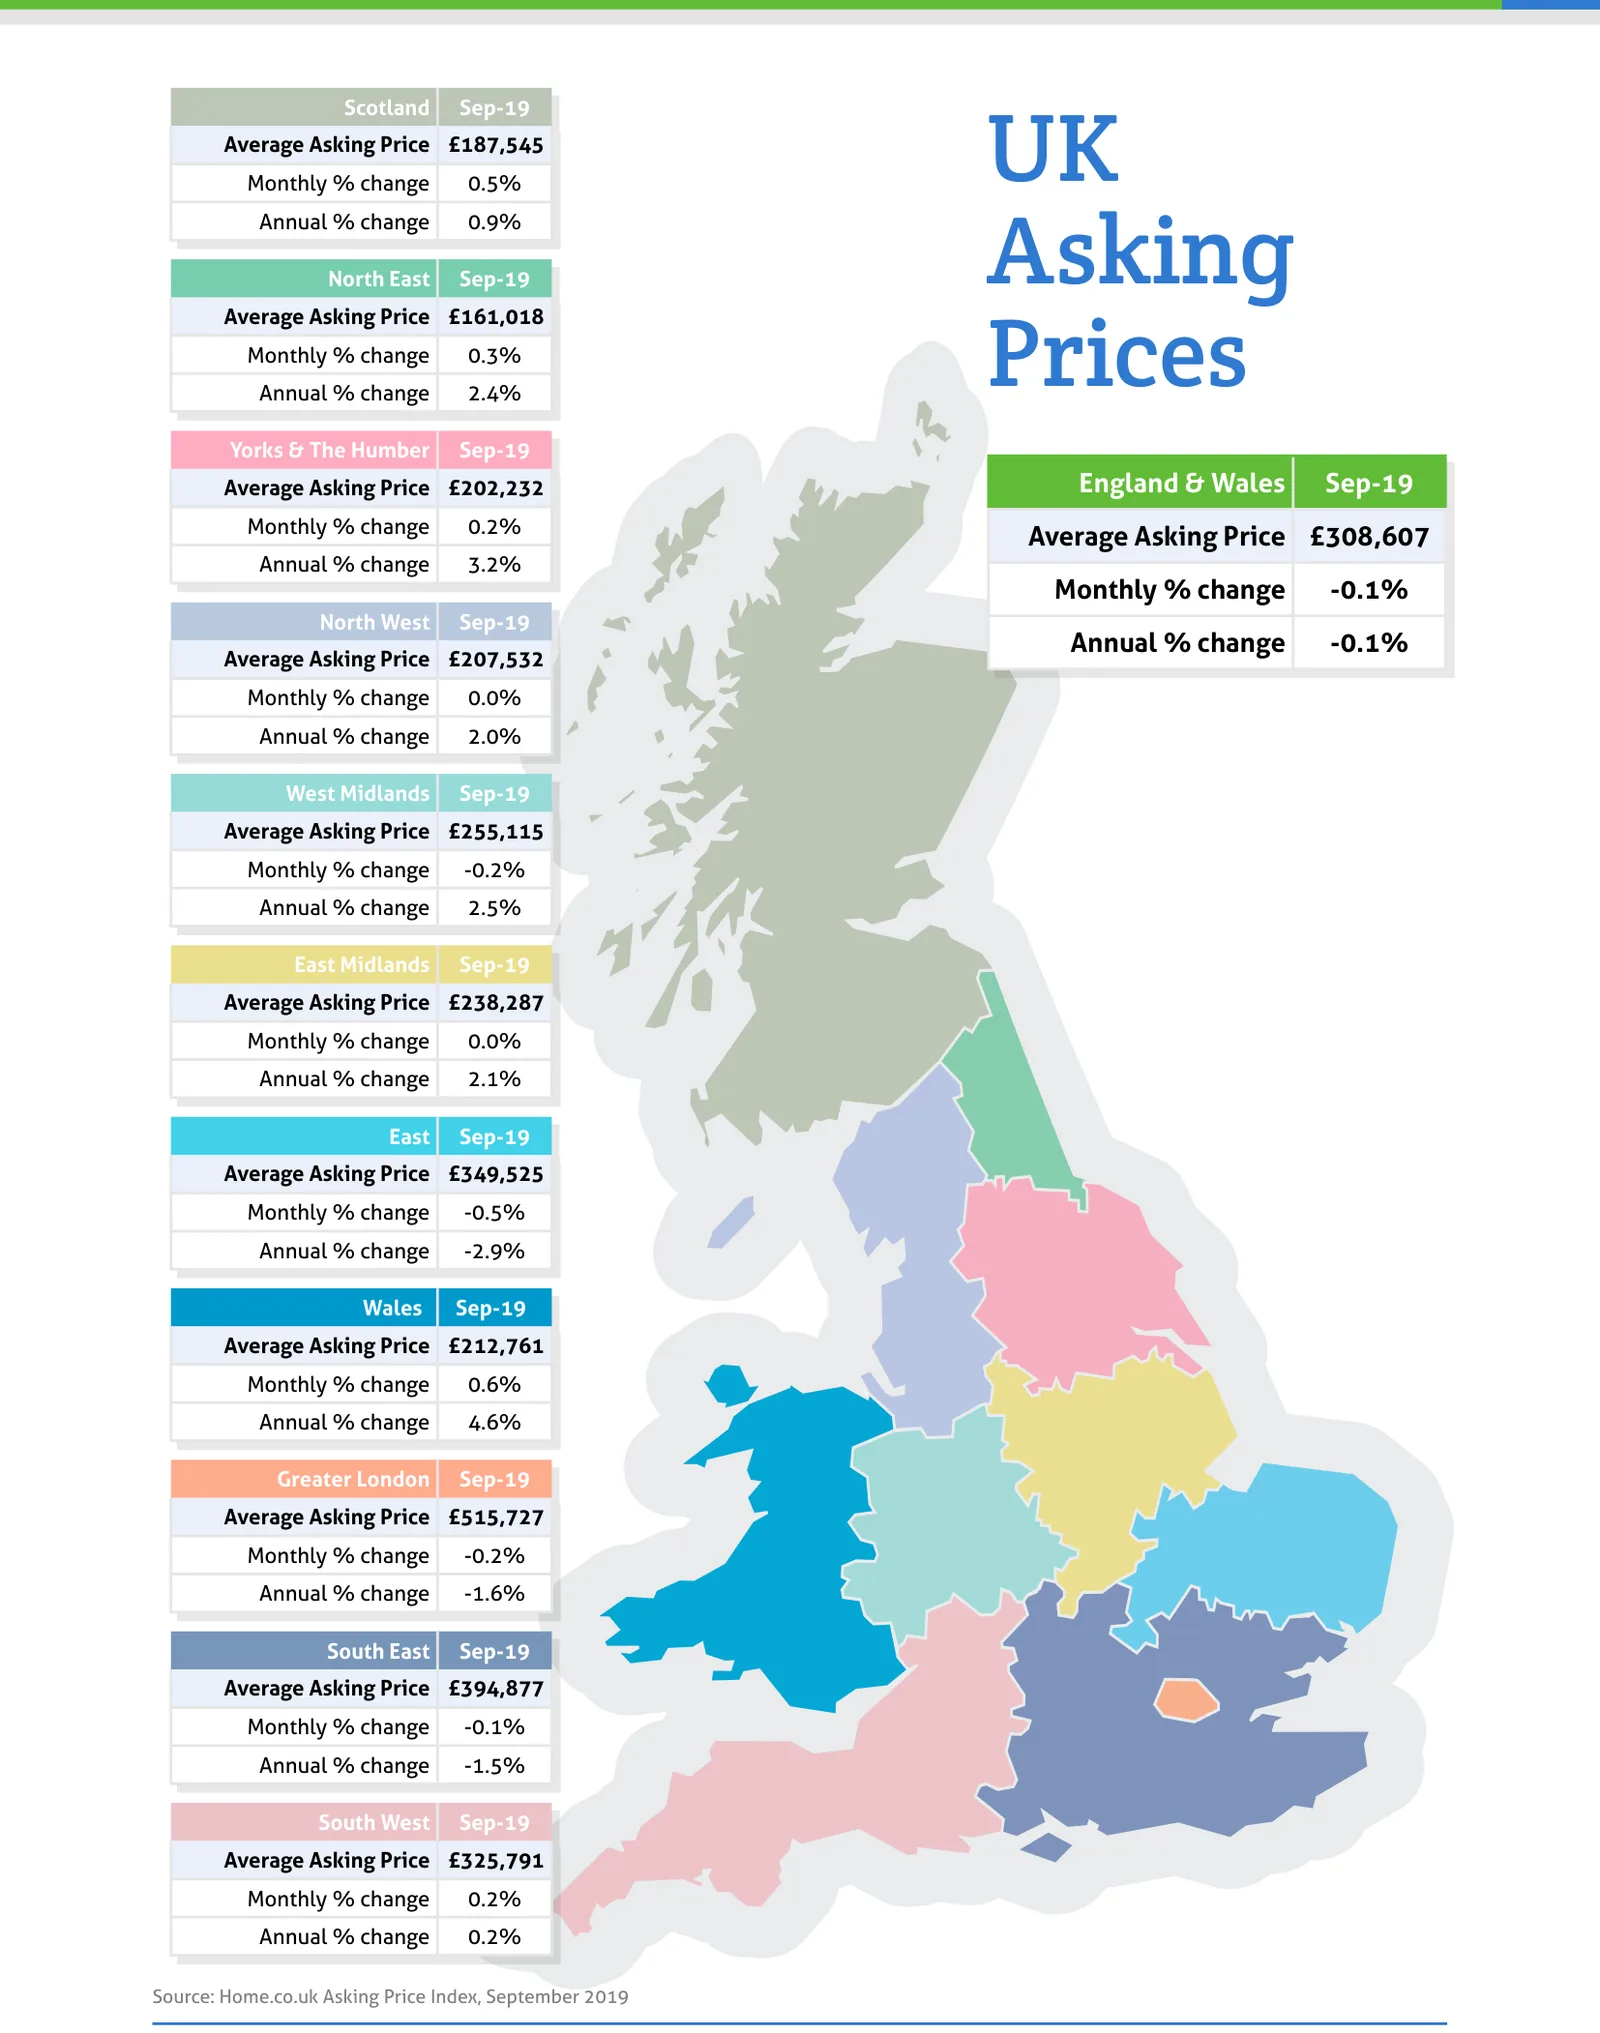
Source: Home.co.uk Asking Price Index, September 2019
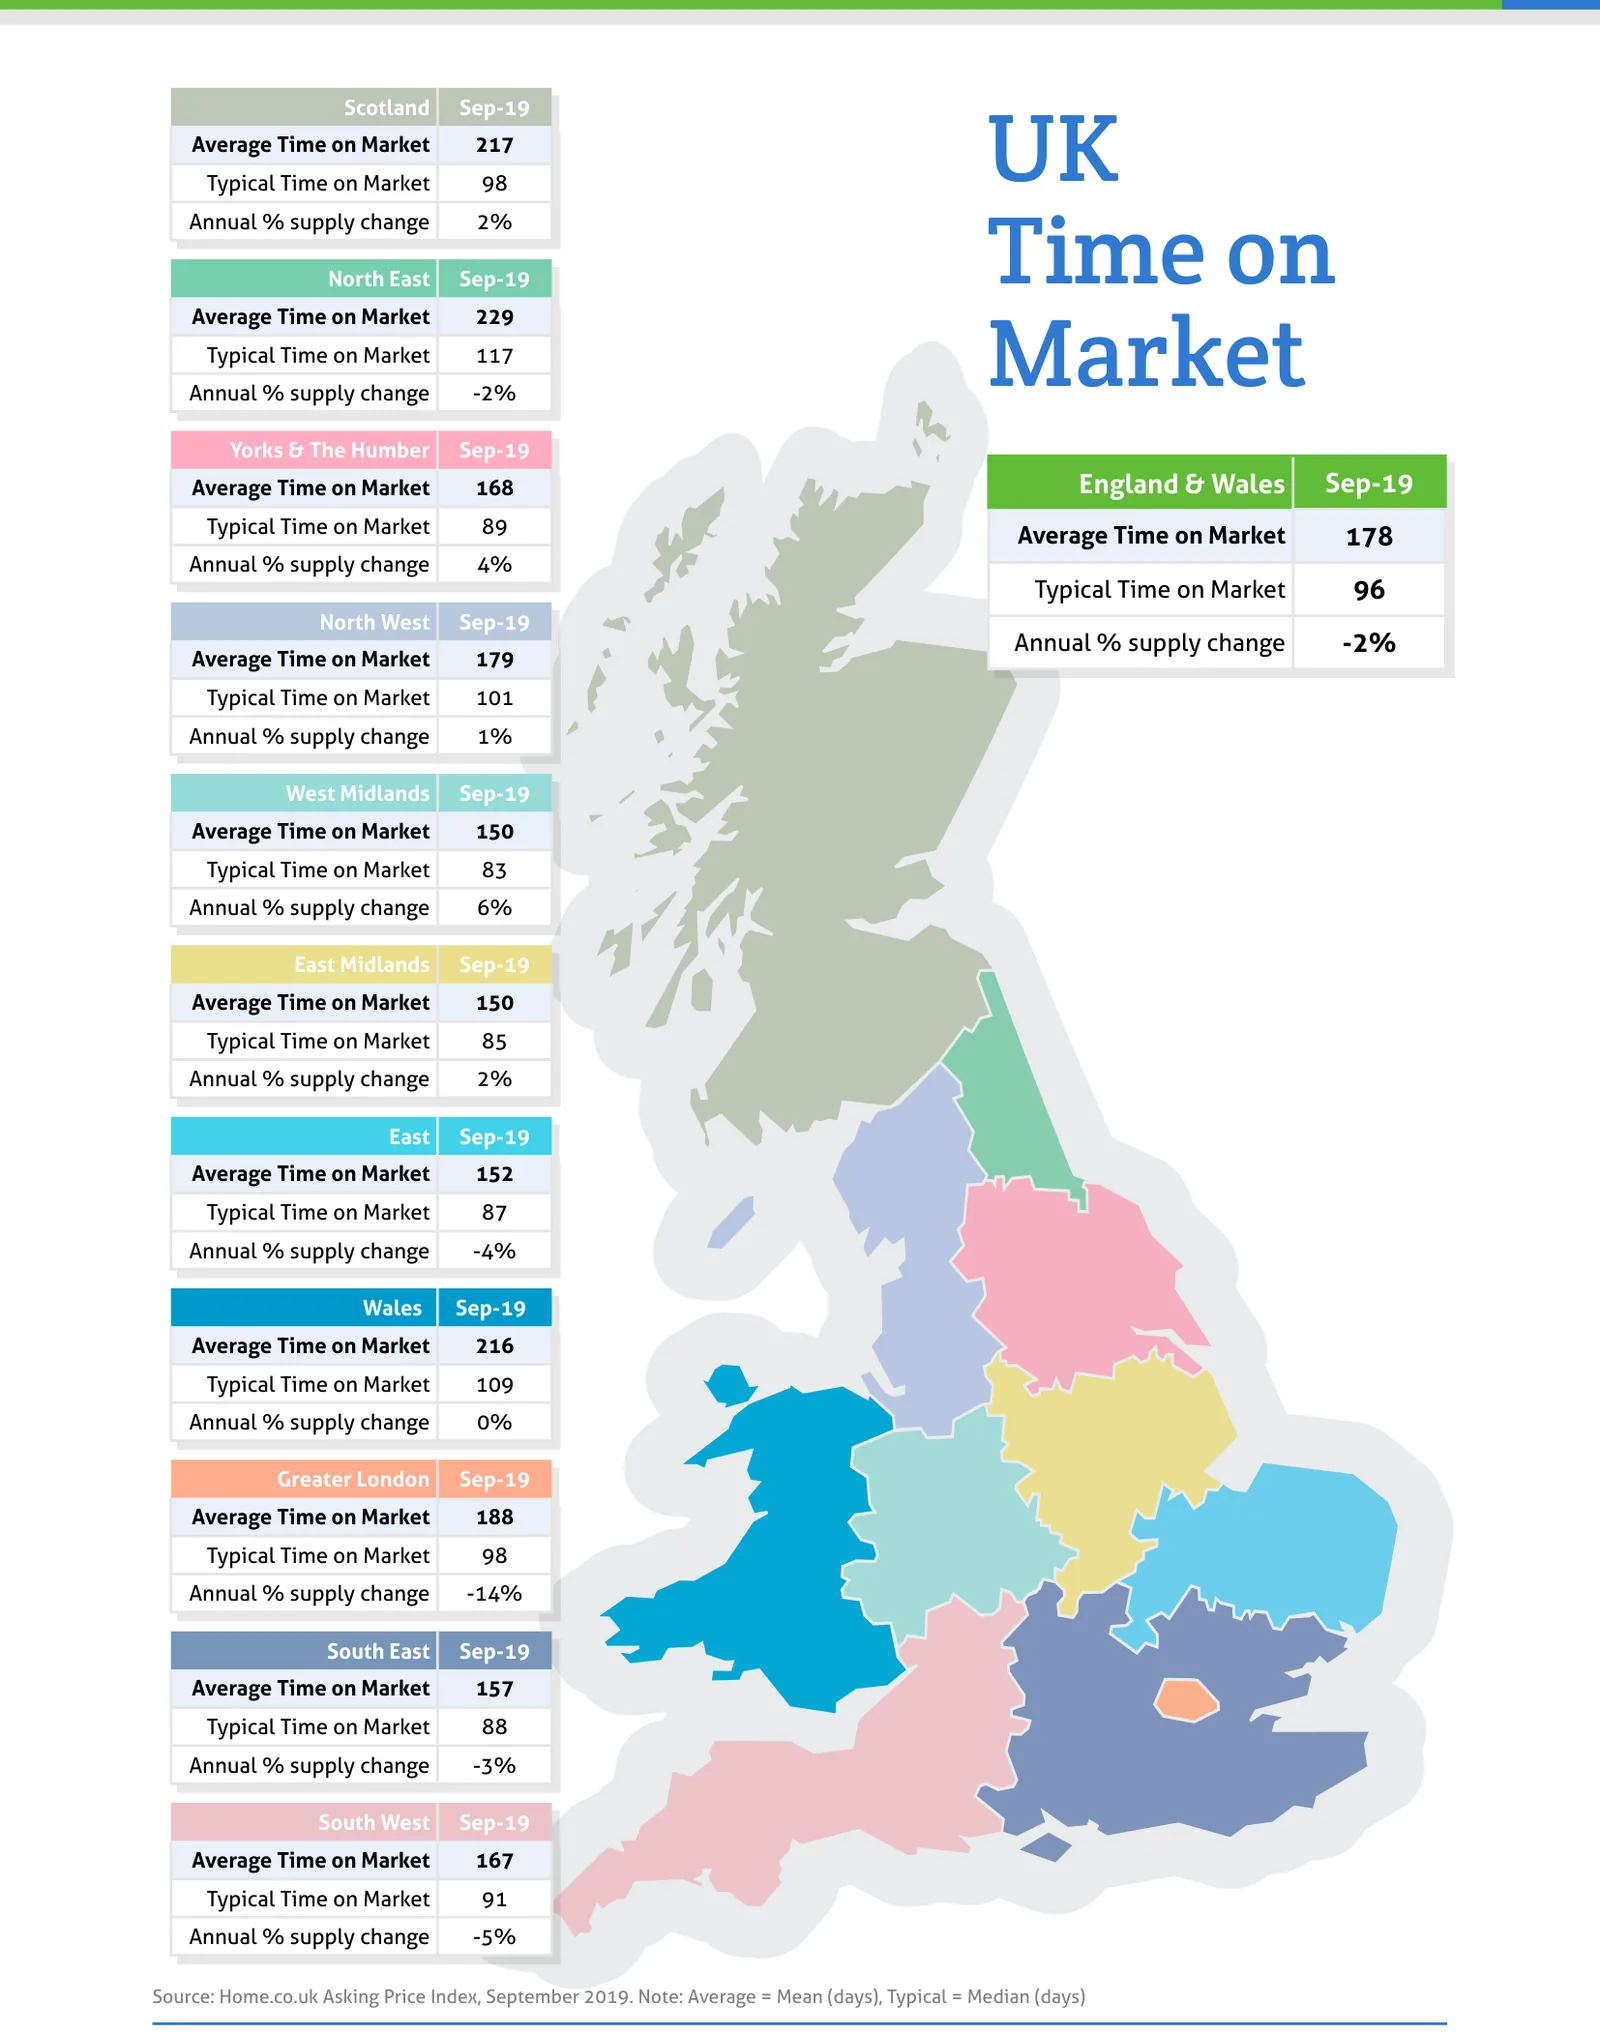
Source: Home.co.uk Asking Price Index, September 2019. Note: Average = Mean (days), Typical = Median (days)
Regional tables
UK Asking Prices, Sep-19
| Region | Average Asking Price | Monthly % change | Annual % change |
|---|---|---|---|
| Scotland | £187,545 | 0.5% | 0.9% |
| North East | £161,018 | 0.3% | 2.4% |
| Yorks & The Humber | £202,232 | 0.2% | 3.2% |
| England & Wales | £308,607 | -0.1% | -0.1% |
| North West | £207,532 | 0.0% | 2.0% |
| West Midlands | £255,115 | -0.2% | 2.5% |
| East Midlands | £238,287 | 0.0% | 2.1% |
| East | £349,525 | -0.5% | -2.9% |
| Wales | £212,761 | 0.6% | 4.6% |
| Greater London | £515,727 | -0.2% | -1.6% |
| South East | £394,877 | -0.1% | -1.5% |
| South West | £325,791 | 0.2% | 0.2% |
UK Time on Market, Sep-19
| Region | Average Time on Market | Typical Time on Market | Annual % supply change |
|---|---|---|---|
| Scotland | 217 | 98 | 2% |
| North East | 229 | 117 | -2% |
| Yorks & The Humber | 168 | 89 | 4% |
| England & Wales | 178 | 96 | -2% |
| North West | 179 | 101 | 1% |
| West Midlands | 150 | 83 | 6% |
| East Midlands | 150 | 85 | 2% |
| East | 152 | 87 | -4% |
| Wales | 216 | 109 | 0% |
| Greater London | 188 | 98 | -14% |
| South East | 157 | 88 | -3% |
| South West | 167 | 91 | -5% |
From the director's commentary
"Even Brexit pandemonium is not enough to quench the natural re-emergence of vigour in the London property cycle."
Doug Shephard, Director at Home.co.uk
Read the full September 2019 edition (PDF, 8 pages)
About the Home Asking Price Index
The Home Asking Price Index measures the change in the prices sellers ask for residential property across England, Wales and Scotland. Today it is computed every month from around half a million advertised homes and is mix-adjusted, so a change in what happens to be on the market does not move the figure; earlier editions state the sample they were built from. Because an asking price is set months before a sale completes, the index runs around five months ahead of completed-sale measures such as the UK House Price Index.
Every edition in the archive, back to October 2006, is listed on the index page. How we measure the UK property market explains the listing data behind it, and today's figures by area are on house prices and rental prices.
Text and figures above are quoted from the September 2019 edition as published, with punctuation normalised for the web, and are not revised. Later editions may restate them.
More in What is happening to house prices: the Home guide
Thinking about your next move?
See what your home's worth in seconds, with the UK's longest-running property data behind it.
Get an instant valuation