

























Home Asking Price Index, September 2015: average London house price up £60, 000
England and Wales asking prices rose 0.4% monthly and 6.5% annually to £282,744, while August saw record low supply of new properties for sale.

This is the September 2015 edition of the Home Asking Price Index, released on 15 September 2015, under the headline:
Average London House Price up £60,000
The headlines and summary below are the report's own words, with the key figures as it published them, followed by the report's charts and regional tables as printed.
Headlines
- Average Greater London house prices rose by £60,000 (12.8%) over the last 12 months.
- Supply of property for sale falls to record low for August (down 59% since Aug 2007).
- Prices move up 0.4% overall in England and Wales during the last month.
- The South East remains the UK's fastest-moving regional market and prices outshine Greater London with a 6-month rise of 6.1%.
- The average annual home price appreciation for England and Wales rises to 6.5%.
- Asking prices rose in all English regions, Scotland and Wales this month. The biggest rises were observed in the East of England and the South East (0.9% and 1.0% respectively).
Summary
Despite economic shockwaves emanating from China, overall the UK property market remains in rude health. Buyer demand and short supply in London and the southern regions continues to drive the national average higher, but at a lesser rate than last year. The supply crisis is worsening and August recorded the lowest number of properties entering the market for that month since the onset of the financial crisis.
Of course, the key driver for demand is the availability of mortgage finance, which remains abundant. Talk of interest rate rises at the Bank of England has not dented buyers' appetite. Competition between investors remains fierce in London and surrounding regions where the lack of supply is felt most keenly. In London and the East of England, the volumes of properties entering the market are down 15% and 18% respectively year-on-year and down 75% and 73% vs. August 2008.
Overall, the current mix-adjusted average asking price for England and Wales is 6.5% higher than it was in September 2014, and we expect further upward pressure on prices over the coming months.
Key figures
| Measure | Figure |
|---|---|
| Average asking price (England & Wales) | £282,744 |
| Monthly change (England & Wales) | 0.4% |
| Annual change (England & Wales) | 6.5% |
| Supply of property for sale, August (change since Aug 2007) | down 59% |
Figures are for England and Wales unless the report states otherwise, as published in the edition.
Charts from the report
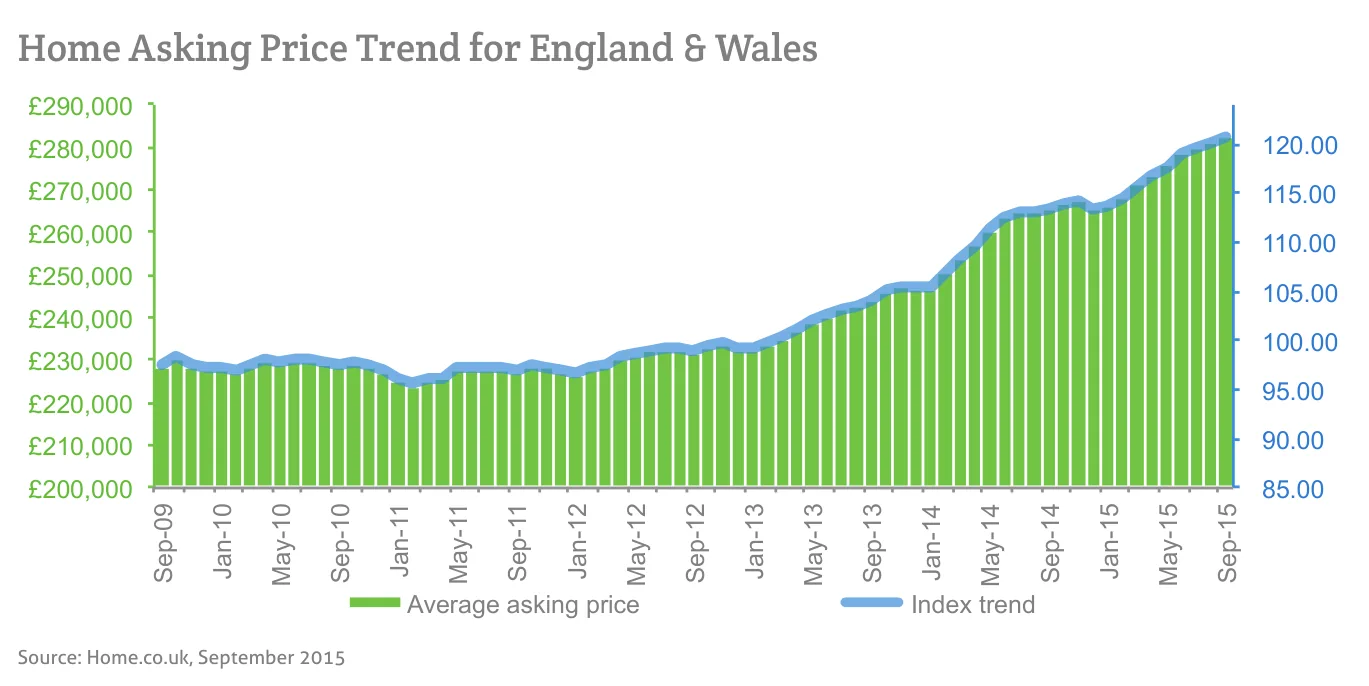
Source: Home.co.uk, September 2015
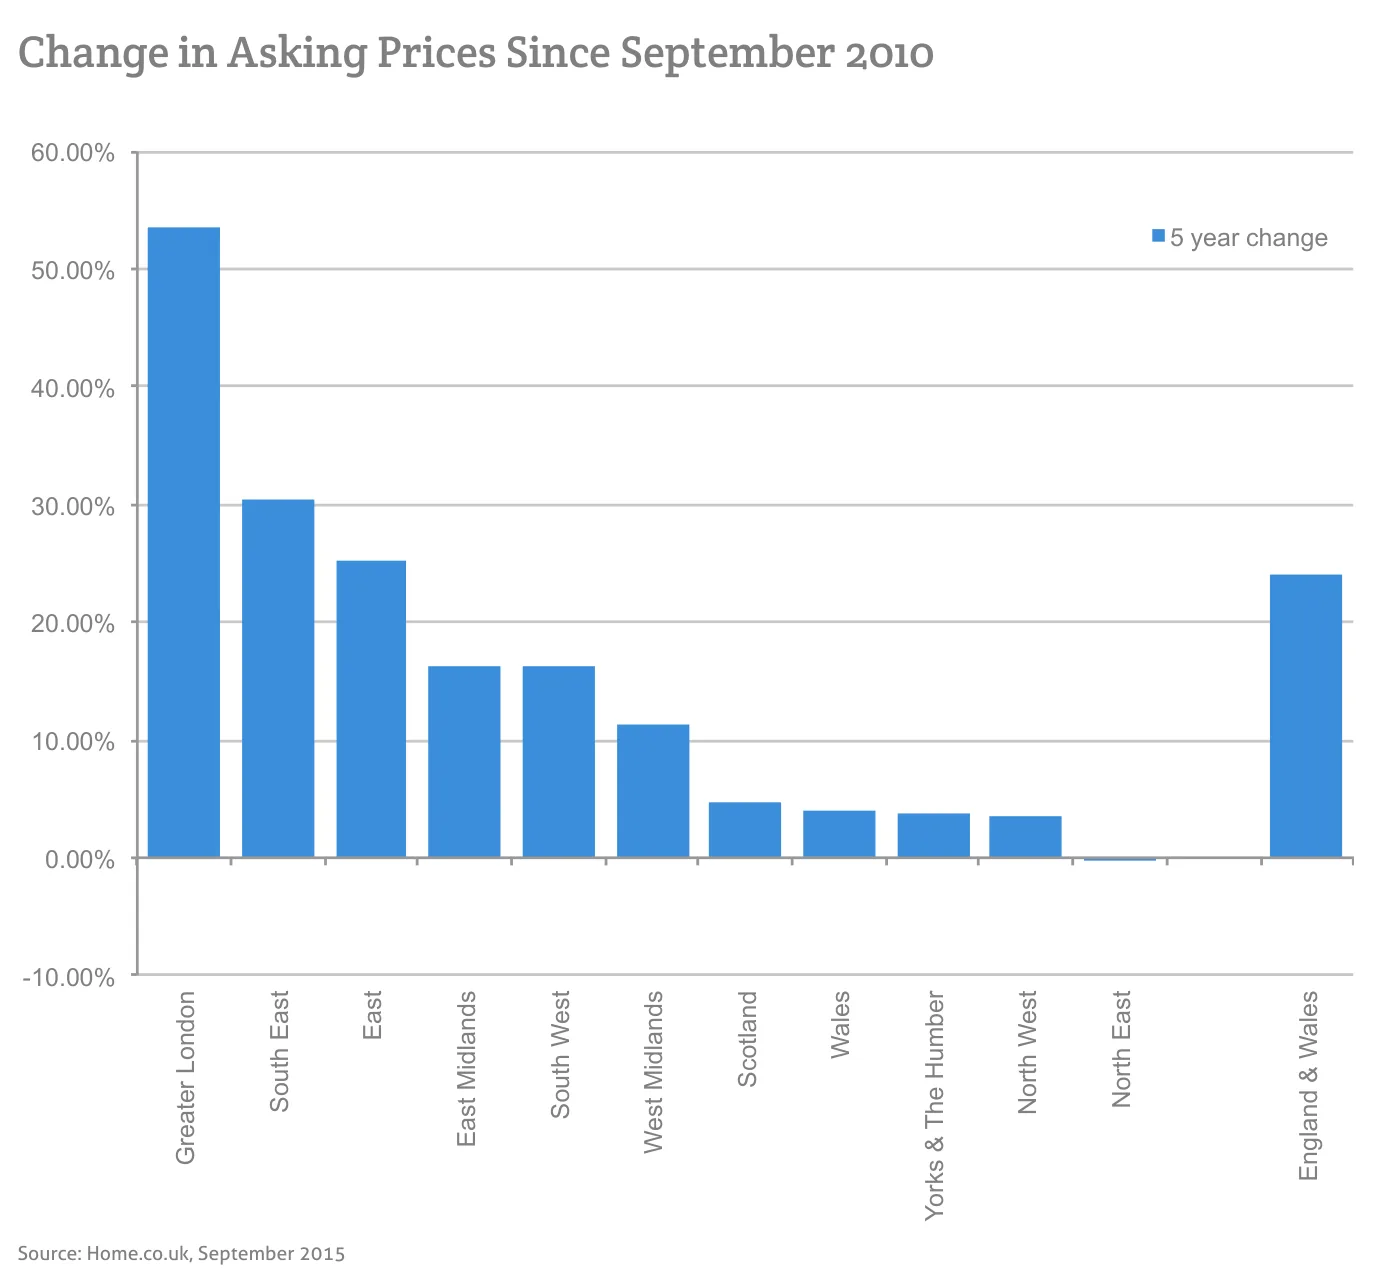
Source: Home.co.uk, September 2015
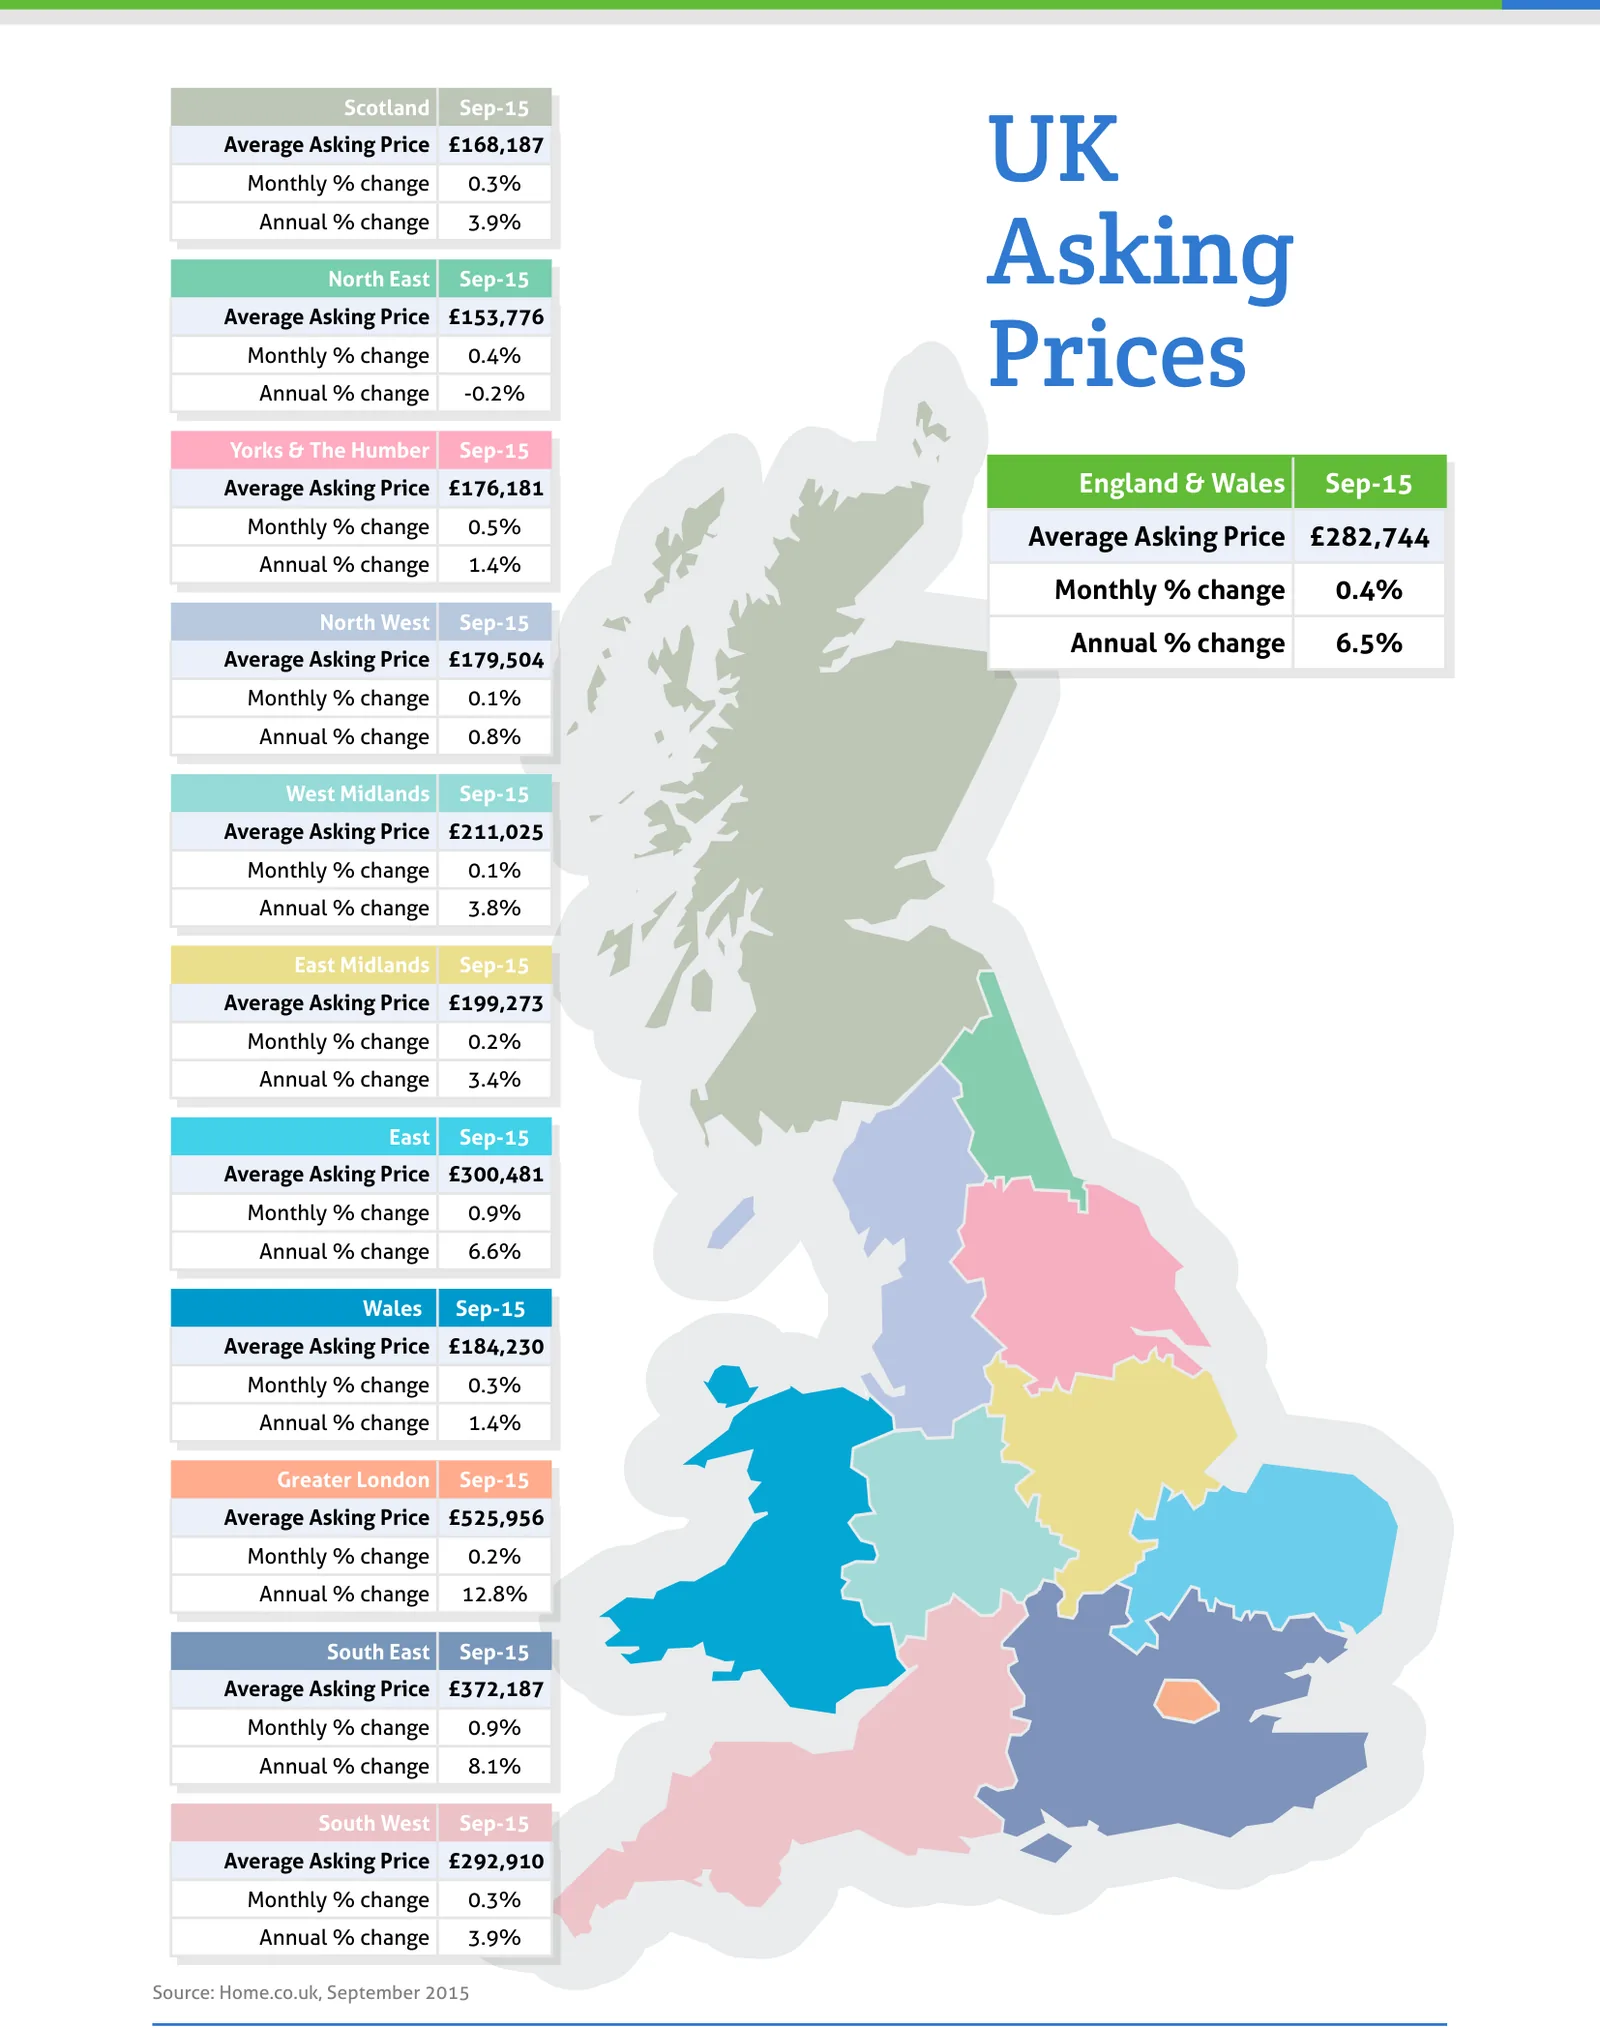
Source: Home.co.uk, September 2015
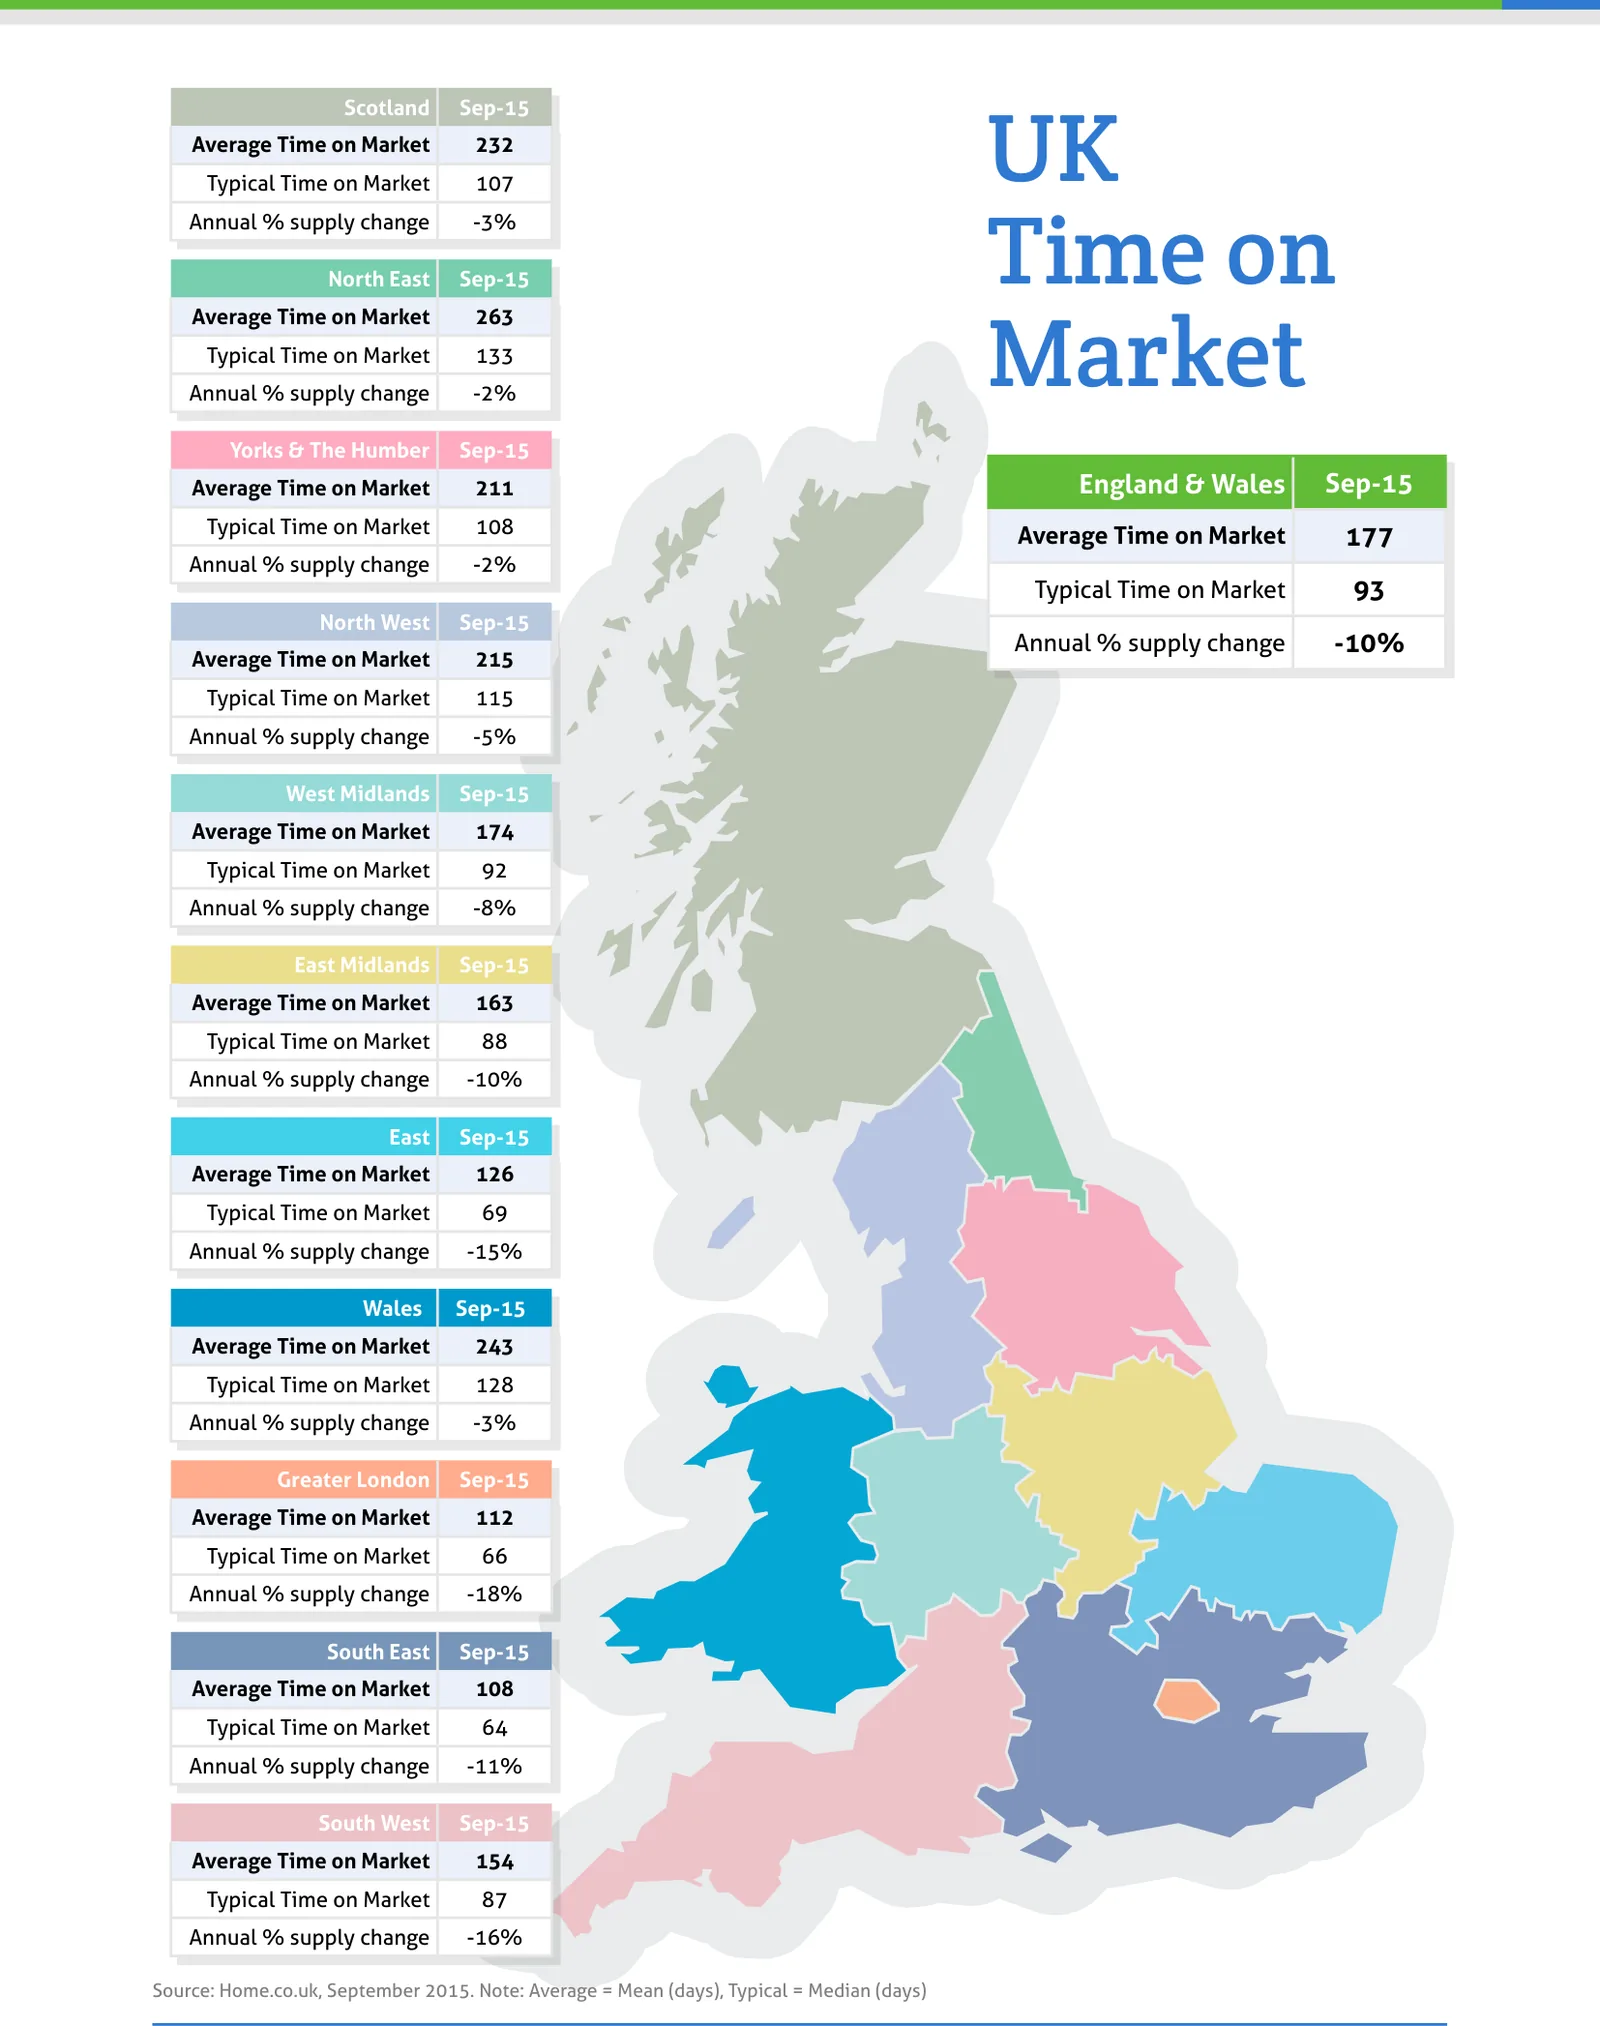
Source: Home.co.uk, September 2015. Note: Average = Mean (days), Typical = Median (days)
Regional tables
UK Asking Prices, Sep-15
| Region | Average Asking Price | Monthly % change | Annual % change |
|---|---|---|---|
| Scotland | £168,187 | 0.3% | 3.9% |
| North East | £153,776 | 0.4% | -0.2% |
| Yorks & The Humber | £176,181 | 0.5% | 1.4% |
| England & Wales | £282,744 | 0.4% | 6.5% |
| North West | £179,504 | 0.1% | 0.8% |
| West Midlands | £211,025 | 0.1% | 3.8% |
| East Midlands | £199,273 | 0.2% | 3.4% |
| East | £300,481 | 0.9% | 6.6% |
| Wales | £184,230 | 0.3% | 1.4% |
| Greater London | £525,956 | 0.2% | 12.8% |
| South East | £372,187 | 0.9% | 8.1% |
| South West | £292,910 | 0.3% | 3.9% |
UK Time on Market, Sep-15
| Region | Average Time on Market | Typical Time on Market | Annual % supply change |
|---|---|---|---|
| Scotland | 232 | 107 | -3% |
| North East | 263 | 133 | -2% |
| Yorks & The Humber | 211 | 108 | -2% |
| England & Wales | 177 | 93 | -10% |
| North West | 215 | 115 | -5% |
| West Midlands | 174 | 92 | -8% |
| East Midlands | 163 | 88 | -10% |
| East | 126 | 69 | -15% |
| Wales | 243 | 128 | -3% |
| Greater London | 112 | 66 | -18% |
| South East | 108 | 64 | -11% |
| South West | 154 | 87 | -16% |
From the director's commentary
"We maintain that, in view of such diversity of fortunes across the country, it is near impossible to imagine how the Bank of England can realistically raise interest rates anytime soon. Property markets in the North and Wales remain very fragile and would suffer significant declines should the cost of borrowing rise, causing negative equity and devastation of mortgage lenders' balance sheets."
Doug Shephard, Director at Home.co.uk
Read the full September 2015 edition (PDF, 6 pages)
About the Home Asking Price Index
The Home Asking Price Index measures the change in the prices sellers ask for residential property across England, Wales and Scotland. Today it is computed every month from around half a million advertised homes and is mix-adjusted, so a change in what happens to be on the market does not move the figure; earlier editions state the sample they were built from. Because an asking price is set months before a sale completes, the index runs around five months ahead of completed-sale measures such as the UK House Price Index.
Every edition in the archive, back to October 2006, is listed on the index page. How we measure the UK property market explains the listing data behind it, and today's figures by area are on house prices and rental prices.
Text and figures above are quoted from the September 2015 edition as published, with punctuation normalised for the web, and are not revised. Later editions may restate them.
More in What is happening to house prices: the Home guide
Thinking about your next move?
See what your home's worth in seconds, with the UK's longest-running property data behind it.
Get an instant valuation