

























Home Asking Price Index, September 2014: London prices finally slide as the market cools
UK asking prices edged up just 0.2% in the month while London prices dipped for the first time in 20 months amid rising supply.

This is the September 2014 edition of the Home Asking Price Index, released on 12 September 2014, under the headline:
London Prices Finally Slide as the Market Cools
The headlines and summary below are the report's own words, with the key figures as it published them, followed by the report's charts and regional tables as printed.
Headlines
- London prices dip under the weight of increased supply, ending a 20-month rally.
- Asking prices rise for an eighth consecutive month (by just 0.2%), making the average annual appreciation for England and Wales fall 0.3% to 9.0%.
- Outside of London, home prices rose in all English regions (except the North West) and Wales over the last month.
- Average prices were unchanged in Scotland and the North West.
- Supply of property for sale in Greater London up by 33% vs. August last year.
- Stratford tops the London property hotspot league table, with home prices leaping 45% over the last 12 months.
Summary
Tightening mortgage credit in the wake of MMR, coupled with increased supply, has served to quench further growth in London home prices for the time being. Home price inflation still persists outside of London but at an attenuated pace. Moreover, the surge in supply that has halted London price rises has not yet spread to adjacent regions.
Overall, the UK property market is cooling. The average asking price for a UK home has risen only 0.2% over the last month and 0.8% over the last three months. Correspondingly, London prices slipped 0.1% over the last month, yet have risen 9.8% over the last six months.
Key figures
| Measure | Figure |
|---|---|
| Average asking price (England & Wales) | £265,545 |
| Monthly change (England & Wales) | 0.20% |
| Annual change (England & Wales) | 8.95% |
| UK monthly price change | 0.2% |
| UK three-month price change | 0.8% |
| UK annual supply change | 3% |
| UK stock decline since 2007 | -55% |
Figures are for England and Wales unless the report states otherwise, as published in the edition.
Charts from the report
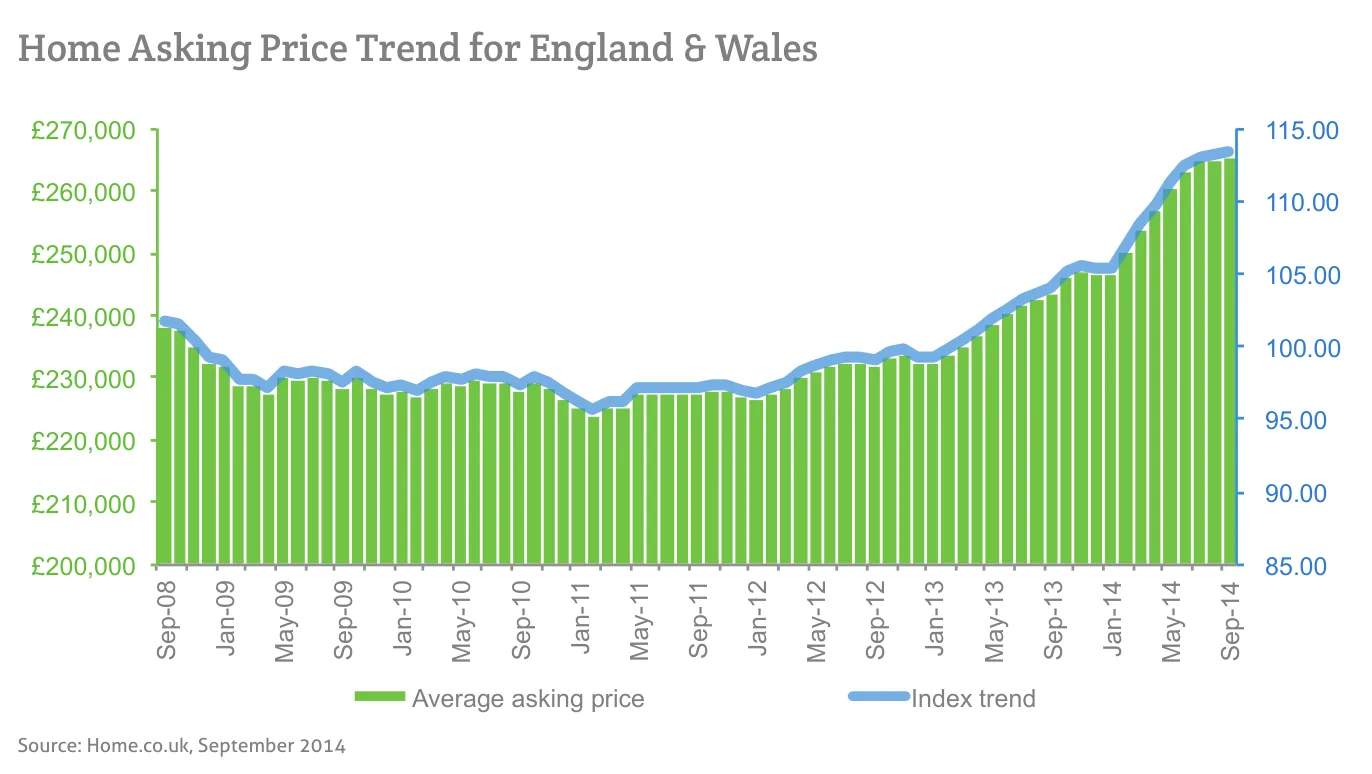
Source: Home.co.uk, September 2014
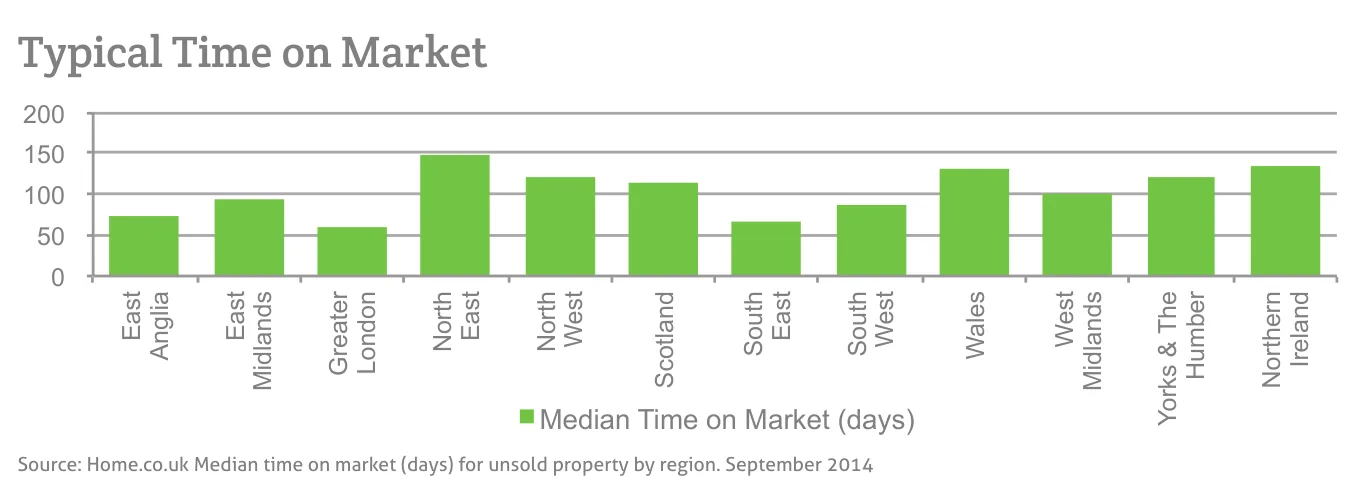
Source: Home.co.uk Median time on market (days) for unsold property by region. September 2014
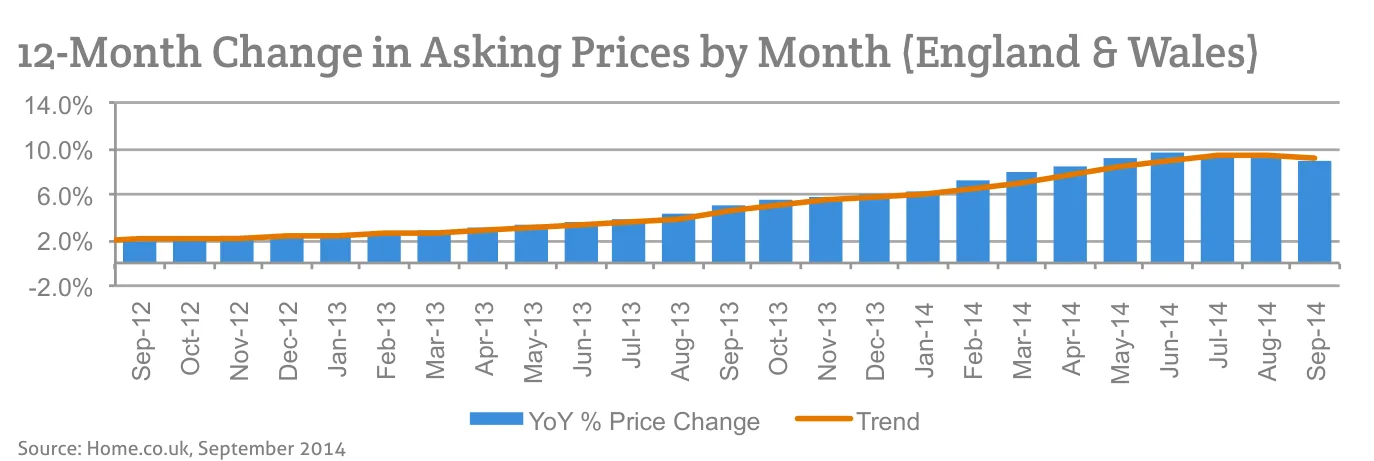
Source: Home.co.uk, September 2014
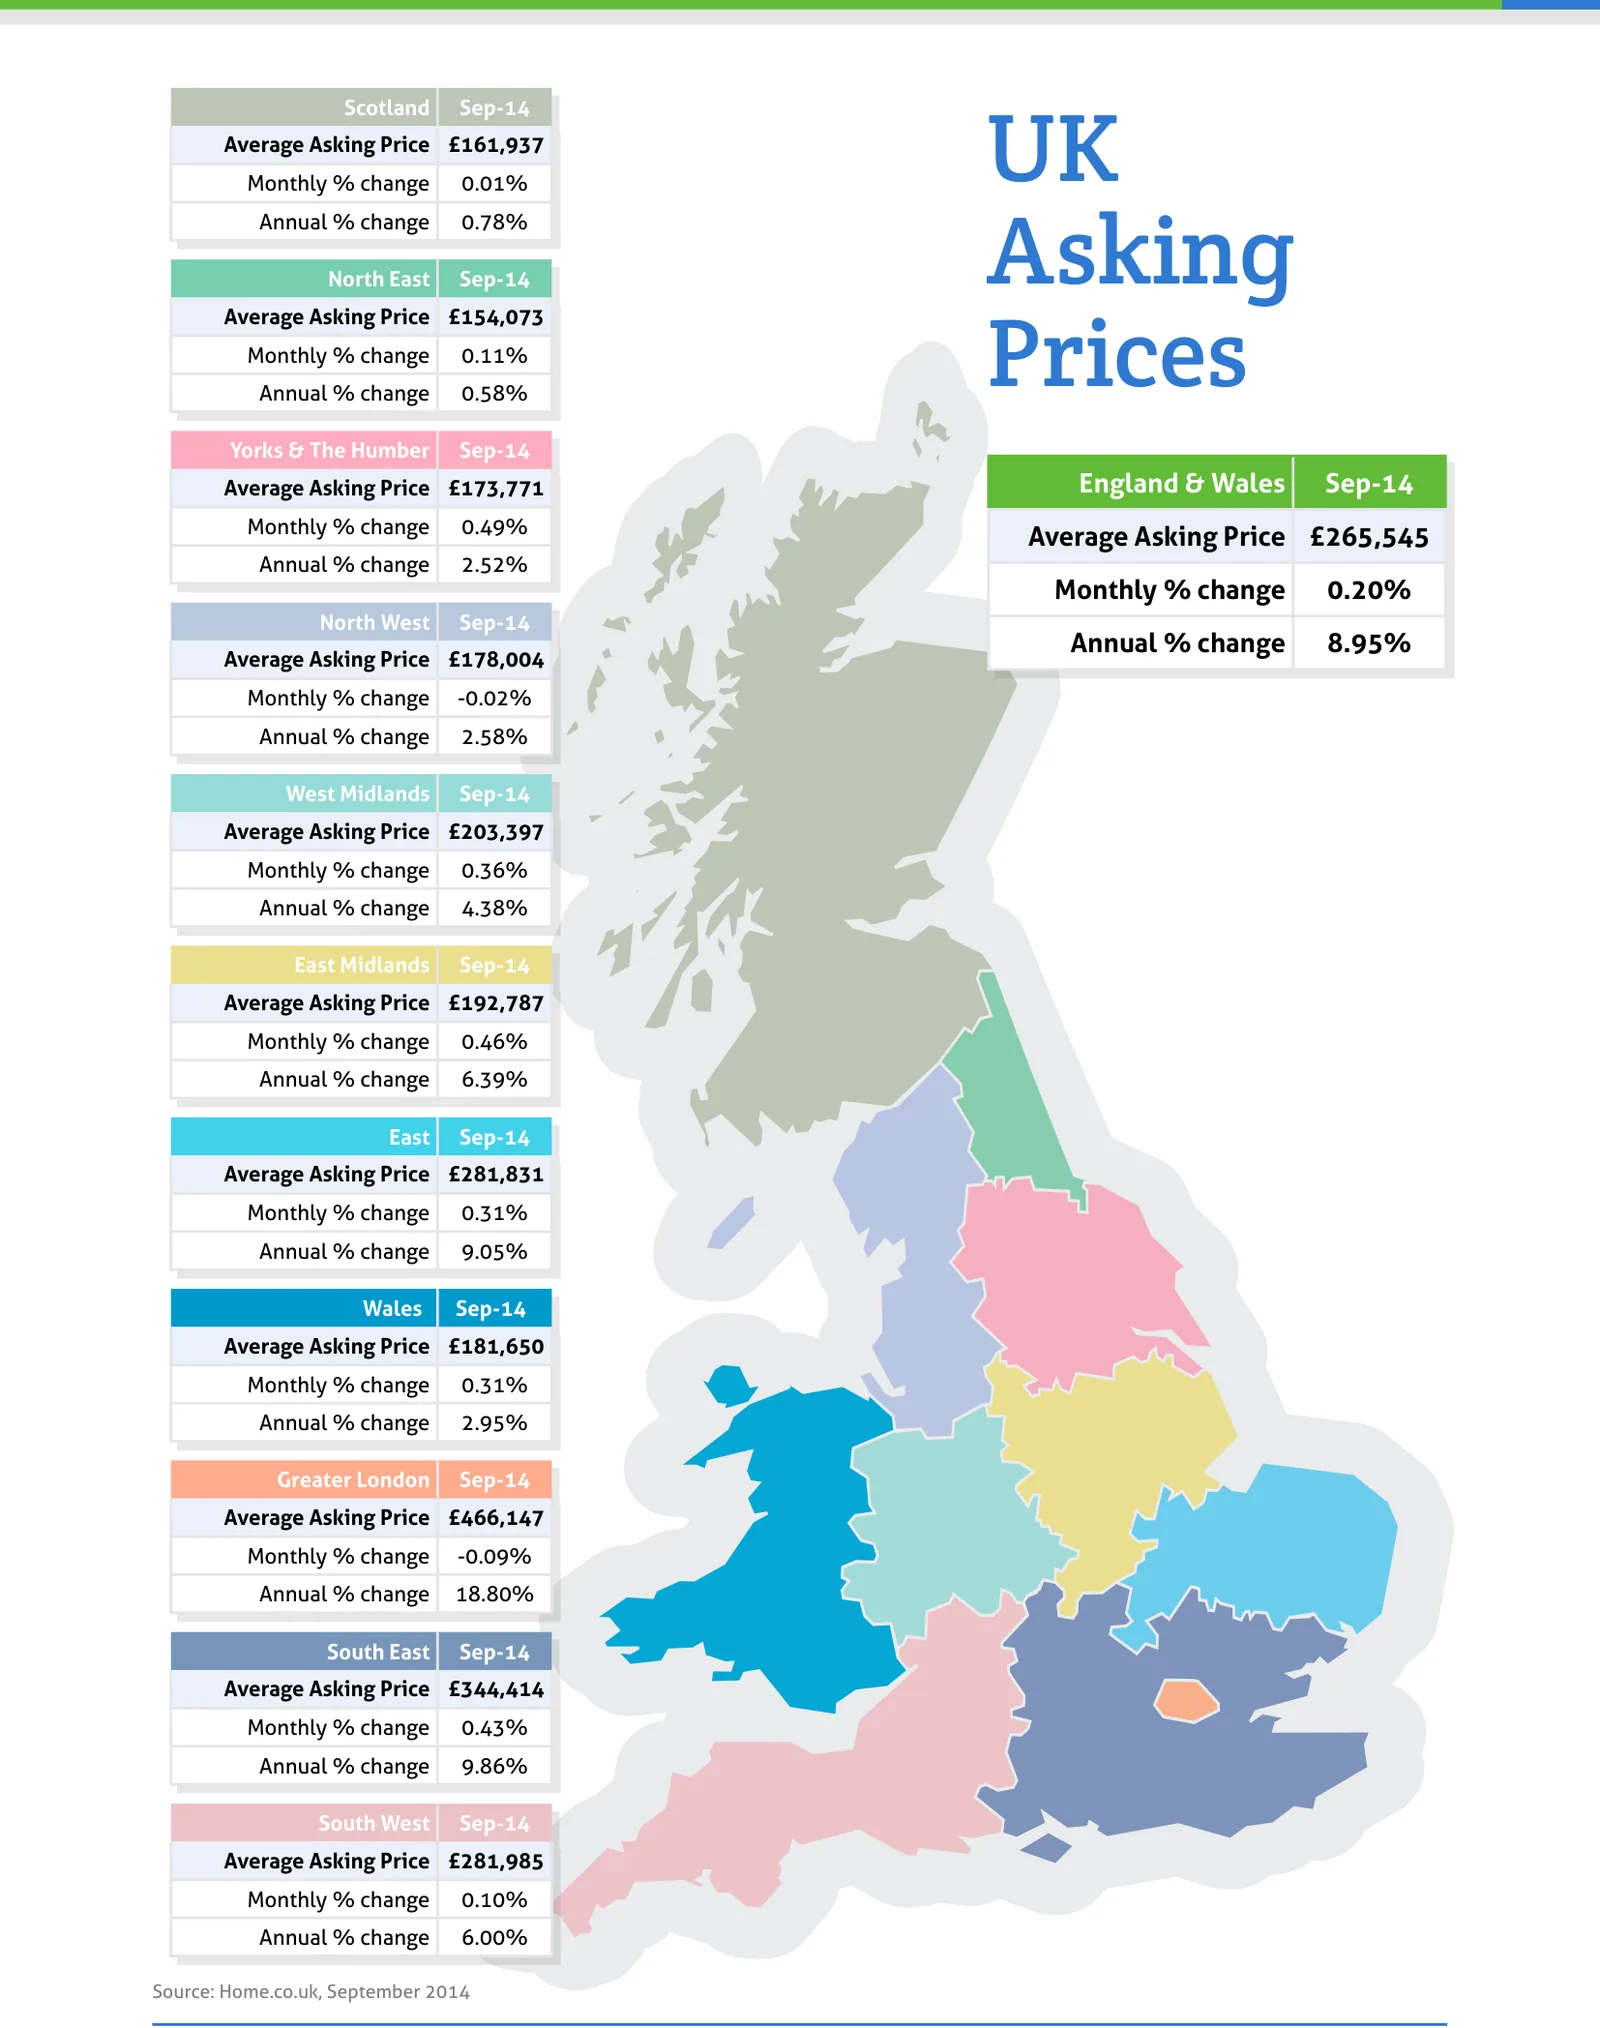
Source: Home.co.uk, September 2014
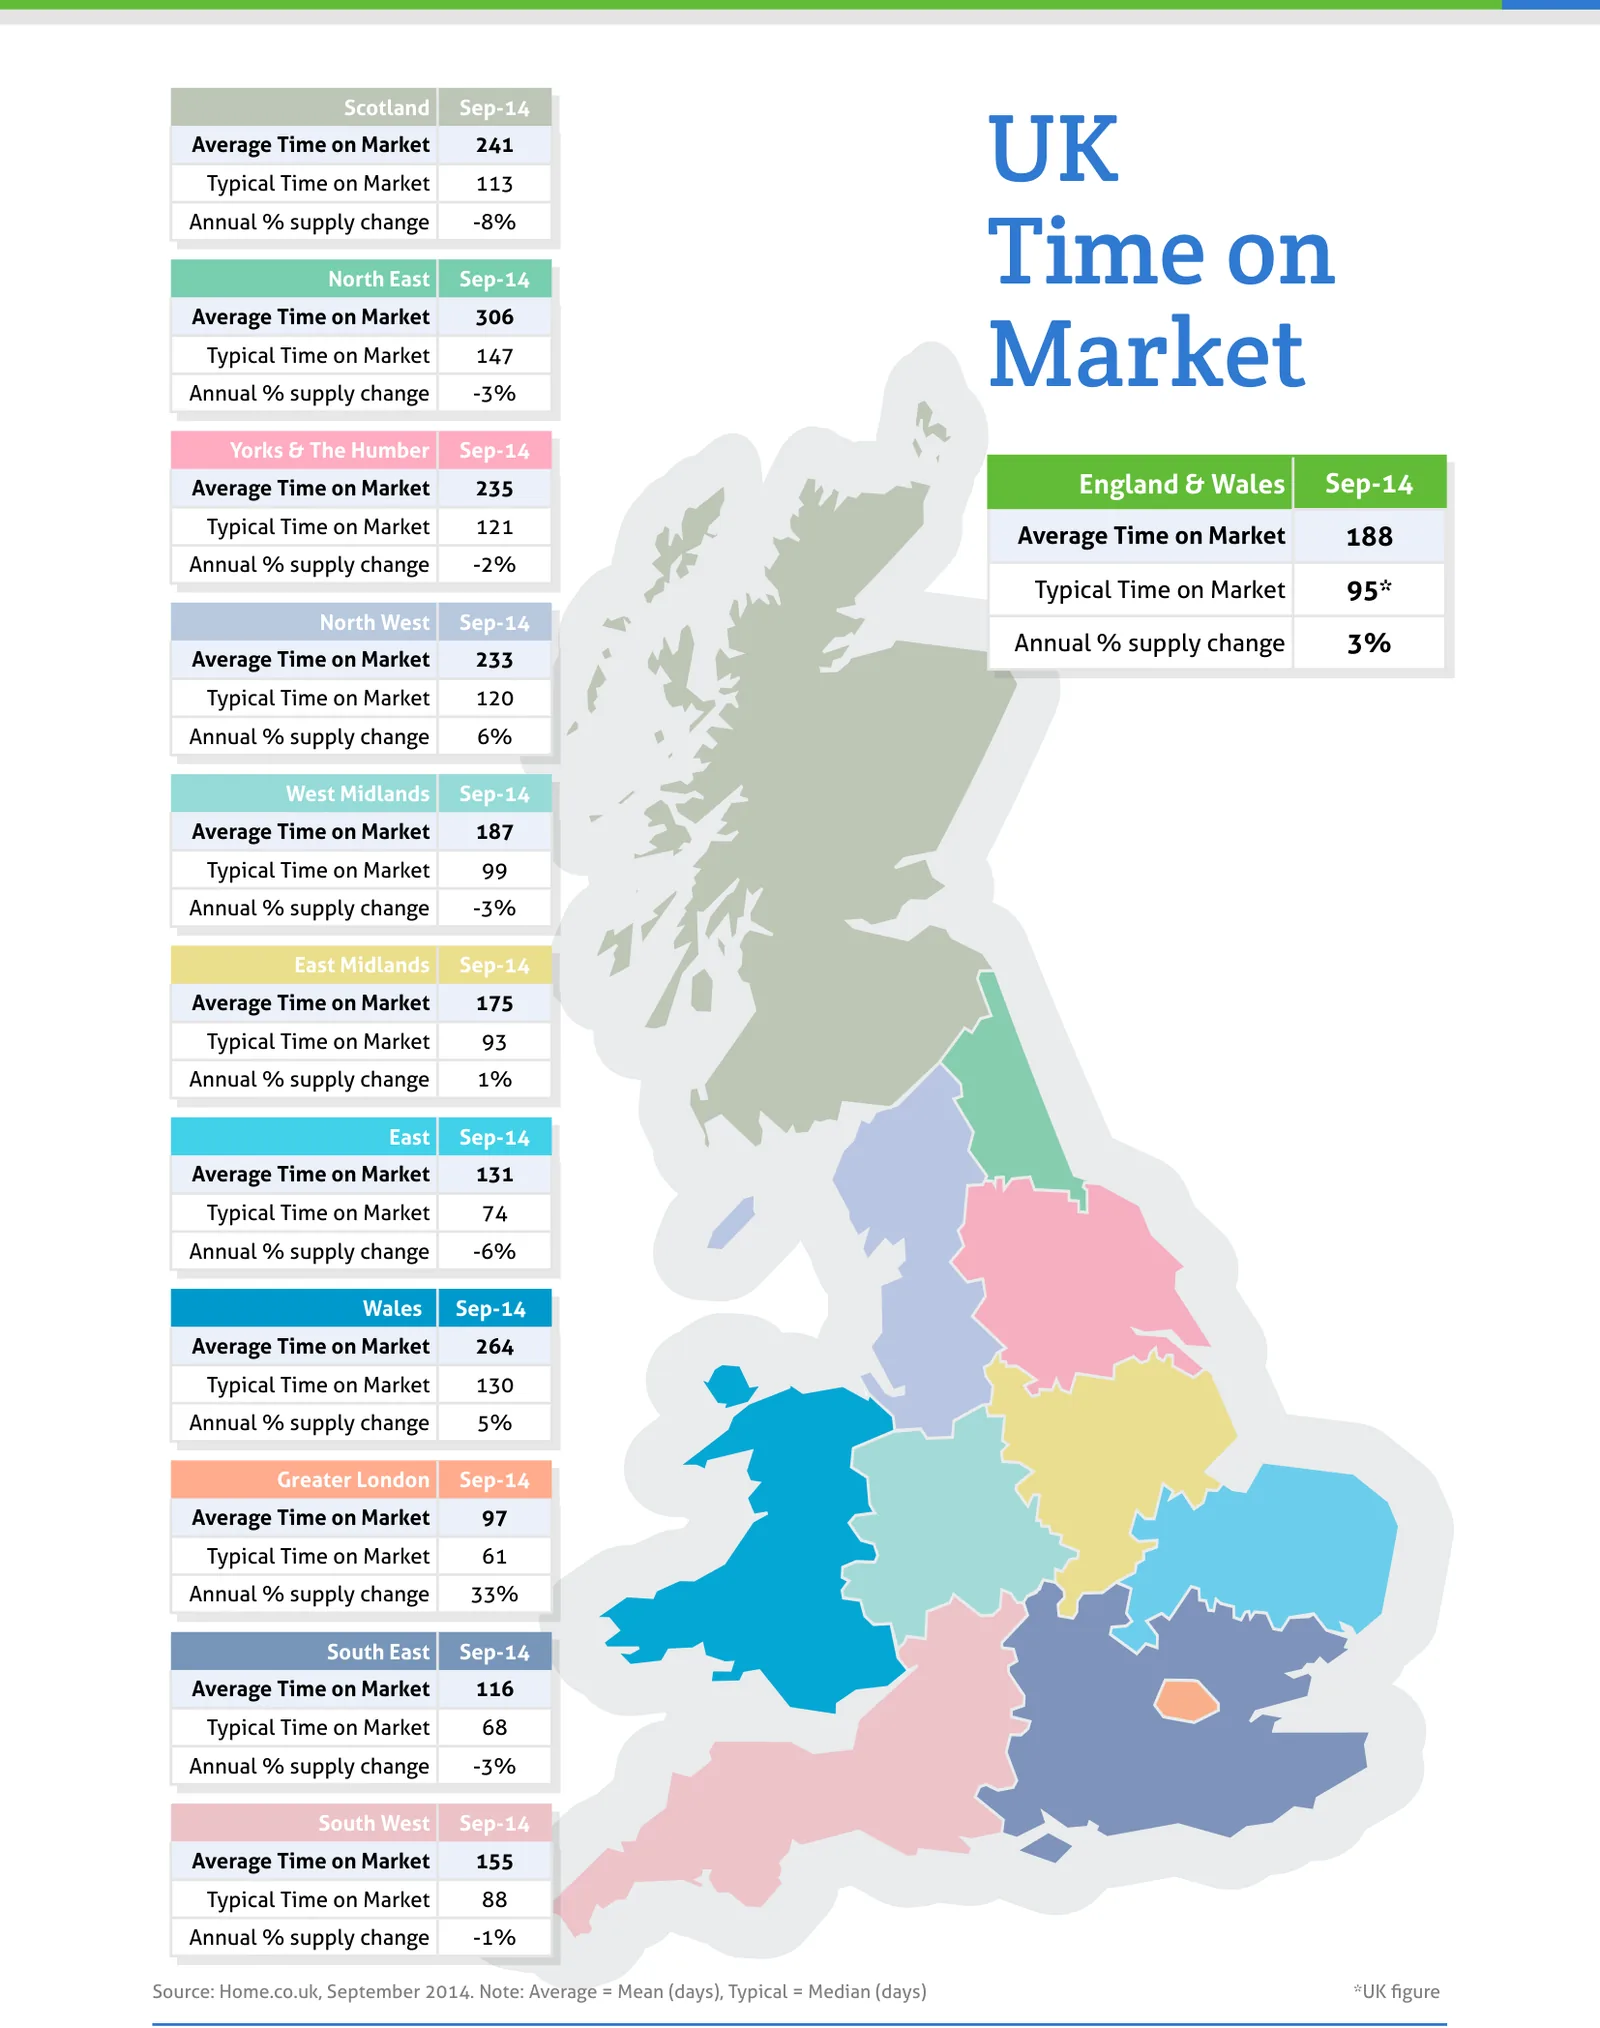
Source: Home.co.uk, September 2014. Note: Average = Mean (days), Typical = Median (days)
Regional tables
annual gross rent of 2-bedroom properties for
| Average Price | Average Price | Average PCM | % Change In Average Sales | Gross Rental | Real % Yield Aug | |
|---|---|---|---|---|---|---|
| Location | Aug 2014 | Aug 2013 | Rent Aug 2014 | Price vs. Aug 13 | Yield | 2014 |
| Stratford | £354,768 | £244,769 | £1,594 | 44.9% | 5.4% | 50.3 |
| West Norwood | £383,950 | £266,226 | £1,343 | 44.2% | 4.2% | 48.4 |
| Stepney | £536,166 | £378,582 | £2,100 | 41.6% | 4.7% | 46.3 |
| Canning Town | £486,957 | £353,414 | £1,920 | 37.8% | 4.7% | 42.5 |
| Leyton | £333,549 | £243,393 | £1,440 | 37.0% | 5.2% | 42.2 |
| Crystal Palace | £347,035 | £252,175 | £1,265 | 37.6% | 4.4% | 42.0 |
| Streatham | £413,300 | £302,691 | £1,469 | 36.5% | 4.3% | 40.8 |
| Stockwell | £861,775 | £632,117 | £2,077 | 36.3% | 2.9% | 39.2 |
| East Acton | £509,961 | £378,013 | £1,646 | 34.9% | 3.9% | 38.8 |
| West Ham | £281,939 | £213,010 | £1,423 | 32.4% | 6.1% | 38.4 |
sale and rent.
UK Asking Prices, Sep-14
| Region | Average Asking Price | Monthly % change | Annual % change |
|---|---|---|---|
| Scotland | £161,937 | 0.01% | 0.78% |
| North East | £154,073 | 0.11% | 0.58% |
| Yorks & The Humber | £173,771 | 0.49% | 2.52% |
| England & Wales | £265,545 | 0.20% | 8.95% |
| North West | £178,004 | -0.02% | 2.58% |
| West Midlands | £203,397 | 0.36% | 4.38% |
| East Midlands | £192,787 | 0.46% | 6.39% |
| East | £281,831 | 0.31% | 9.05% |
| Wales | £181,650 | 0.31% | 2.95% |
| Greater London | £466,147 | -0.09% | 18.80% |
| South East | £344,414 | 0.43% | 9.86% |
| South West | £281,985 | 0.10% | 6.00% |
UK Time on Market, Sep-14
| Region | Average Time on Market | Typical Time on Market | Annual % supply change |
|---|---|---|---|
| Scotland | 241 | 113 | -8% |
| North East | 306 | 147 | -3% |
| Yorks & The Humber | 235 | 121 | -2% |
| England & Wales | 188 | 95* | 3% |
| North West | 233 | 120 | 6% |
| West Midlands | 187 | 99 | -3% |
| East Midlands | 175 | 93 | 1% |
| East | 131 | 74 | -6% |
| Wales | 264 | 130 | 5% |
| Greater London | 97 | 61 | 33% |
| South East | 116 | 68 | -3% |
| South West | 155 | 88 | -1% |
From the director's commentary
"Sky-high prices are tempting more potential vendors to commit in London, but supply levels are still very low historically and unlikely to cause significant price falls. In addition, once the London market has paused for breath, we may well see a further strong price rally next year."
Doug Shephard, Director at Home.co.uk
Read the full September 2014 edition (PDF, 6 pages)
About the Home Asking Price Index
The Home Asking Price Index measures the change in the prices sellers ask for residential property across England, Wales and Scotland. Today it is computed every month from around half a million advertised homes and is mix-adjusted, so a change in what happens to be on the market does not move the figure; earlier editions state the sample they were built from. Because an asking price is set months before a sale completes, the index runs around five months ahead of completed-sale measures such as the UK House Price Index.
Every edition in the archive, back to October 2006, is listed on the index page. How we measure the UK property market explains the listing data behind it, and today's figures by area are on house prices and rental prices.
Text and figures above are quoted from the September 2014 edition as published, with punctuation normalised for the web, and are not revised. Later editions may restate them.
More in What is happening to house prices: the Home guide
Thinking about your next move?
See what your home's worth in seconds, with the UK's longest-running property data behind it.
Get an instant valuation