

























Home Asking Price Index, September 2012: prices fall as reality bites back
England and Wales asking prices rose 2.0% annually but average time on market climbed to 215 days as supply fell 7.6% year on year.

This is the September 2012 edition of the Home Asking Price Index, released on 12 September 2012, under the headline:
Prices Fall as Reality Bites Back
The headlines and summary below are the report's own words, with the key figures as it published them, followed by the report's charts and regional tables as printed.
Headlines
- Asking prices for homes on the market in England and Wales retreat from euphoric summer highs, as the stark reality of the UK's economic woes and rising mortgage costs brings sobriety to the market.
- Asking prices fell in 8 of the 9 English regions and Wales over the last month.
- Supply to market of properties for sale down 7.6% year-on-year.
- Time on Market (average) climbs to 215 days.
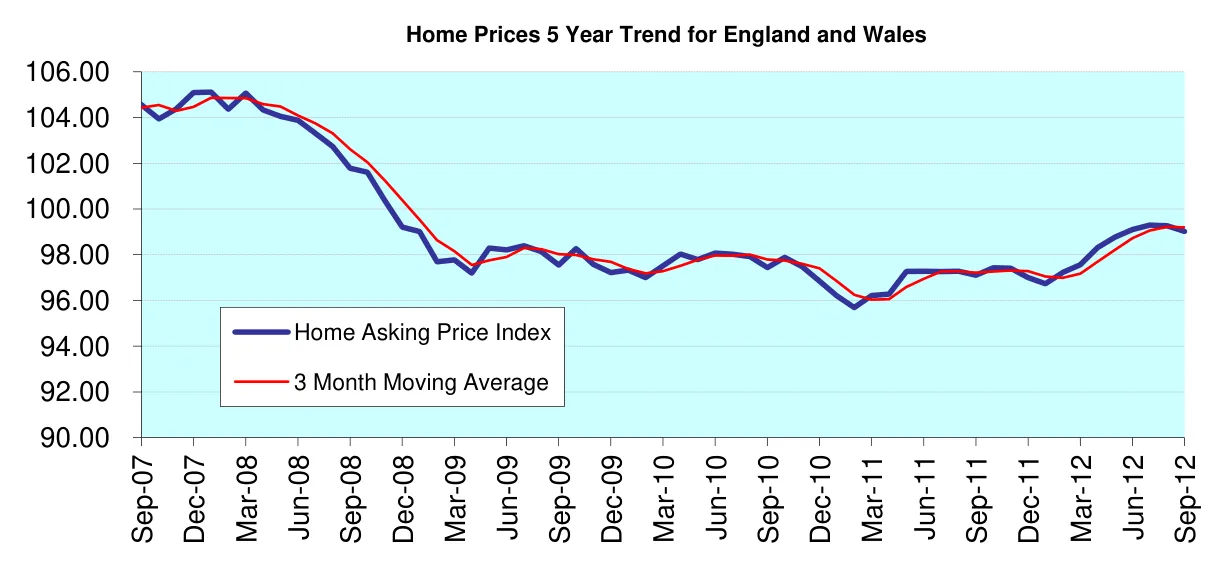
- Annual change in asking prices: +2.0%
- 6-month change: +1.5%
Summary
The UK property market steps down a gear after the summer highs. Price falls across most regions and London reflect the continued poor economic outlook and the increasing costs of mortgages. However, price falls may be slight over the coming months as supply of property for sale is down 7% across the UK. Hardest hit by the supply shortage is the North West which is down 15% year-on-year.
Greater London, the South West and the South East continue to enjoy the lowest marketing times in the UK, whilst more northern regional property markets suffer the longest. Moreover, looking at further market segmentation by home type, detached properties continue to show the greatest price resilience and the average price for this dwelling type is now on a par with the previous highs set in 2007. Terraced and flat dwellings, on the other hand continue to show year-on-year falls on average across the UK.
Key figures
| Measure | Figure |
|---|---|
| England & Wales average asking price | £231,832 |
| Annual change in asking prices | +2.0% |
| 6-month change in asking prices | +1.5% |
| Supply to market year-on-year change | -7.6% |
| Average Time on Market | 215 days |
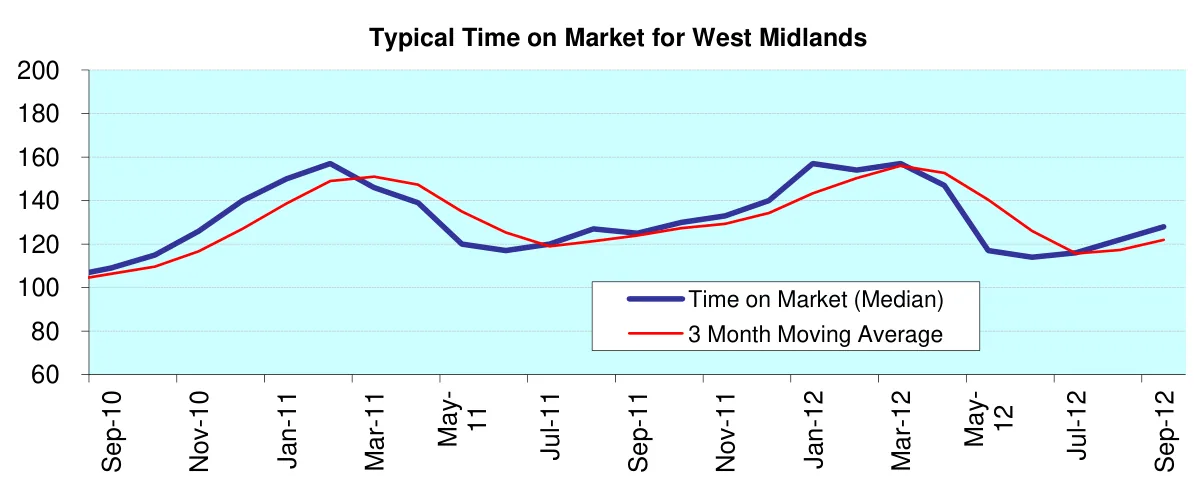
| Typical (median) Time on Market | 121 days |
| HAPI index (England & Wales) | 99.0 |
Figures are for England and Wales unless the report states otherwise, as published in the edition.
Charts from the report
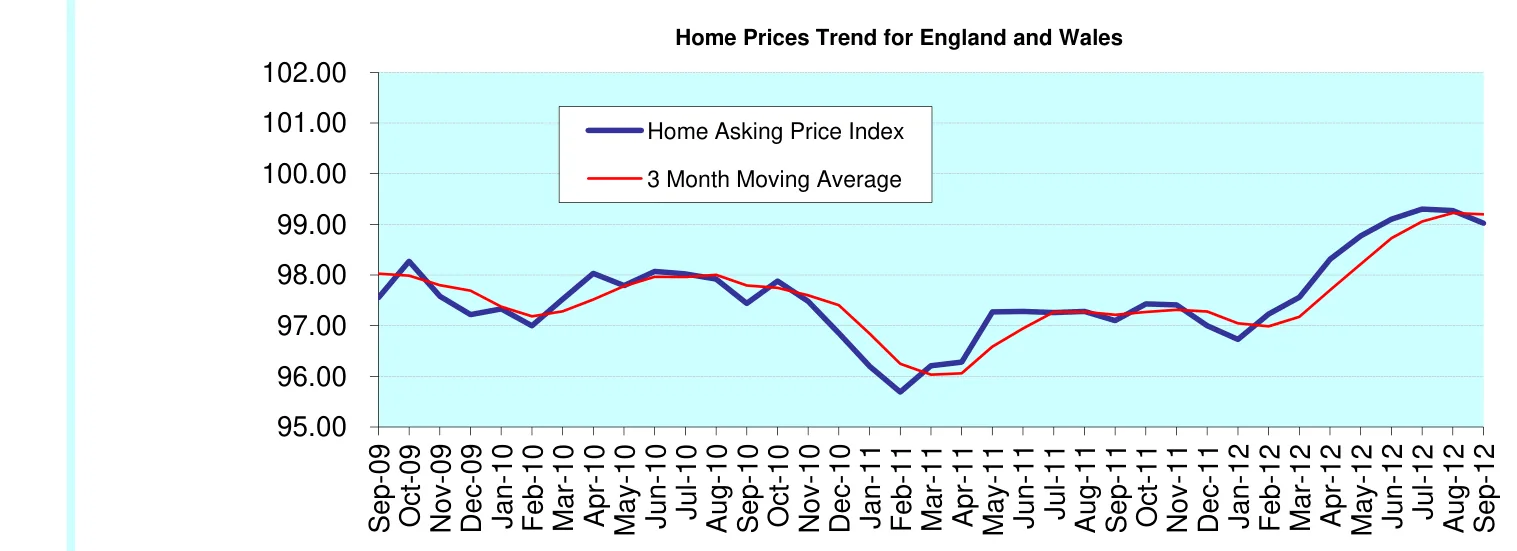
Laspeyres Index based on Weighted Arithmetic Mean of Weighted Arithmetic Mean of Regional House Prices. [May04 = 100]
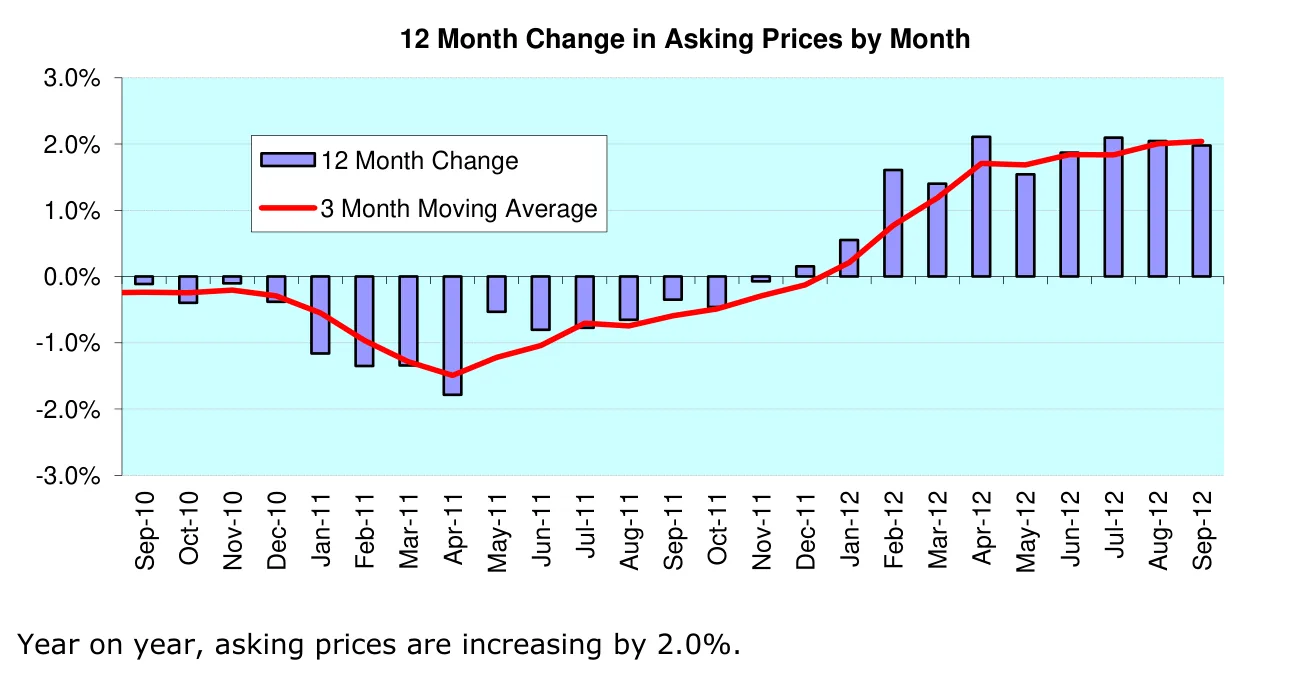
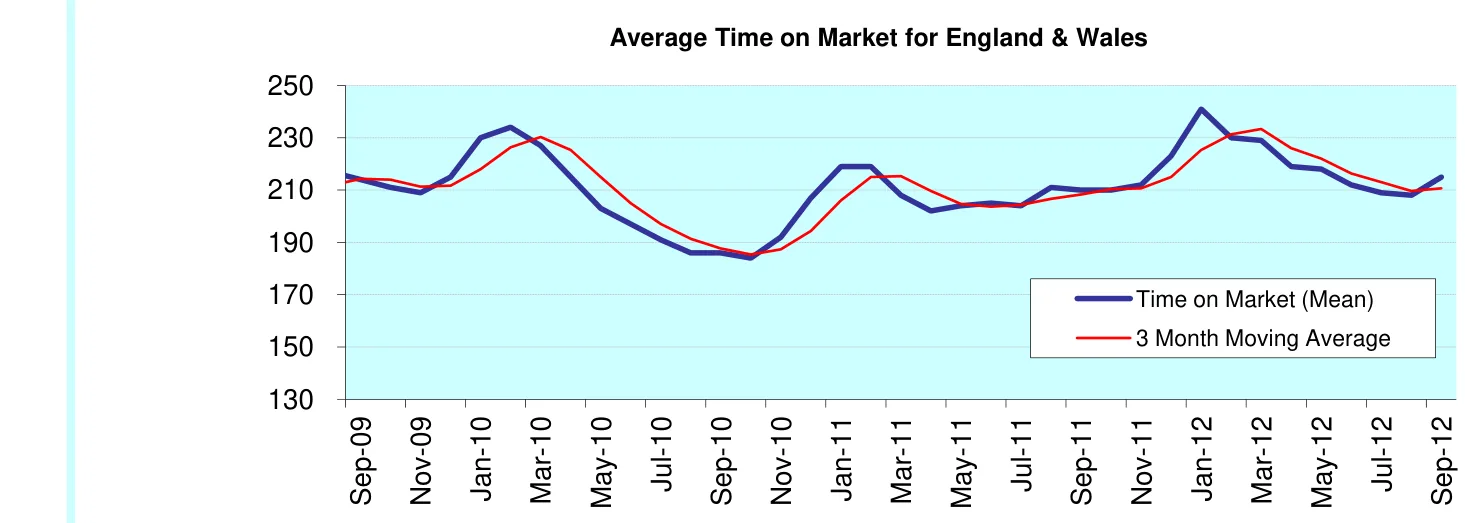
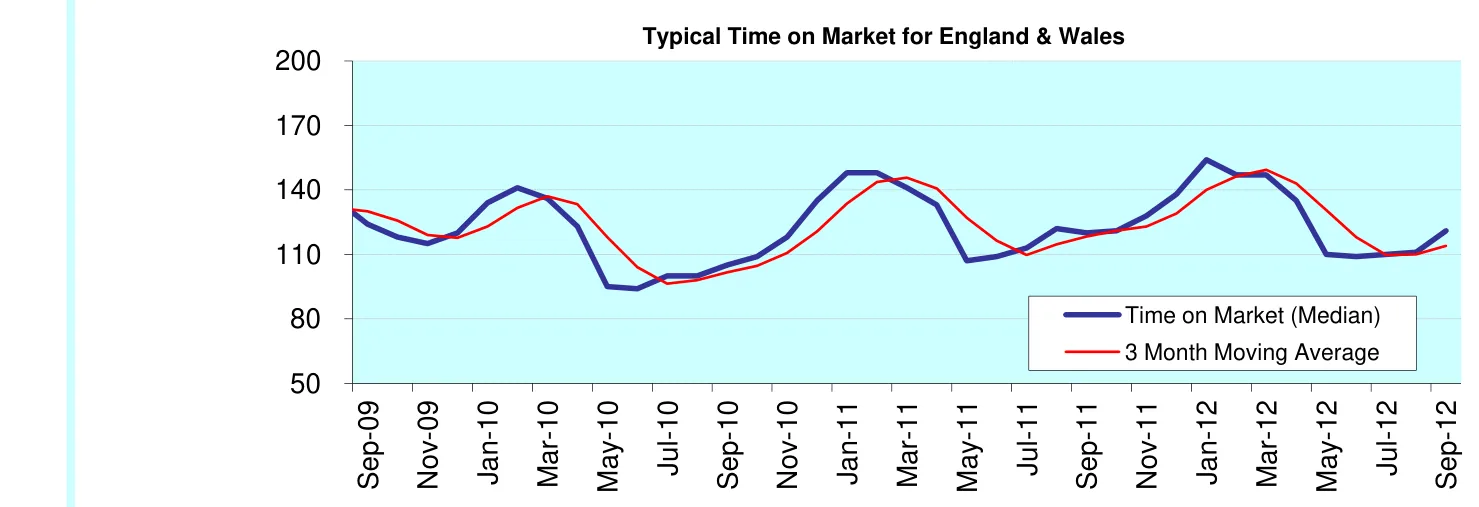
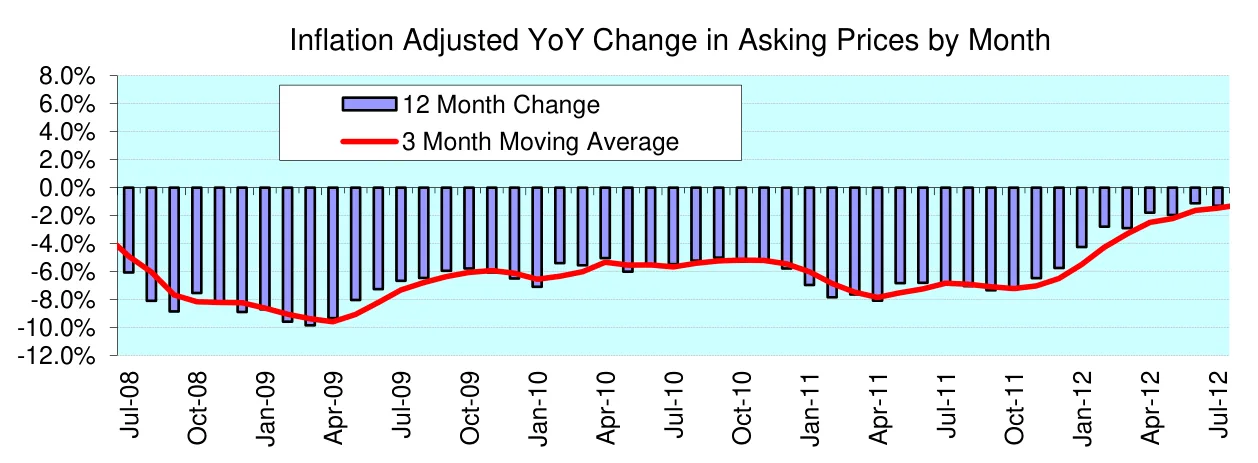
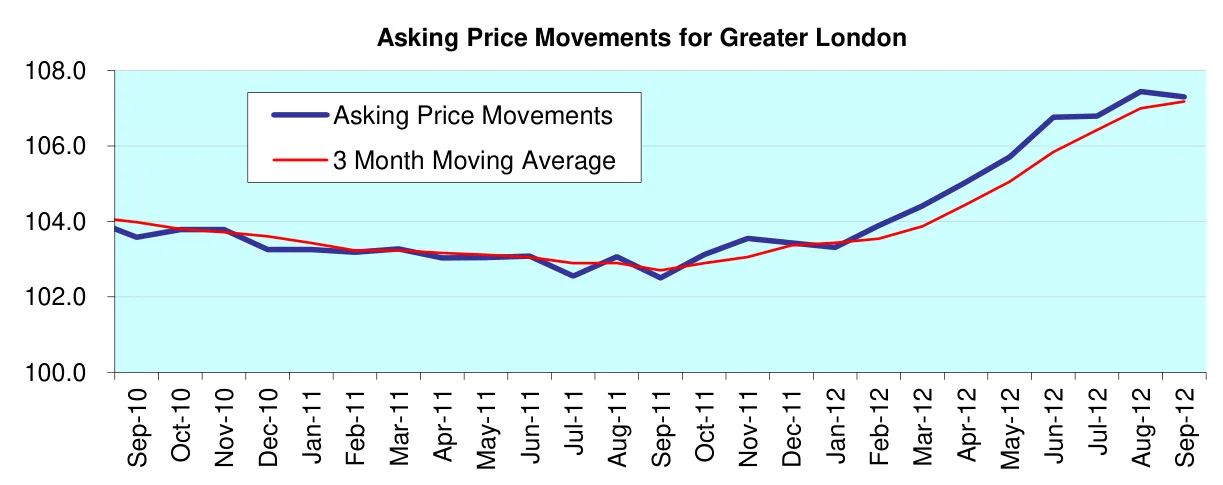
Laspeyres Indices based on Weighted Arithmetic Mean of Regional House Prices [May04 = 100]
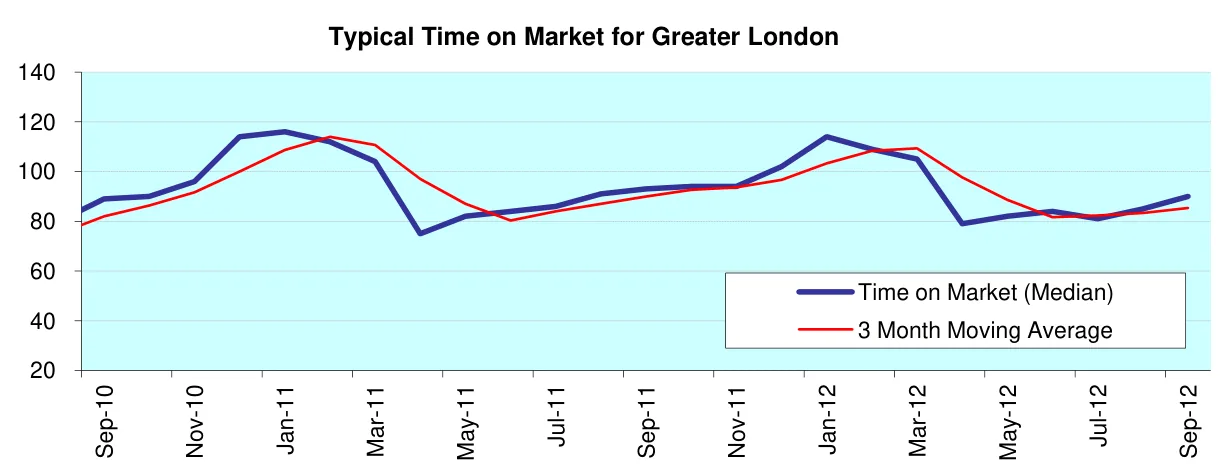
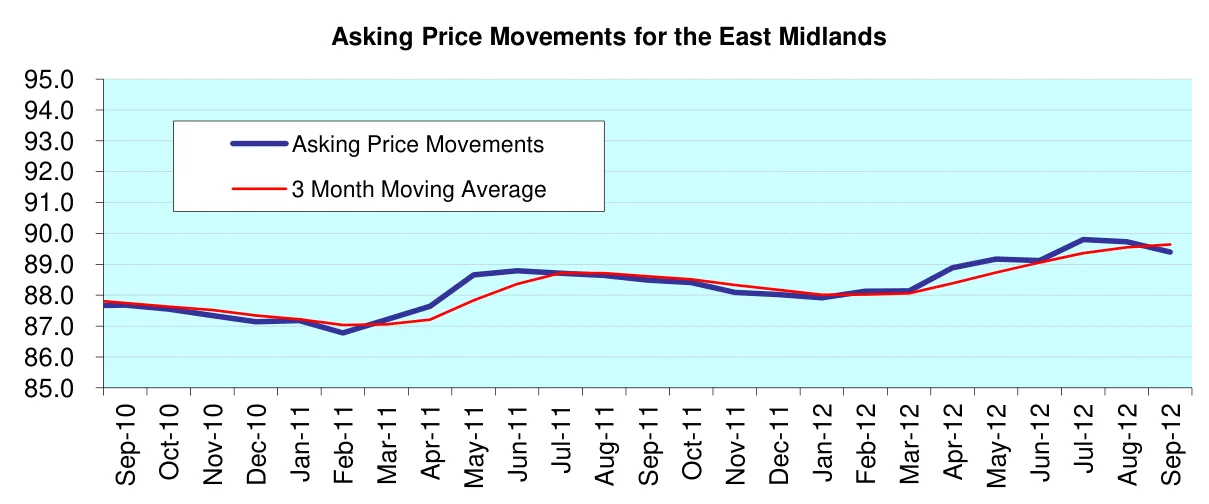
Laspeyres Index based on Weighted Arithmetic Mean of Regional House Prices [May04 = 100]
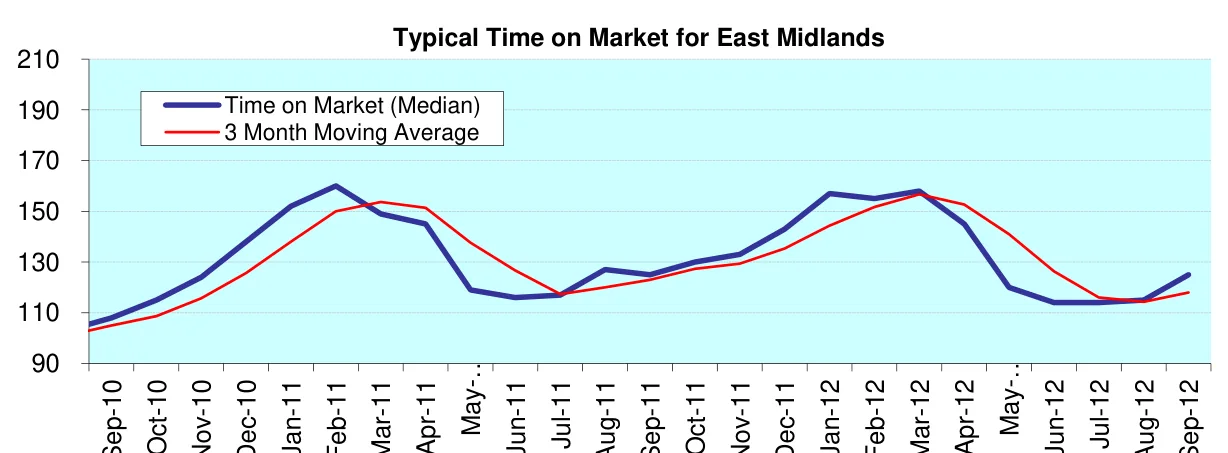
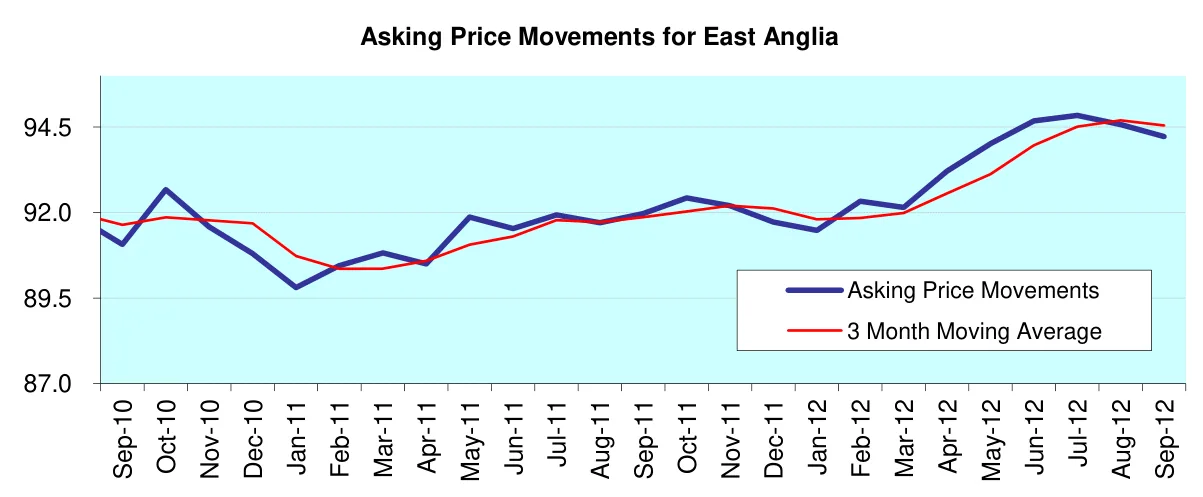
Laspeyres Index based on Weighted Arithmetic Mean of Regional House Prices [May04 = 100]
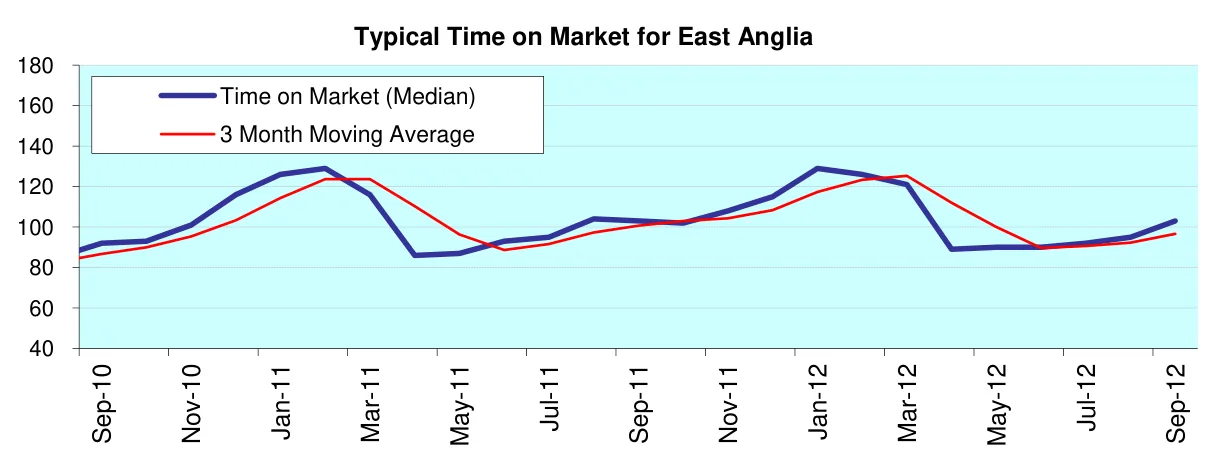
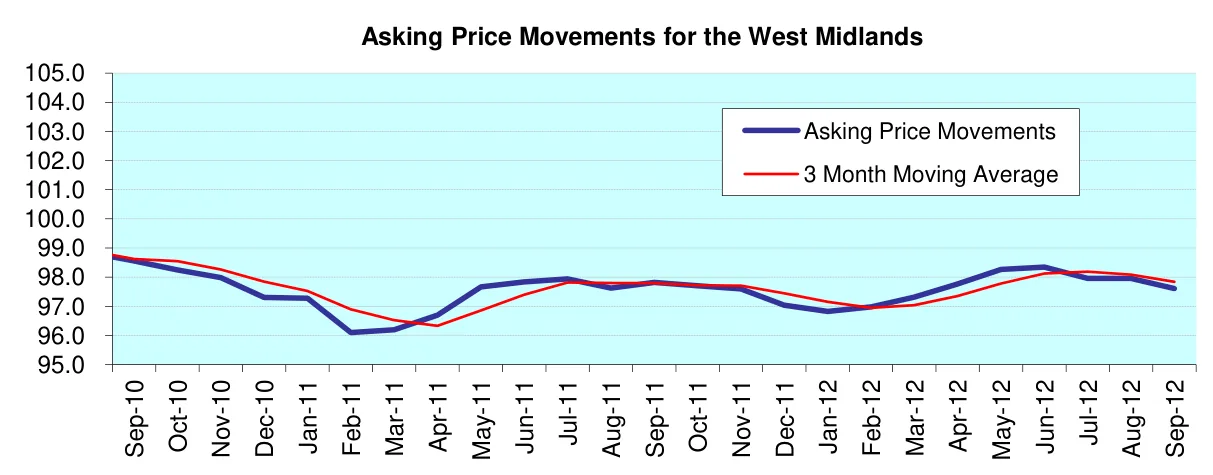
Laspeyres Index based on Weighted Arithmetic Mean of Regional House Prices [May04 = 100]
Source: HM Land Registry
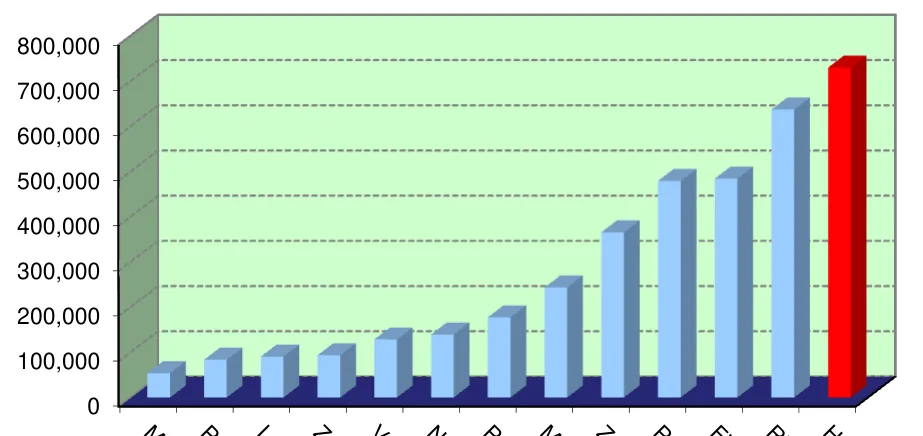
Regional tables
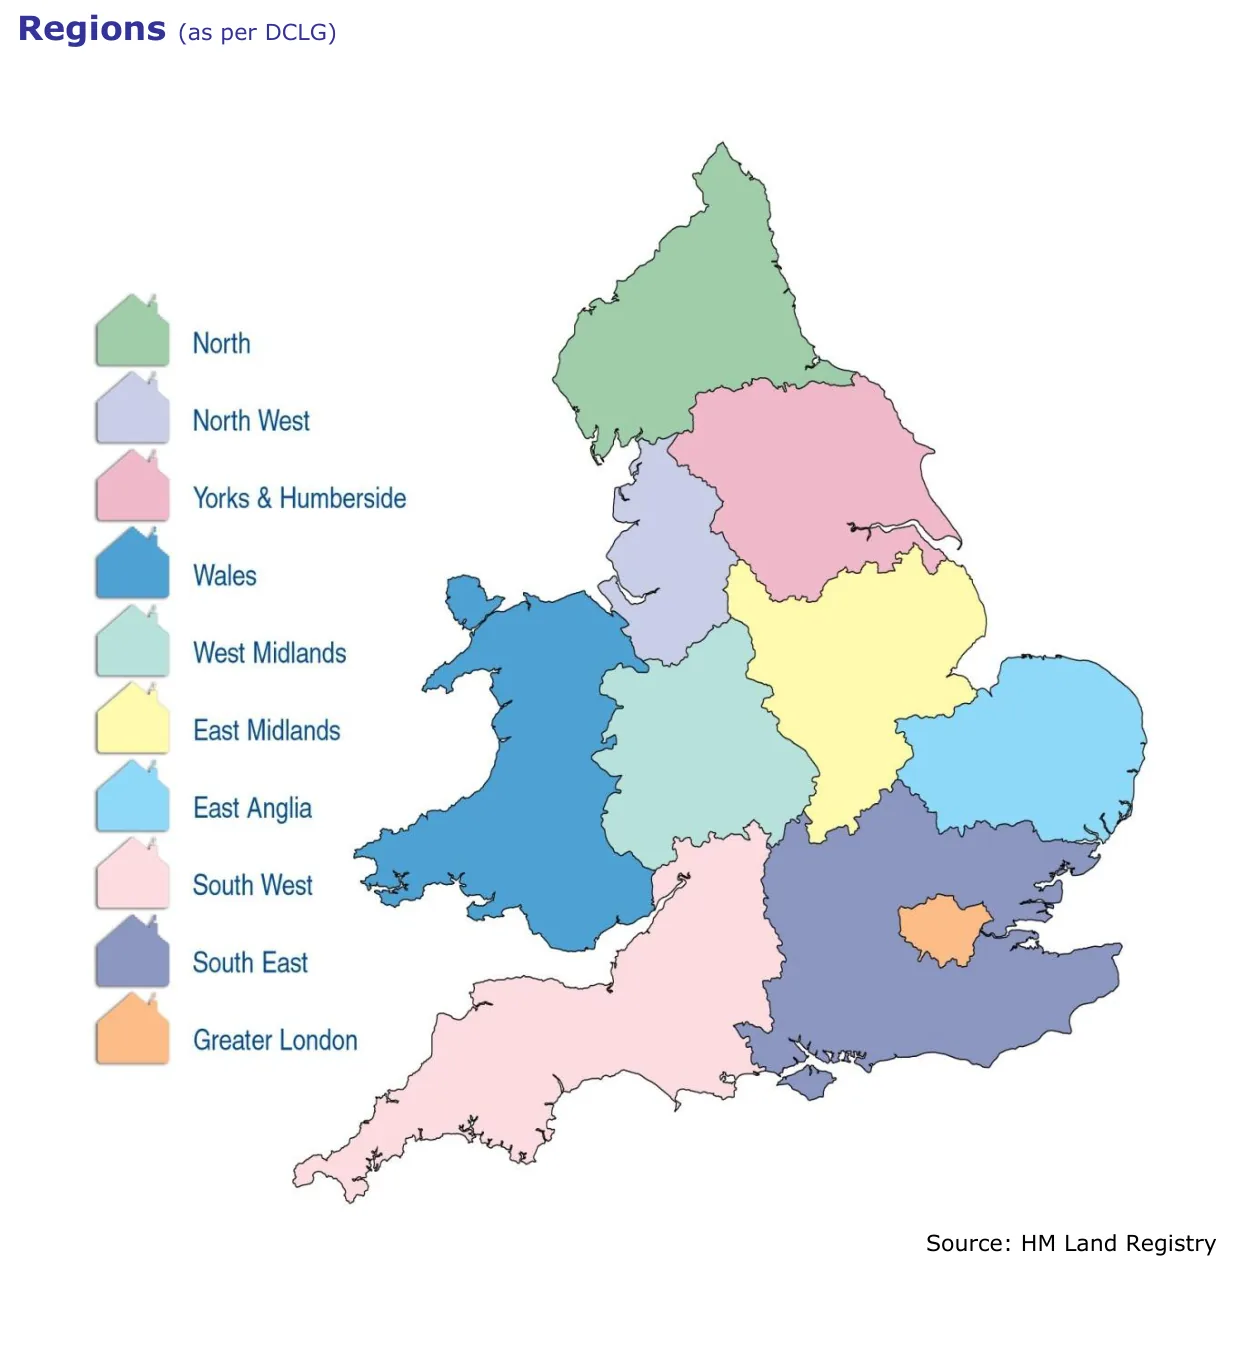
Regional asking prices for September 2012, showing gains and losses since June 2012 and current
| Current average price | Q3 change | Median ToM (days) | |
|---|---|---|---|
| South West | £254,664 | +0.7% | 107 |
| Greater London | £354,975 | +0.5% | 90 |
| East Midlands | £174,640 | +0.3% | 125 |
| Wales | £173,697 | +0.3% | 157 |
| Scotland | £160,218 | 0.0% | 133 |
| North East | £152,359 | -0.2% | 182 |
| South East | £294,270 | -0.4% | 92 |
| Yorkshire and Humber | £167,558 | -0.4% | 154 |
| East Anglia | £248,244 | -0.5% | 103 |
| North West | £172,885 | -0.6% | 147 |
| West Midlands | £187,757 | -0.8% | 128 |
| England & Wales | £231,832 | +2.1% | 121 |
typical time on market.
Read the full September 2012 edition (PDF, 13 pages)
About the Home Asking Price Index
The Home Asking Price Index measures the change in the prices sellers ask for residential property across England, Wales and Scotland. Today it is computed every month from around half a million advertised homes and is mix-adjusted, so a change in what happens to be on the market does not move the figure; earlier editions state the sample they were built from. Because an asking price is set months before a sale completes, the index runs around five months ahead of completed-sale measures such as the UK House Price Index.
Every edition in the archive, back to October 2006, is listed on the index page. How we measure the UK property market explains the listing data behind it, and today's figures by area are on house prices and rental prices.
Text and figures above are quoted from the September 2012 edition as published, with punctuation normalised for the web, and are not revised. Later editions may restate them.
More in What is happening to house prices: the Home guide
Thinking about your next move?
See what your home's worth in seconds, with the UK's longest-running property data behind it.
Get an instant valuation