

























Home Asking Price Index, October 2025: oversupply weighs heavy on Southern prices
Asking prices in England and Wales rose just 0.1% in September, leaving annual growth at only 0.6% amid record unsold stock and falling rents.

This is the October 2025 edition of the Home Asking Price Index, released on 15 October 2025, under the headline:
Oversupply Weighs Heavy on Southern Prices
The headlines and summary below are the report's own words, with the key figures as it published them, followed by the report's charts and regional tables as printed.
Headlines
- The mix-adjusted average asking price for England and Wales edged up by the smallest of margins during September (0.1%), making the annualised growth figure a mere 0.6%. Scotland and the South West indicated the largest price falls.
- Annualised home price growth across England and Wales continues to be well below the level of inflation at just 0.6% overall. We estimate that overall real growth currently stands at around -4.4%. Even the best-performing regions are being outpaced by the current rate of inflation (RPI ex-housing).
- The unsold sales stock count for England and Wales is at its highest level since October 2013. Oversupply has created a buyer's market in most regions.
- Vendor hesitancy in an increasingly difficult market triggered a drop in supply of new sales properties during September. There were 11% fewer properties entering the market this year than in September 2024.
- Yorkshire is now the top regional property market growth leader with a year-on-year gain of 3.6%, overtaking the North West where growth has slipped to 3.1%. Meanwhile, the South West is now the worst regional performer with a painful annualised loss of 1.0%, narrowly outpacing London's annualised decline of 0.8%.
- Sales market momentum remains elevated compared to previous years. To date, this greater throughput has not been sufficient to significantly reduce the unsold stock total. Typical Time on Market for unsold properties is currently three days higher than in October last year and continues to trend higher.
- The annualised national growth in asking rents slides yet further into the negative (now -2.9%), driven down by a vast and unexpected increase in supply (27% year-on-year). The national growth figure is in the red due mainly to the negative performance of London, but negative contributions also now come from Scotland, Wales and all English regions except the North East.
- Only 13 of the 33 London boroughs indicate positive asking rent growth and five of those are below the 1% mark. In Bexley borough, albeit a relatively small rental market in the capital region, rents are down by 7.5% year-on-year.
Summary
For the time being, pricing is weakest in London, the South West, South East and the East of England. Moreover, this slow and painful price correction, in real terms, looks set to persist until confidence picks up again.
A cut in interest rates would certainly boost demand but, given persistent above-target inflation, this possibility looks unlikely in the near term.
A number of issues are precipitating divestment from the UK property market. As a result, agents' sales portfolios are bulging at the seams as investors attempt to cash out. Higher interest rates, low or negative capital gains, increasing taxation, falling rents and adverse legislation are all factors in the decision-making process for landlords who are faced with a dilemma: do they hold on and hope or exit before the loss of earnings and control over their assets worsens?
Key figures
| Measure | Figure |
|---|---|
| Average asking price (England & Wales) | £361,900 |
| Monthly change (England & Wales) | 0.1% |
| Annual change (England & Wales) | 0.6% |
| Estimated real annual growth | -4.4% |
| Fall in new instructions (year-on-year) | -11% |
| Annual asking rent growth | -2.9% |
| Annual rental supply growth | 27% |
Figures are for England and Wales unless the report states otherwise, as published in the edition.
Charts from the report
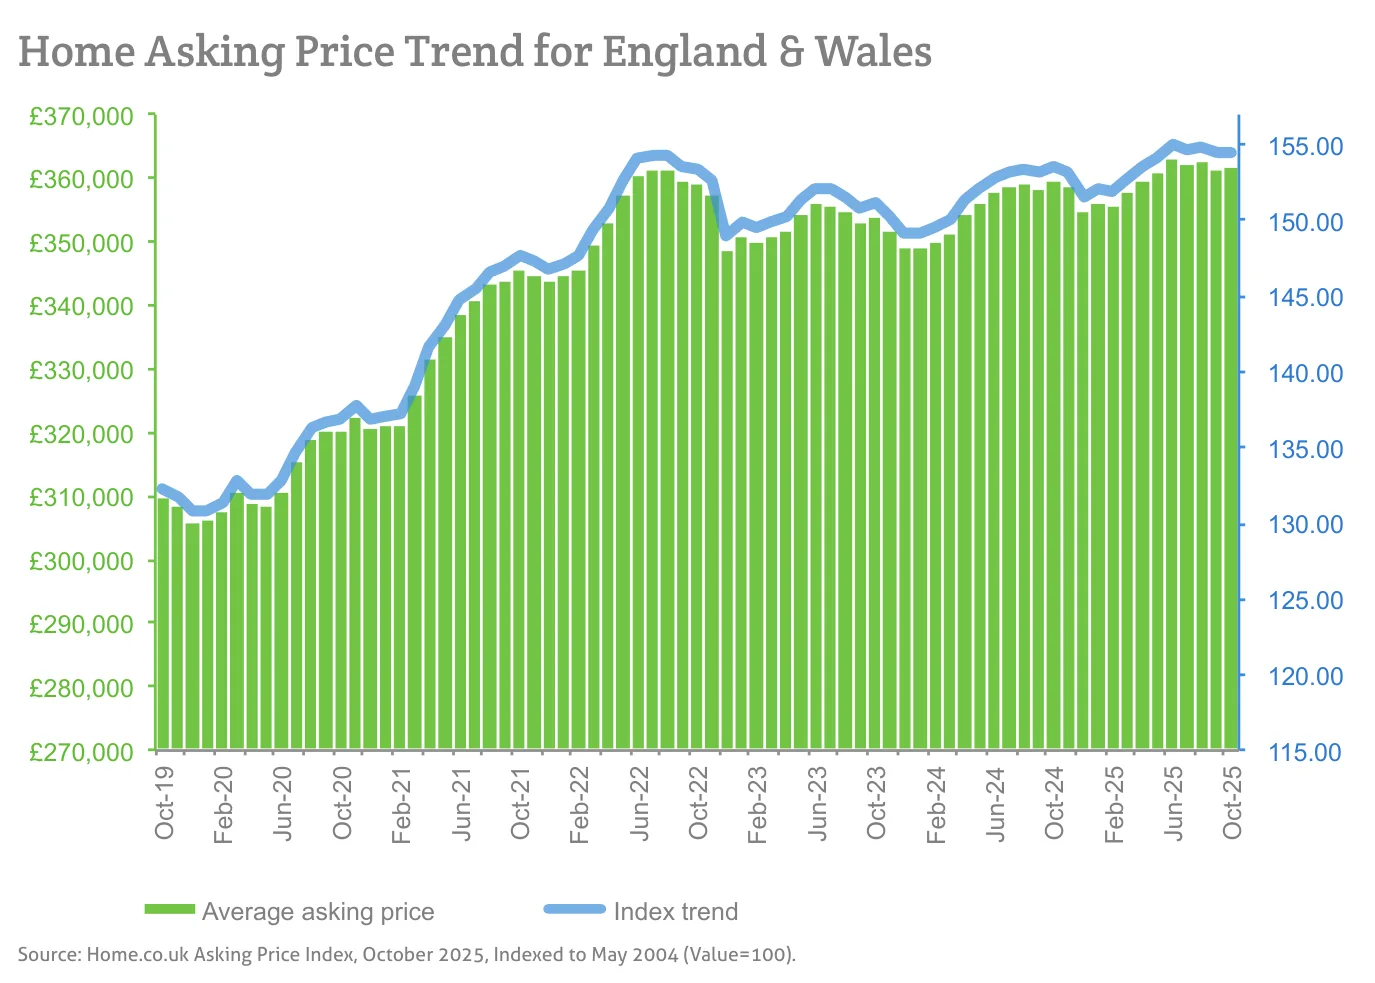
Source: Home.co.uk Asking Price Index, October 2025, Indexed to May 2004 (Value=100).
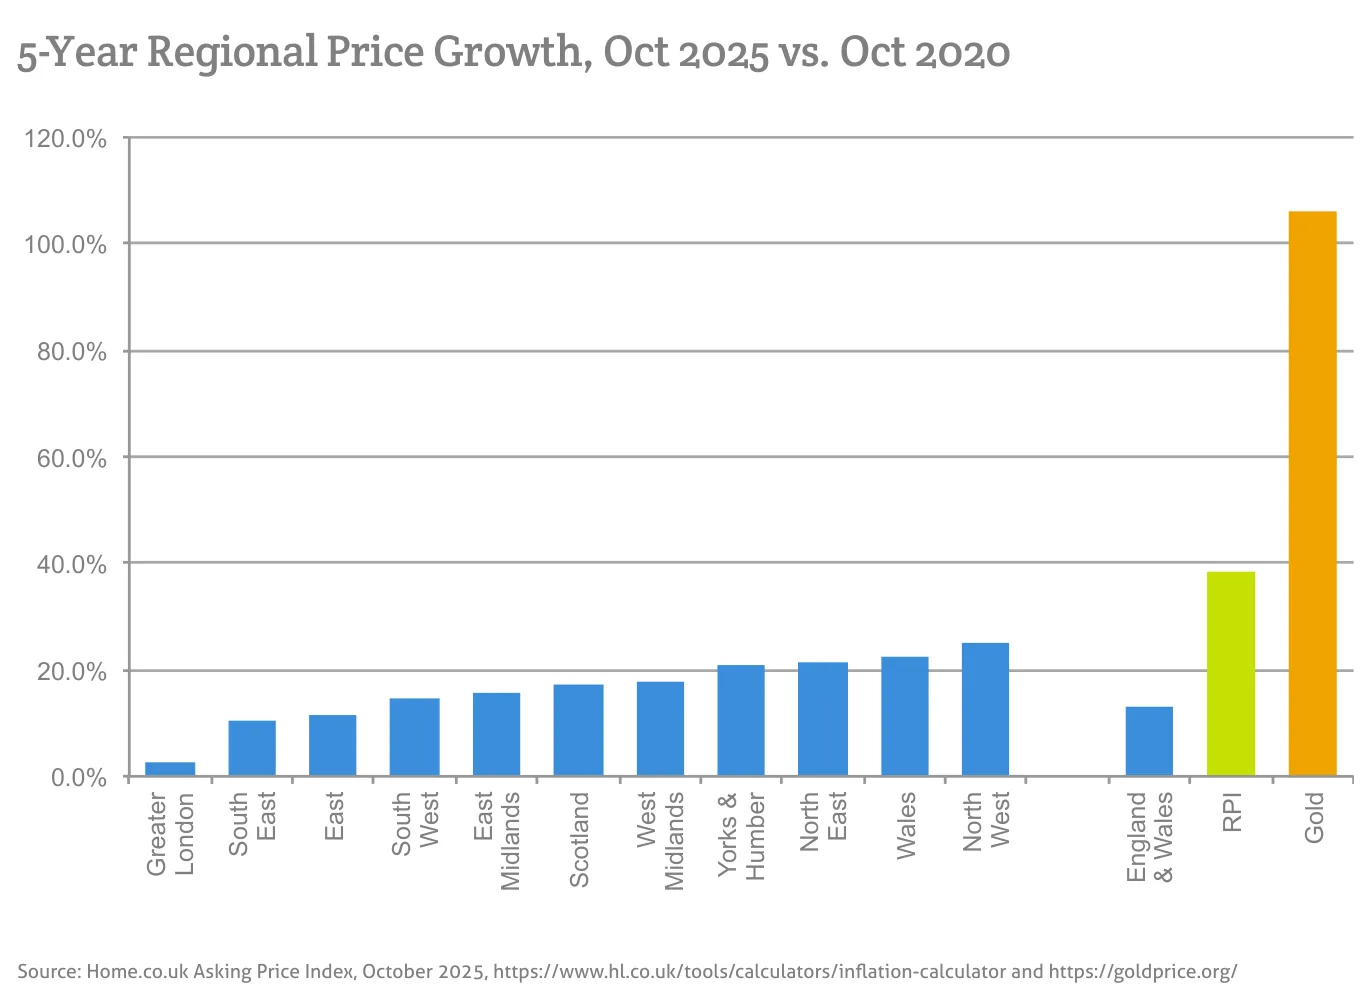
Source: Home.co.uk Asking Price Index, October 2025, https://www.hl.co.uk/tools/calculators/inflation-calculator and https://goldprice.org/
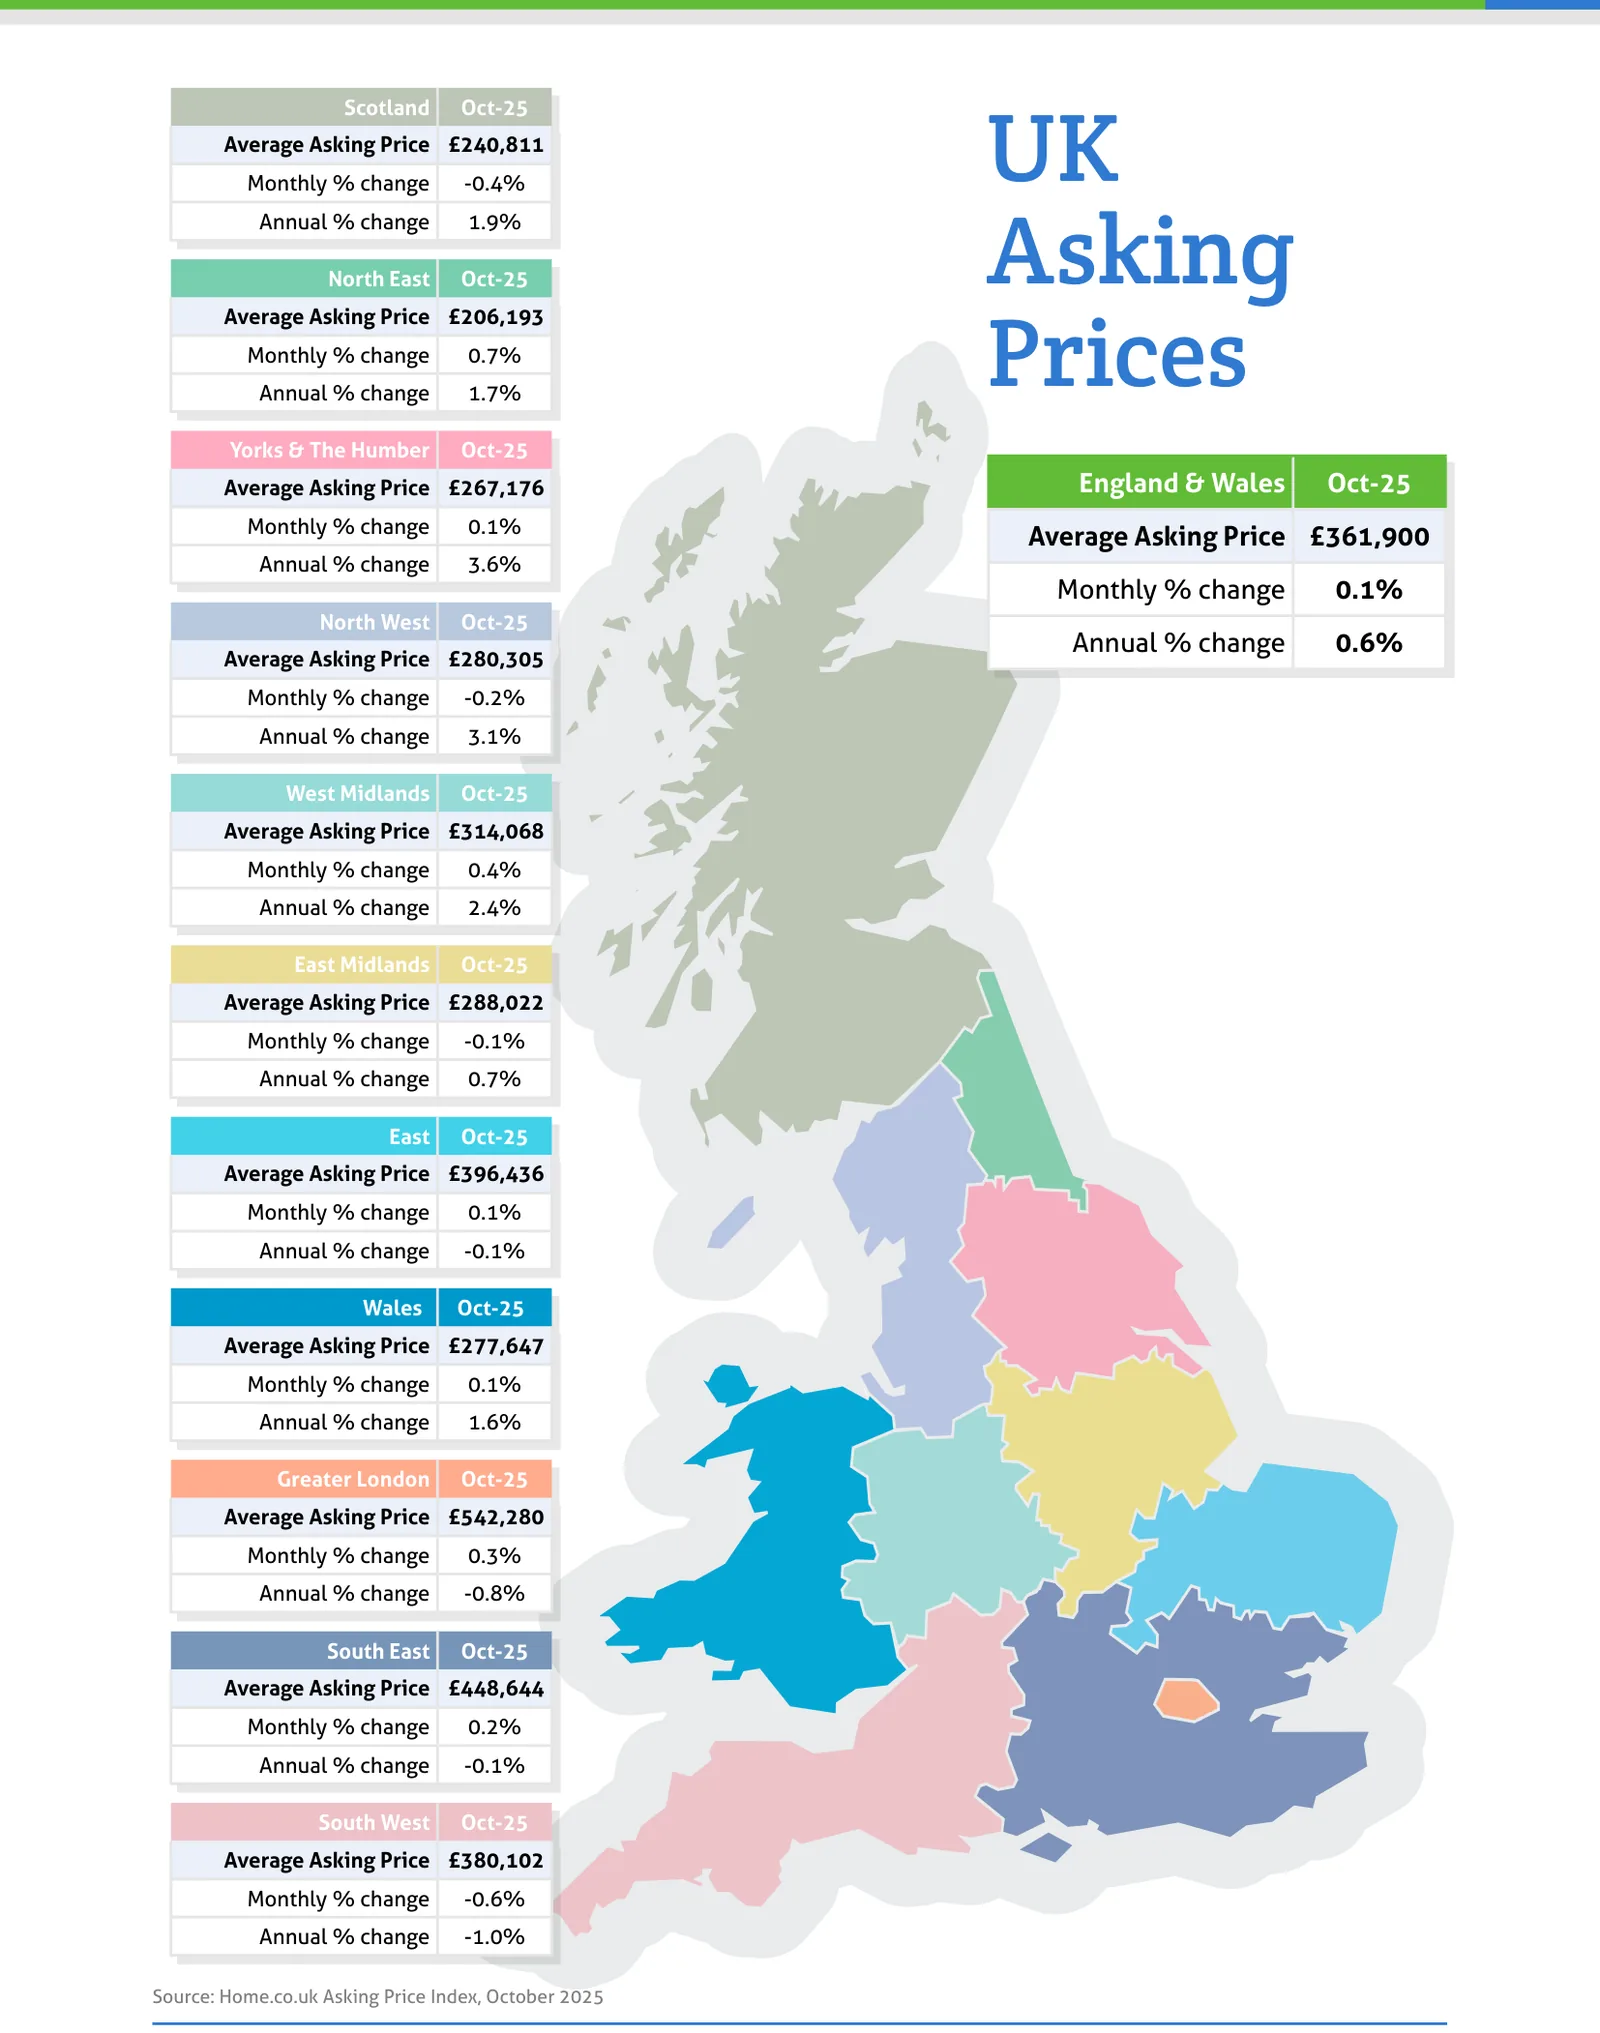
Source: Home.co.uk Asking Price Index, October 2025
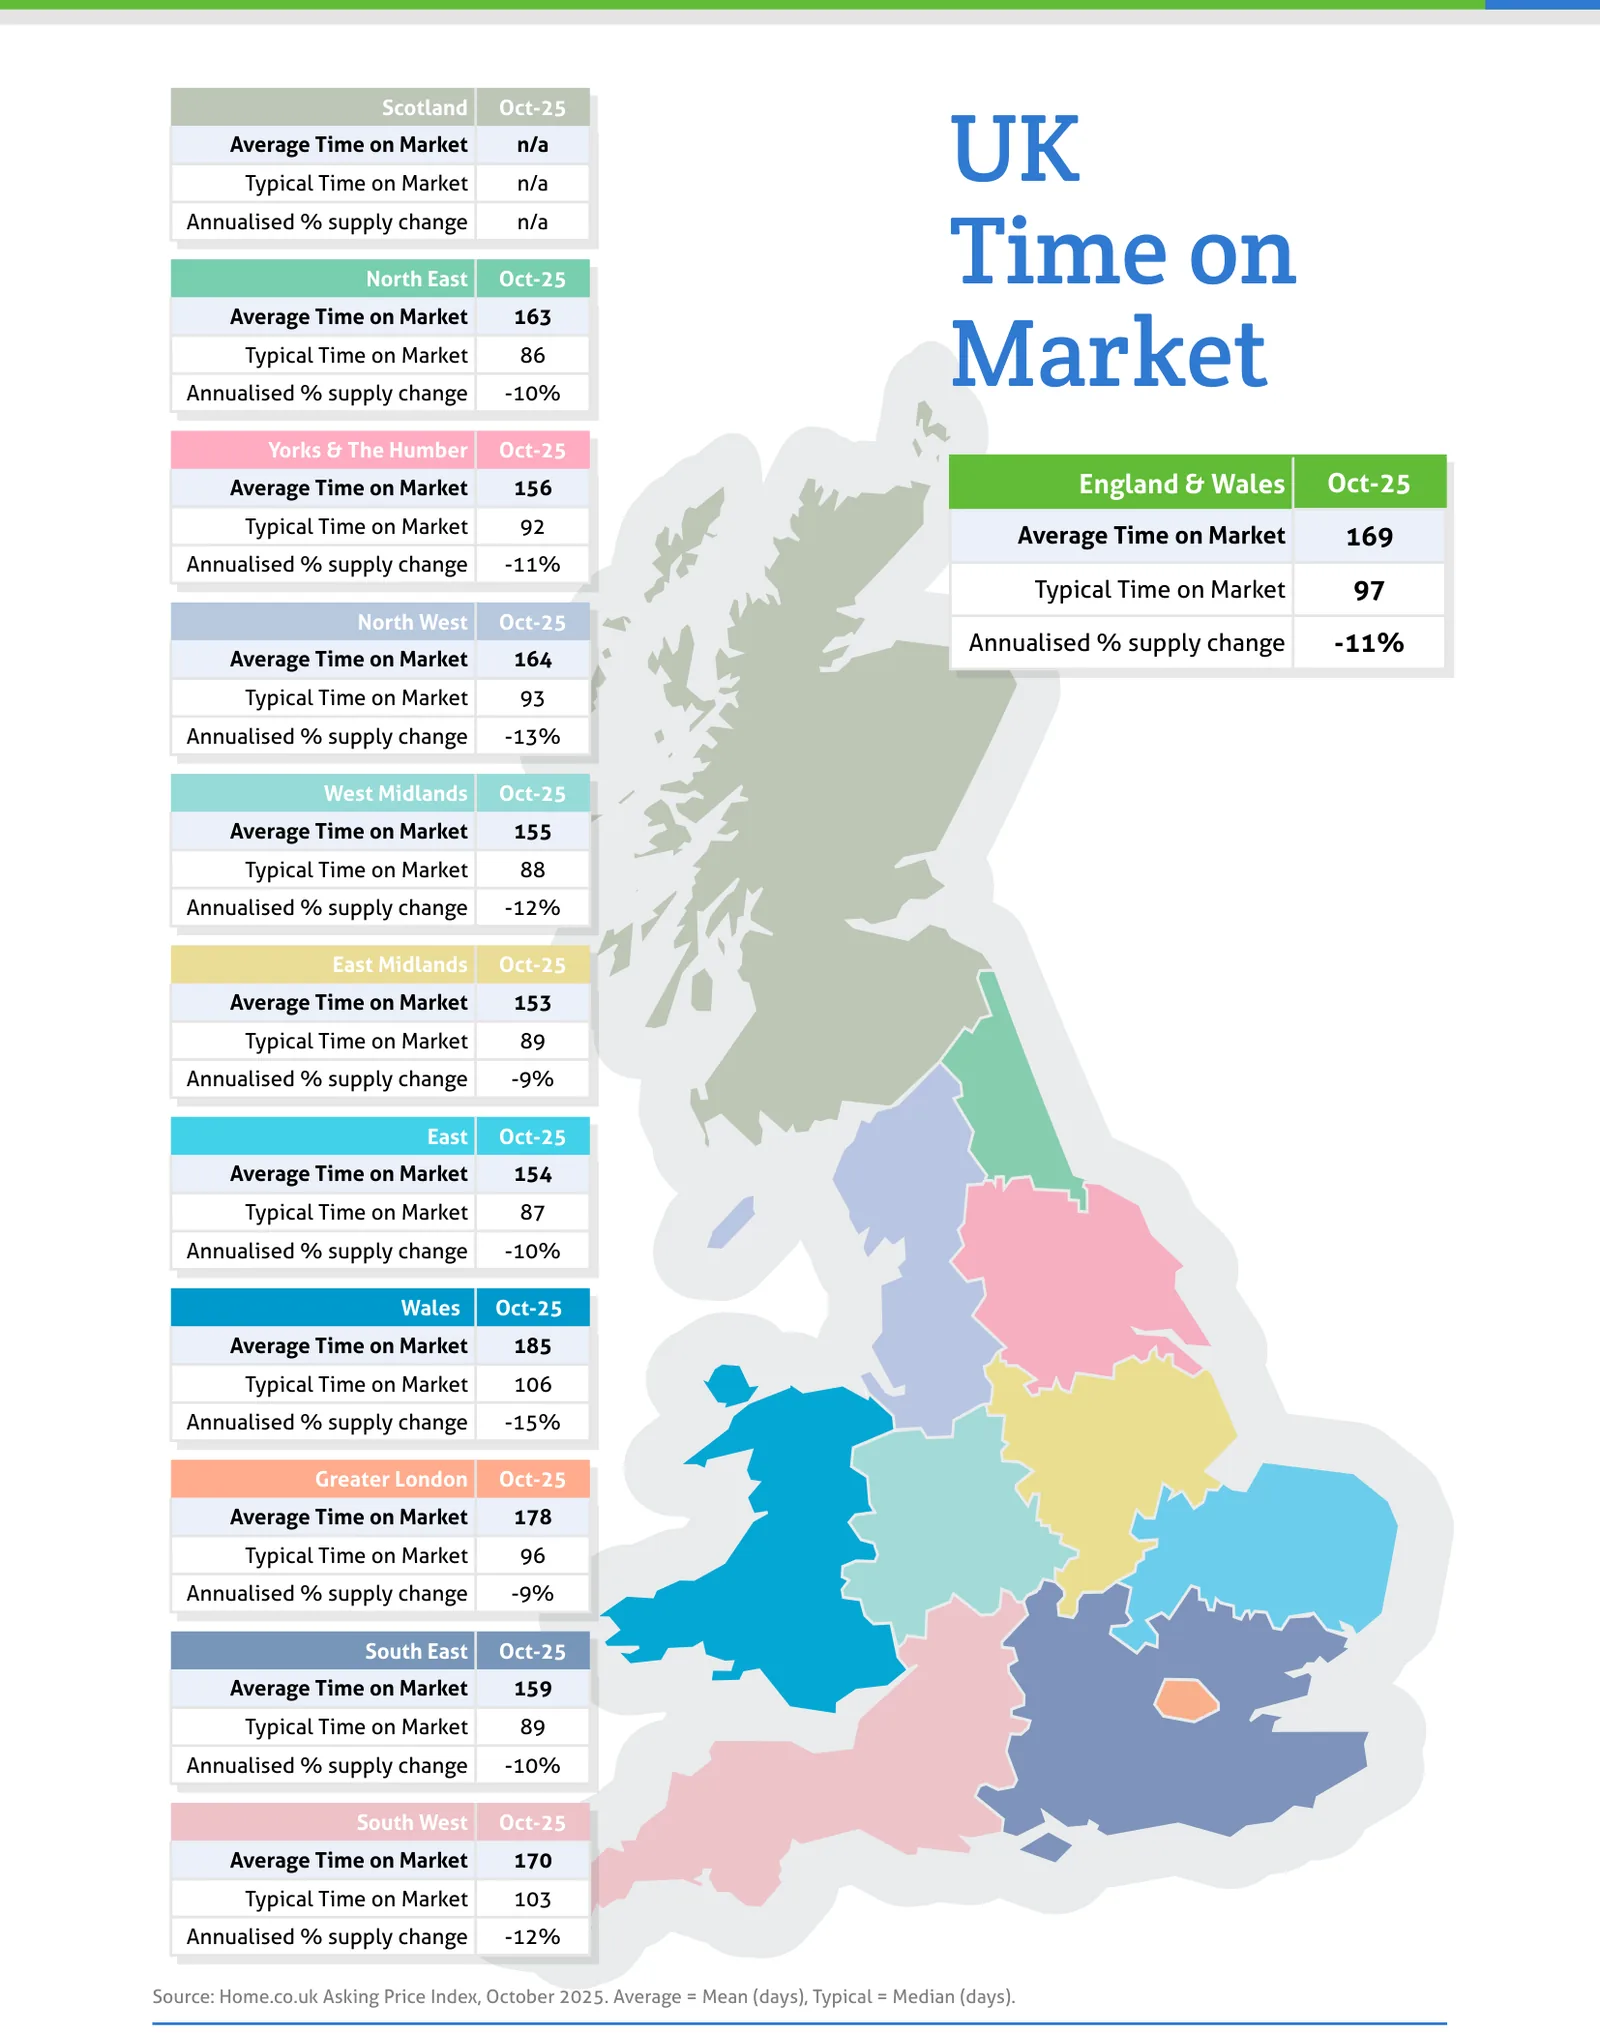
Source: Home.co.uk Asking Price Index, October 2025. Average = Mean (days), Typical = Median (days).
Regional tables
UK Asking Prices, Oct-25
| Region | Average Asking Price | Monthly % change | Annual % change |
|---|---|---|---|
| Scotland | £240,811 | -0.4% | 1.9% |
| North East | £206,193 | 0.7% | 1.7% |
| Yorks & The Humber | £267,176 | 0.1% | 3.6% |
| England & Wales | £361,900 | 0.1% | 0.6% |
| North West | £280,305 | -0.2% | 3.1% |
| West Midlands | £314,068 | 0.4% | 2.4% |
| East Midlands | £288,022 | -0.1% | 0.7% |
| East | £396,436 | 0.1% | -0.1% |
| Wales | £277,647 | 0.1% | 1.6% |
| Greater London | £542,280 | 0.3% | -0.8% |
| South East | £448,644 | 0.2% | -0.1% |
| South West | £380,102 | -0.6% | -1.0% |
UK Time on Market, Oct-25
| Region | Average Time on Market | Typical Time on Market | Annualised % supply change |
|---|---|---|---|
| Scotland | n/a | n/a | n/a |
| North East | 163 | 86 | -10% |
| Yorks & The Humber | 156 | 92 | -11% |
| England & Wales | 169 | 97 | -11% |
| North West | 164 | 93 | -13% |
| West Midlands | 155 | 88 | -12% |
| East Midlands | 153 | 89 | -9% |
| East | 154 | 87 | -10% |
| Wales | 185 | 106 | -15% |
| Greater London | 178 | 96 | -9% |
| South East | 159 | 89 | -10% |
| South West | 170 | 103 | -12% |
Read the full October 2025 edition (PDF, 6 pages)
About the Home Asking Price Index
The Home Asking Price Index measures the change in the prices sellers ask for residential property across England, Wales and Scotland. Today it is computed every month from around half a million advertised homes and is mix-adjusted, so a change in what happens to be on the market does not move the figure; earlier editions state the sample they were built from. Because an asking price is set months before a sale completes, the index runs around five months ahead of completed-sale measures such as the UK House Price Index.
Every edition in the archive, back to October 2006, is listed on the index page. How we measure the UK property market explains the listing data behind it, and today's figures by area are on house prices and rental prices.
Text and figures above are quoted from the October 2025 edition as published, with punctuation normalised for the web, and are not revised. Later editions may restate them.
More in What is happening to house prices: the Home guide
Thinking about your next move?
See what your home's worth in seconds, with the UK's longest-running property data behind it.
Get an instant valuation