

























Home Asking Price Index, October 2024: vendor confidence rises despite inventory at ten-year high
Asking prices rose 0.3% in October across England and Wales while unsold stock reached its highest level since November 2014.

This is the October 2024 edition of the Home Asking Price Index, released on 17 October 2024, under the headline:
Vendor Confidence Rises Despite Inventory at Ten-Year High
The headlines and summary below are the report's own words, with the key figures as it published them, followed by the report's charts and regional tables as printed.
Headlines
- Asking prices increased by 0.3% during the last month across England and Wales, supported by growing market confidence. Home prices are up 1.7% compared to October 2023.
- After two years of cautious recovery, the mix-adjusted average is now higher than in October 2022 but has yet to return to the peak of July 2022.
- Prices show month-on-month increases in Scotland, Wales and all English regions with the exception of the North East where the average remains unchanged.
- The total number of new instructions entering the market during September 2024 was 4% more than during September 2023 and 12% more than September 2019.
- The unsold sales stock count for England and Wales increased again to make the current total the highest since November 2014. Nearly 9,000 properties were added to agents' portfolios, making the current count of unsold properties 508,833.
- Despite the ten-year high in unsold stock, the sales market momentum remains relatively healthy as indicated by the Typical Time on Market (median) for unsold property in England and Wales being five days less than in October 2019. However, the current median time on market for unsold property is four days more than in October last year due to high inventory levels.
- The North East maintains its position as the regional property market growth leader by a large margin. The year-on-year gain remains at 6.7%, while the next best is Yorkshire at 3.7%.
- The East of England and the South West are the worst performing regions, with both indicating an increase of just 0.4% over the same period.
- The annualised national growth for asking rents has stalled (0.0%) when London's losses are included. However, Wales followed by the North East continue to indicate double-digit growth of 15.1% and 12.0% respectively year-on-year. Meanwhile, the year-on-year decline in Greater London rents is now -3.6%.
- The borough of Haringey shows the greatest decline in asking rents with an annualised rental fall of -14.0%.
Summary
An autumn surge in home prices reflects a rise in confidence amongst vendors and the market overall. Such optimism has been fuelled by expectations of gradual interest rate cuts over the coming months. The same optimism has encouraged many potential vendors to commit, resulting in a ten-year high in sales listings. Moreover, a significant contingent consists of landlords downsizing their portfolios, particularly in London.
Despite above average supply, the sales market is attracting sufficient demand to keep marketing times low and property turnover high. The wait-and-see period following the Truss-Kwarteng debacle appears to be over. Significant pent-up demand has been unleashed on the market over recent months due to the more favourable interest rate outlook. However, whether inflation is now truly under control remains to be seen.
At the regional level, the market is highly diverse in terms of price growth. The northern regions of England, the West Midlands, Scotland and Wales continue to show consistent strength with growth over and above inflation. The North East, in particular, continues to impress with spectacular price growth over the last twelve months.
Key figures
| Measure | Figure |
|---|---|
| Monthly change in asking prices | +0.3% |
| Annual change in asking prices | 1.7% |
| New instructions vs September 2023 | 4% |
| New instructions vs September 2019 | +12% |
| Asking rent annual growth (national) | 0.0% |
Figures are for England and Wales unless the report states otherwise, as published in the edition.
Charts from the report
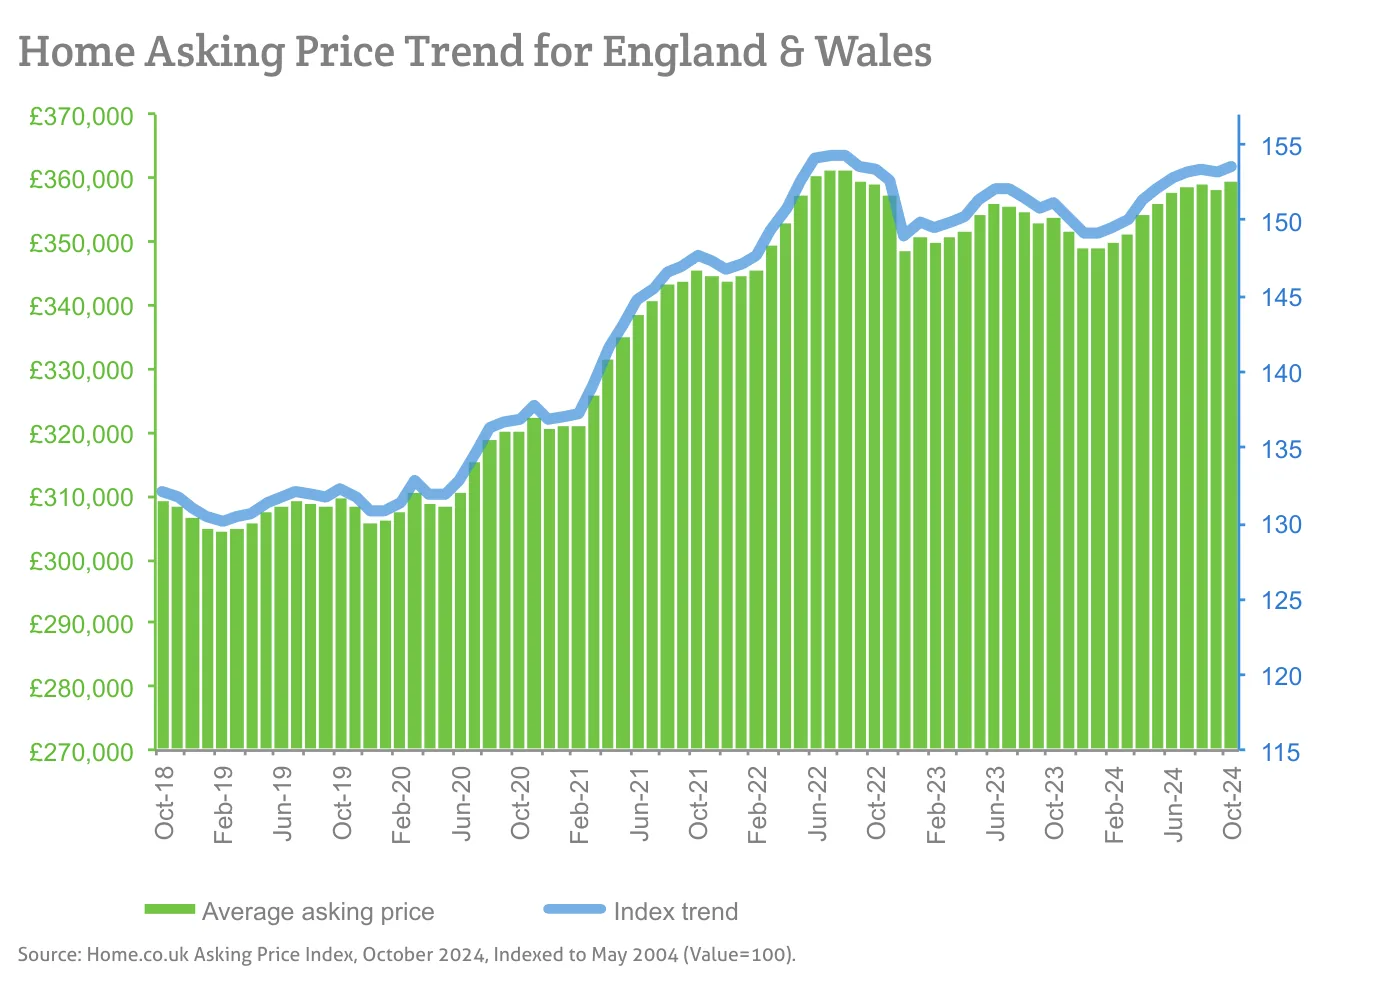
Source: Home.co.uk Asking Price Index, October 2024, Indexed to May 2004 (Value=100).
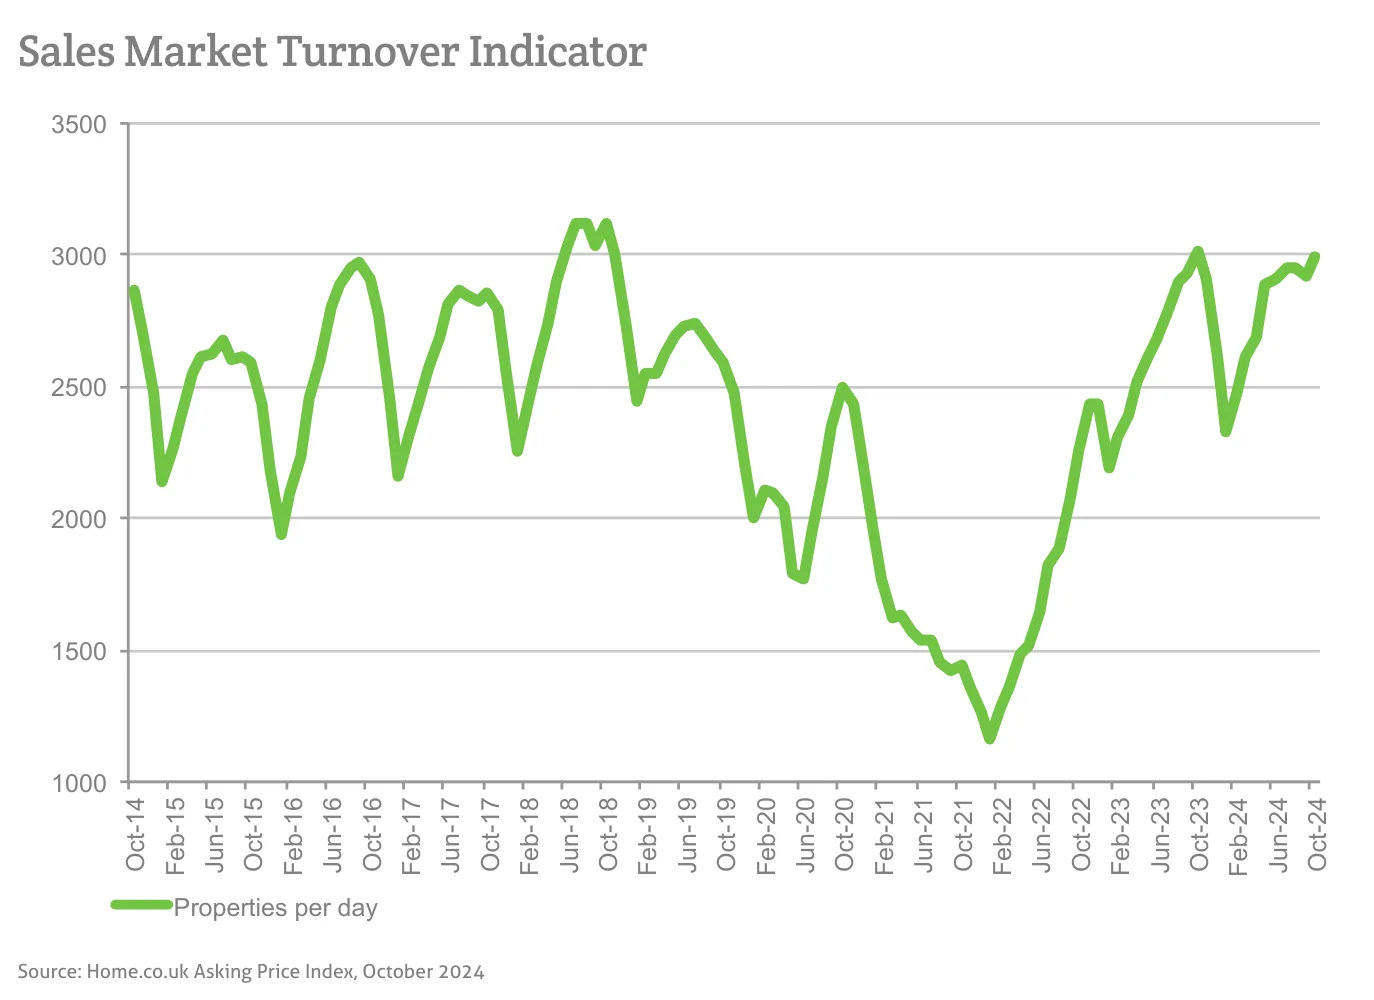
Source: Home.co.uk Asking Price Index, October 2024
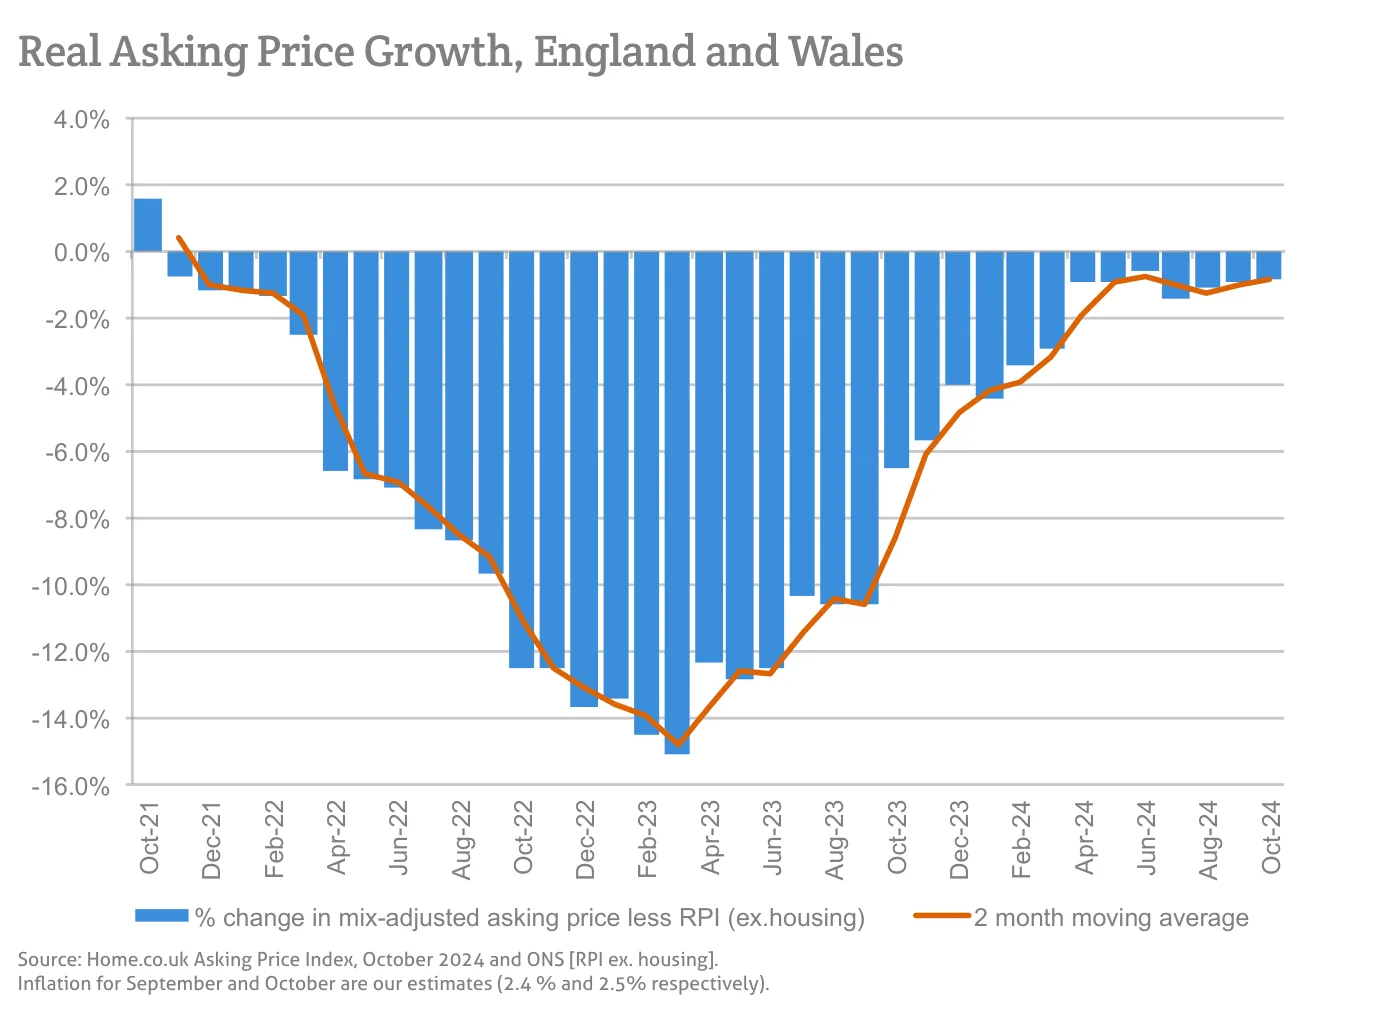
Source: Home.co.uk Asking Price Index, October 2024 and ONS [RPI ex. housing].
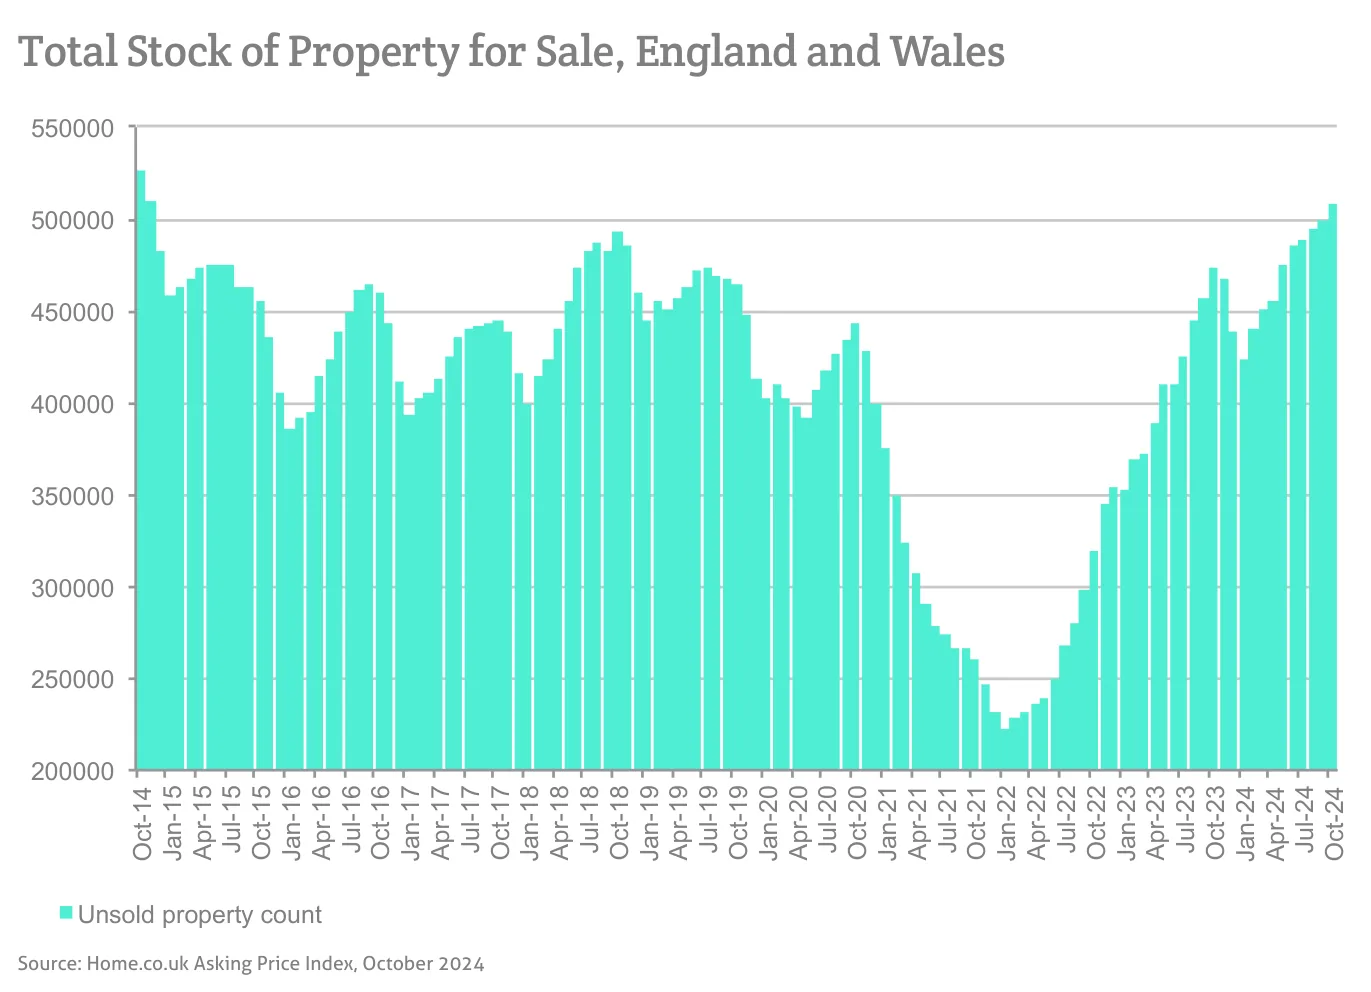
Source: Home.co.uk Asking Price Index, October 2024
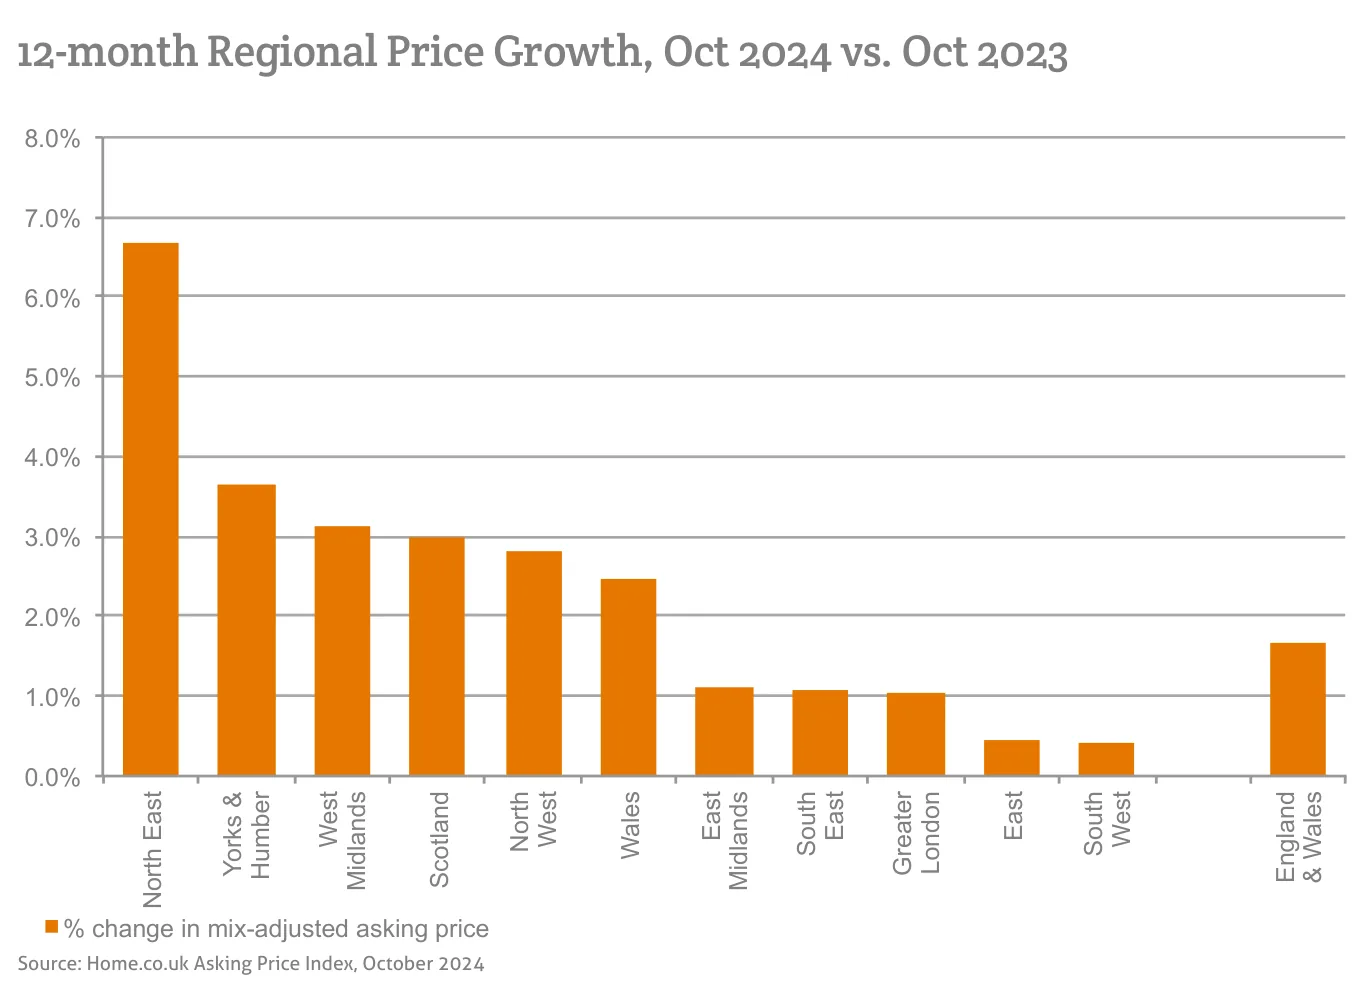
Source: Home.co.uk Asking Price Index, October 2024
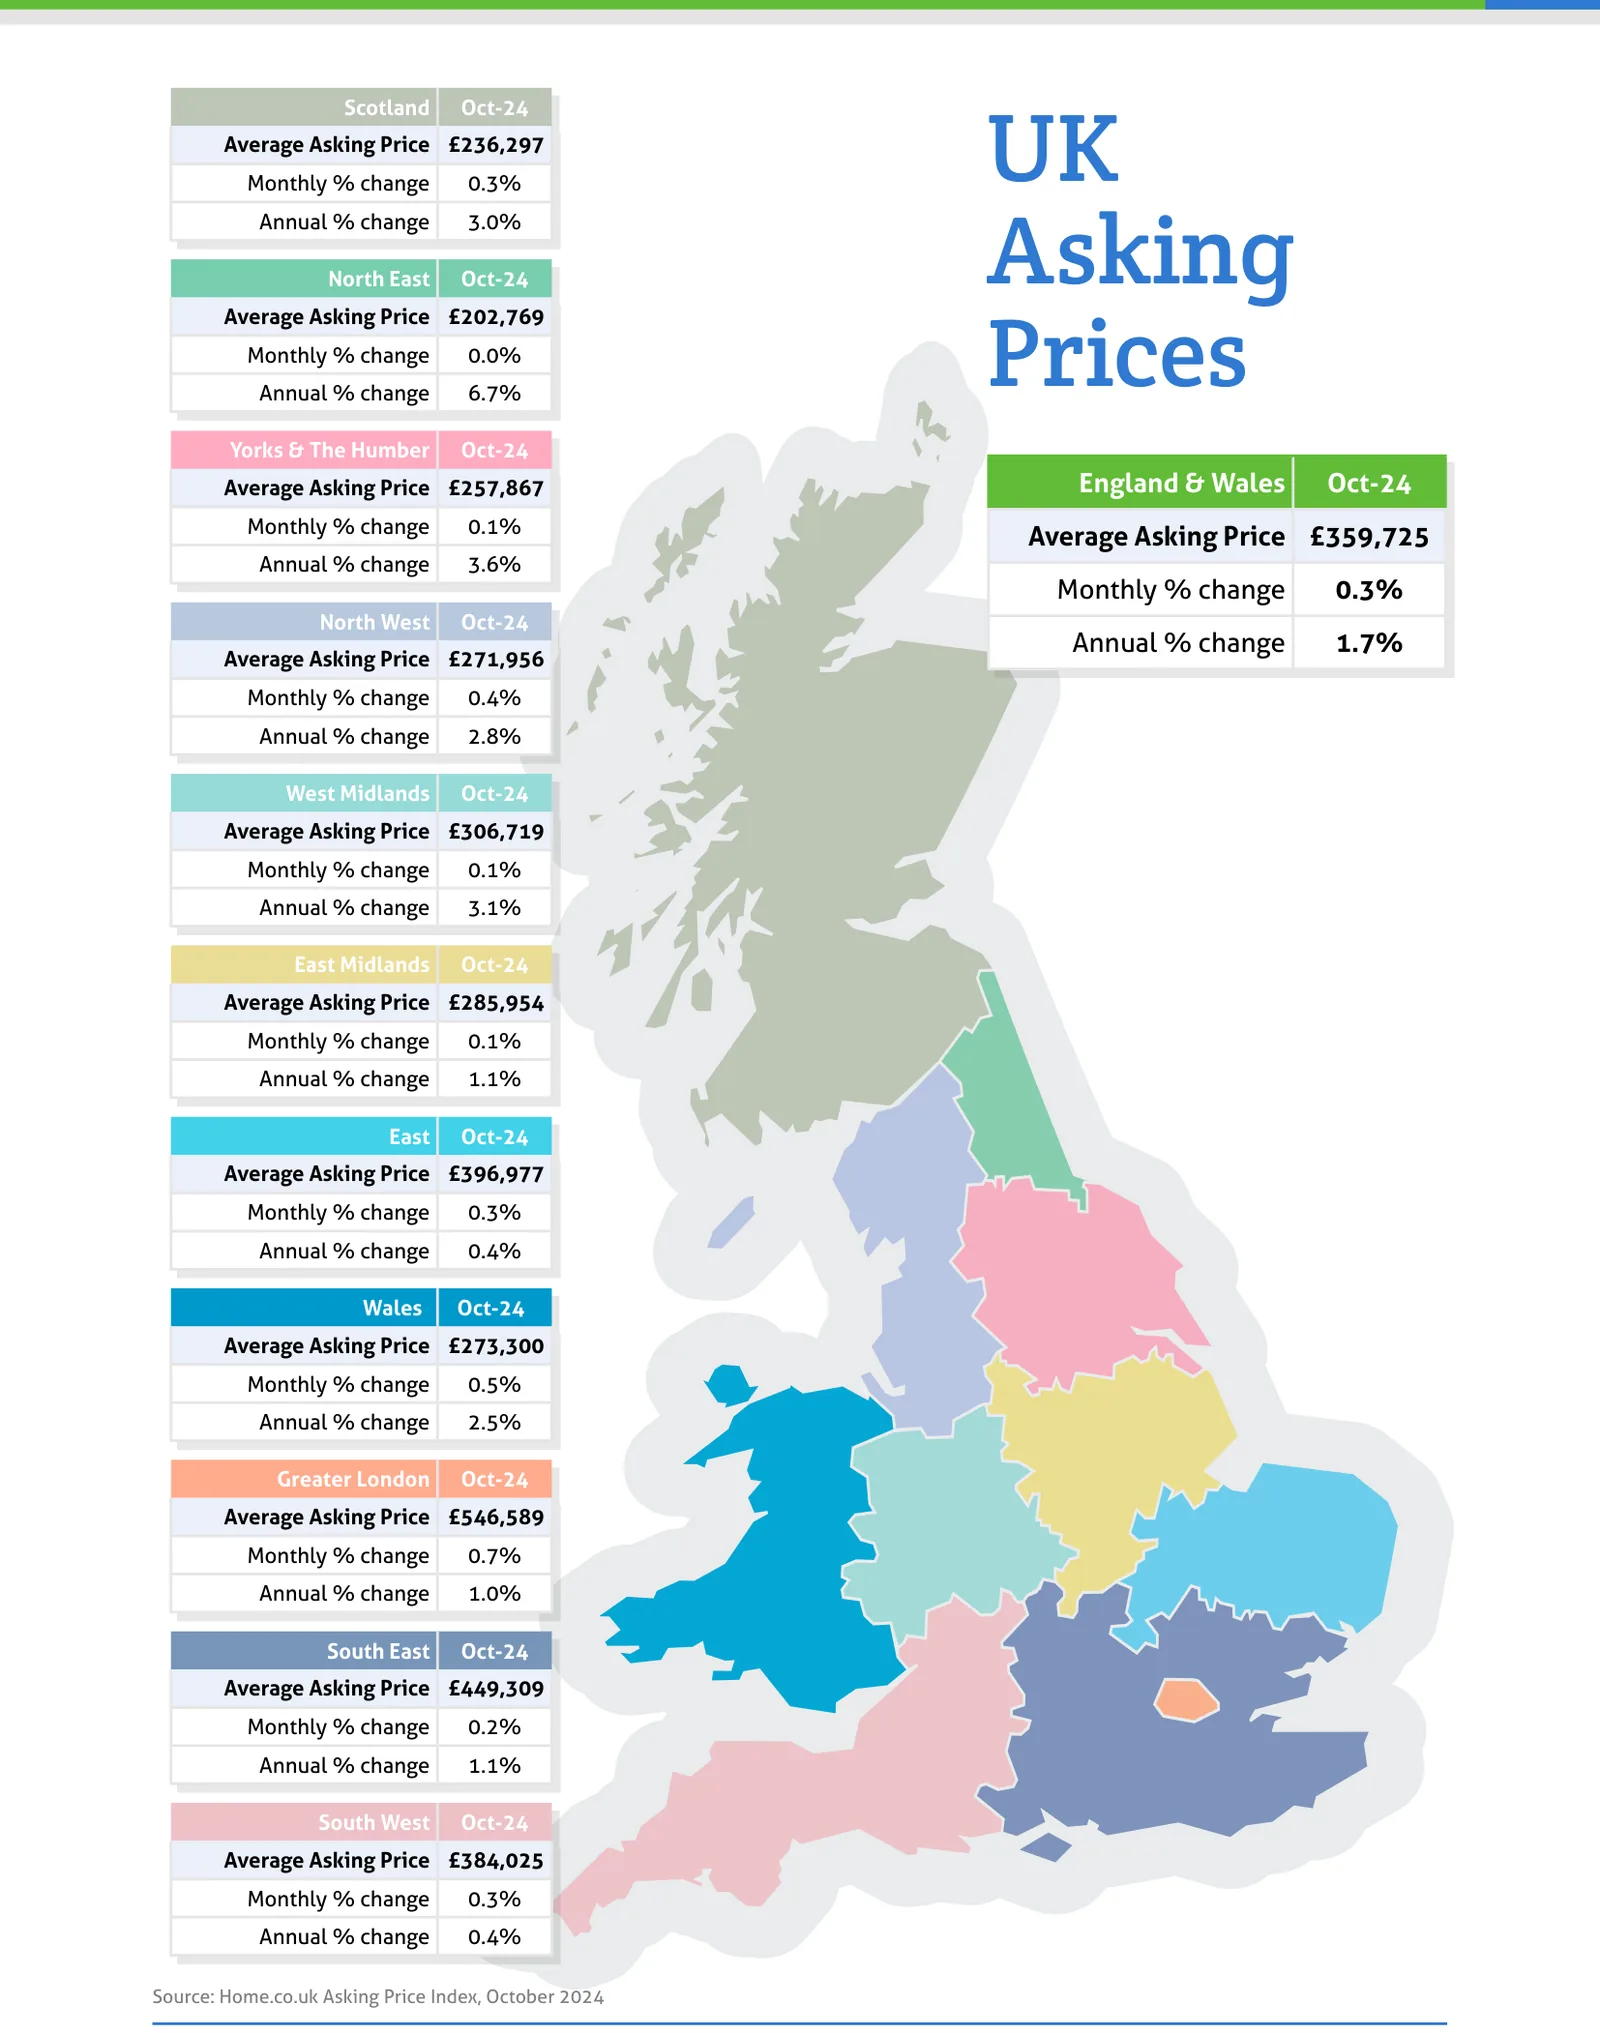
Source: Home.co.uk Asking Price Index, October 2024
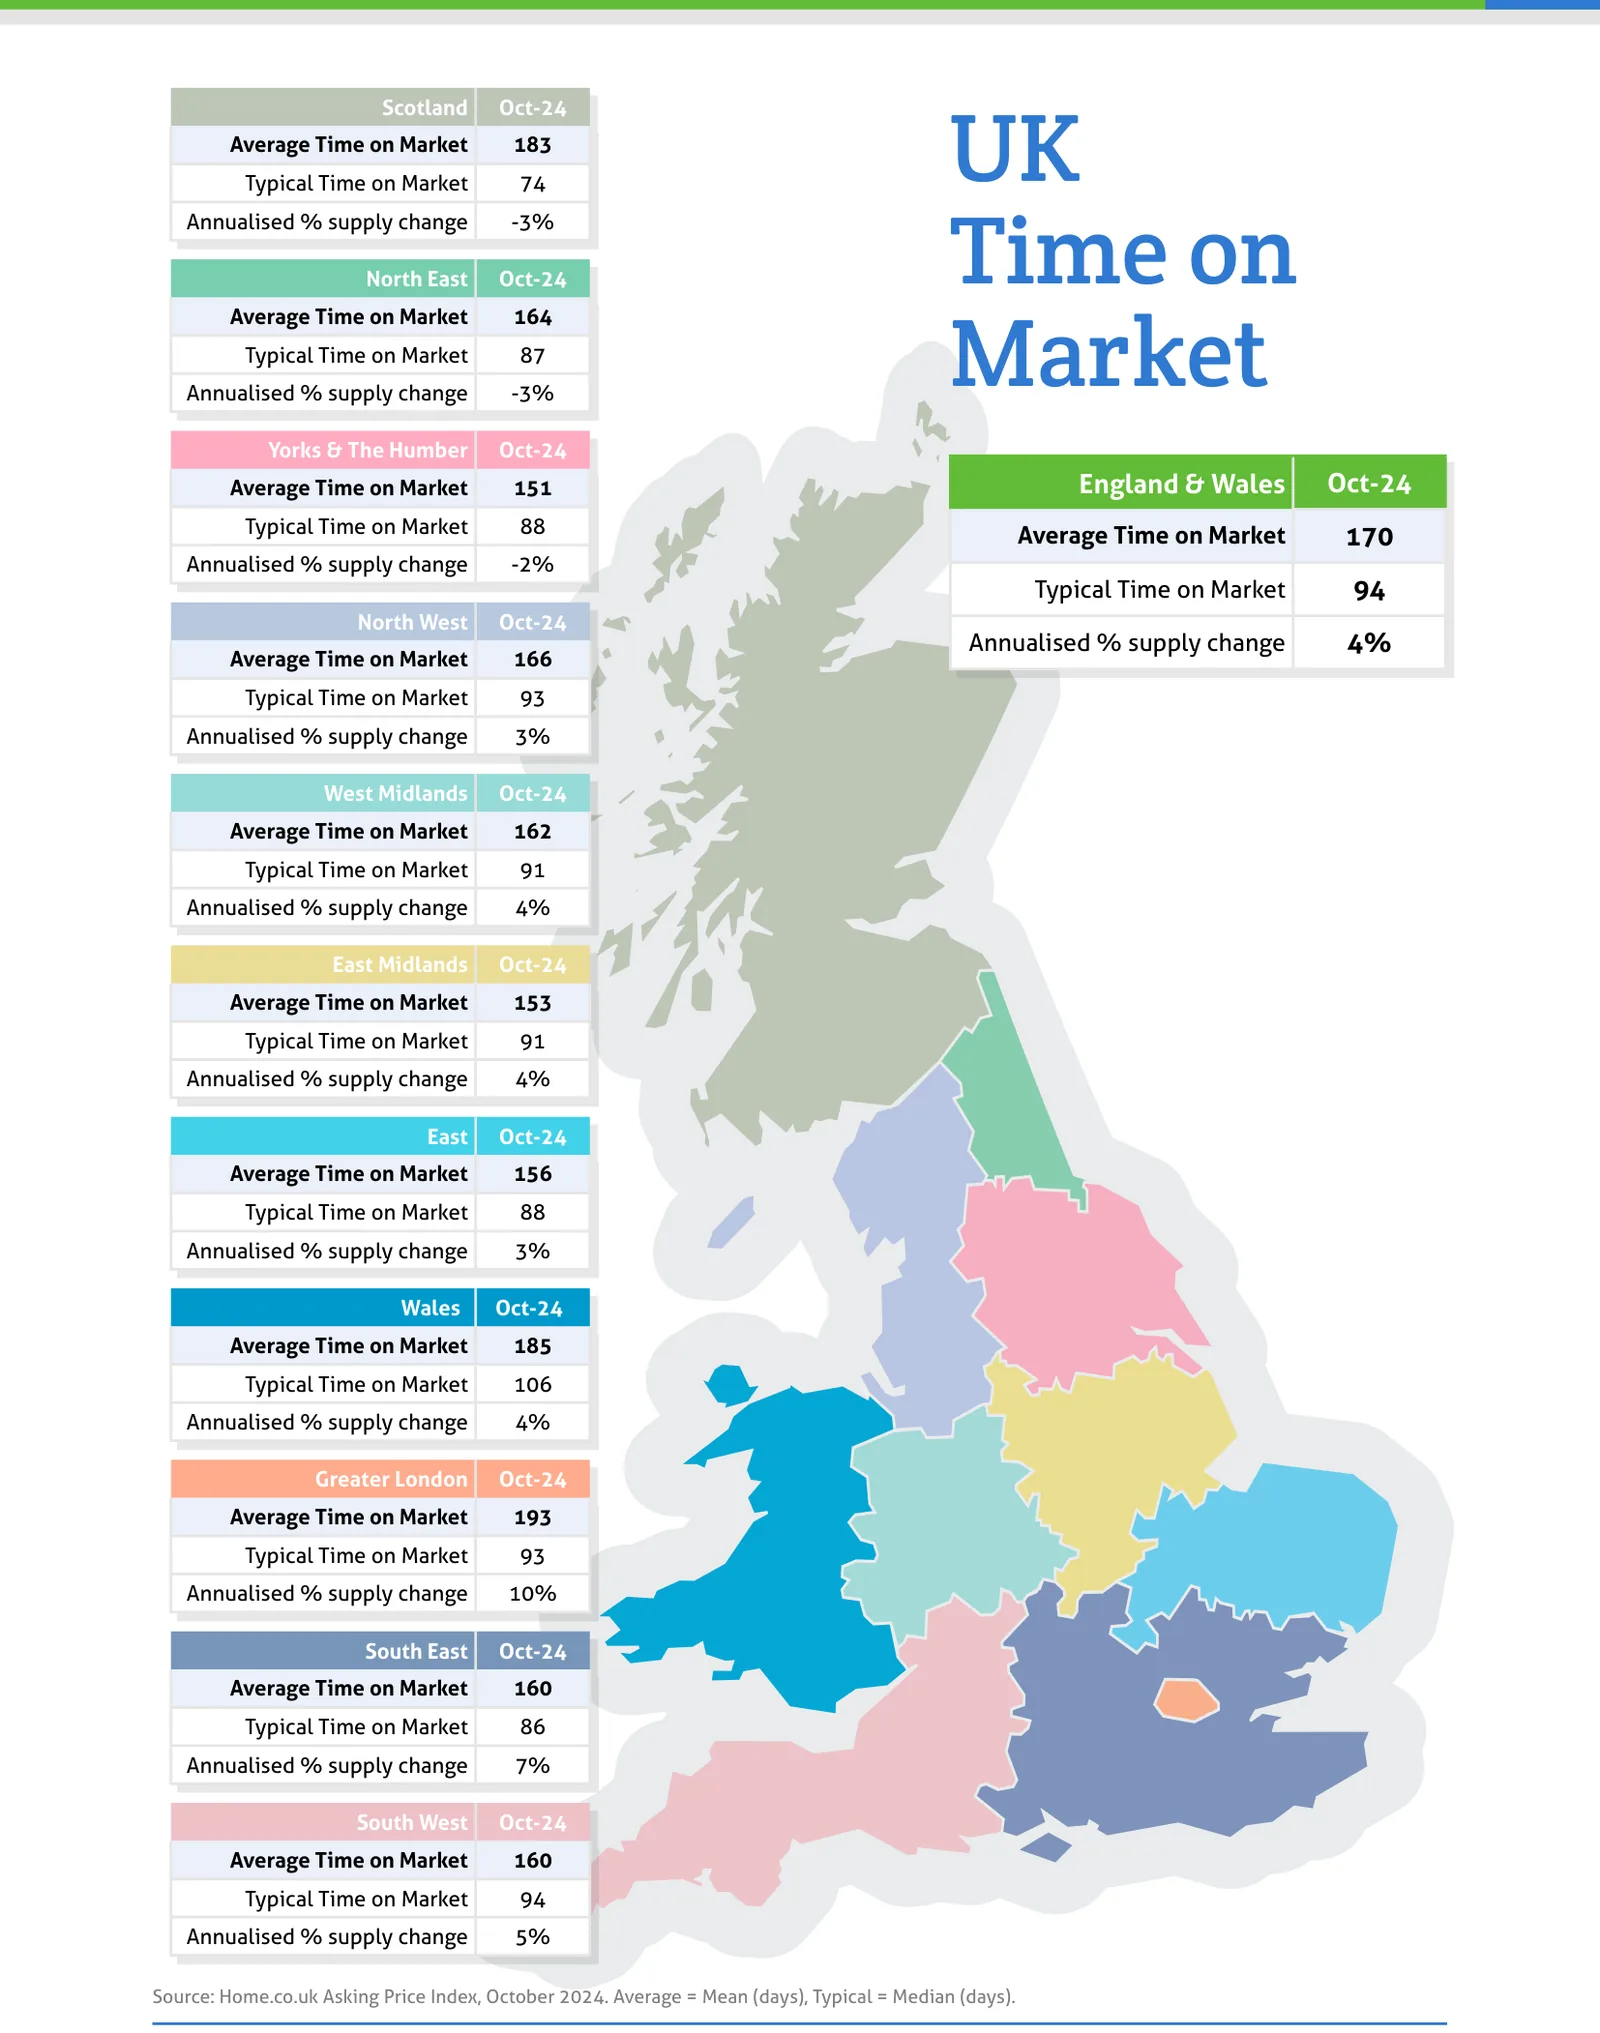
Source: Home.co.uk Asking Price Index, October 2024. Average = Mean (days), Typical = Median (days).
Regional tables
UK Asking Prices, Oct-24
| Region | Average Asking Price | Monthly % change | Annual % change |
|---|---|---|---|
| Scotland | £236,297 | 0.3% | 3.0% |
| North East | £202,769 | 0.0% | 6.7% |
| Yorks & The Humber | £257,867 | 0.1% | 3.6% |
| England & Wales | £359,725 | 0.3% | 1.7% |
| North West | £271,956 | 0.4% | 2.8% |
| West Midlands | £306,719 | 0.1% | 3.1% |
| East Midlands | £285,954 | 0.1% | 1.1% |
| East | £396,977 | 0.3% | 0.4% |
| Wales | £273,300 | 0.5% | 2.5% |
| Greater London | £546,589 | 0.7% | 1.0% |
| South East | £449,309 | 0.2% | 1.1% |
| South West | £384,025 | 0.3% | 0.4% |
UK Time on Market, Oct-24
| Region | Average Time on Market | Typical Time on Market | Annualised % supply change |
|---|---|---|---|
| Scotland | 183 | 74 | -3% |
| North East | 164 | 87 | -3% |
| Yorks & The Humber | 151 | 88 | -2% |
| England & Wales | 170 | 94 | 4% |
| North West | 166 | 93 | 3% |
| West Midlands | 162 | 91 | 4% |
| East Midlands | 153 | 91 | 4% |
| East | 156 | 88 | 3% |
| Wales | 185 | 106 | 4% |
| Greater London | 193 | 93 | 10% |
| South East | 160 | 86 | 7% |
| South West | 160 | 94 | 5% |
From the director's commentary
"The Renters' Rights Bill will not improve the lives of tenants; more likely, it will worsen their plight. It is in fact an attack on landlords' fundamental property rights and therefore an attack on the entire UK property market."
Doug Shephard, Director at Home.co.uk
Read the full October 2024 edition (PDF, 10 pages)
About the Home Asking Price Index
The Home Asking Price Index measures the change in the prices sellers ask for residential property across England, Wales and Scotland. Today it is computed every month from around half a million advertised homes and is mix-adjusted, so a change in what happens to be on the market does not move the figure; earlier editions state the sample they were built from. Because an asking price is set months before a sale completes, the index runs around five months ahead of completed-sale measures such as the UK House Price Index.
Every edition in the archive, back to October 2006, is listed on the index page. How we measure the UK property market explains the listing data behind it, and today's figures by area are on house prices and rental prices.
Text and figures above are quoted from the October 2024 edition as published, with punctuation normalised for the web, and are not revised. Later editions may restate them.
More in What is happening to house prices: the Home guide
Thinking about your next move?
See what your home's worth in seconds, with the UK's longest-running property data behind it.
Get an instant valuation