

























Home Asking Price Index, October 2022: London rallies while prices slide in several regions
Asking prices in England and Wales dipped 0.2% in October while London stock fell and annual growth held at 3.9%.

This is the October 2022 edition of the Home Asking Price Index, released on 14 October 2022, under the headline:
London Rallies While Prices Slide in Several Regions
The headlines and summary below are the report's own words, with the key figures as it published them, followed by the report's charts and regional tables as printed.
Headlines
- Asking prices across England and Wales have dipped for a second consecutive month (by just 0.2%), bringing the year-on-year rise to 3.9%, broadly in line with both seasonal expectations and post-boom price corrections.
- The total stock of property for sale in England and Wales ticked up yet again, affording more choice for potential buyers. Despite recent increases, the stock total is still a long way below what might be considered normal.
- Greater London is the only region where the stock of unsold property has fallen over the last twelve months (by 4.7%).
- The much-forecasted slowdown is yet to appear. The Typical Time on Market (median) for unsold property is up just two days at 67 days since last month but 13 days less than in October 2021, despite pricier mortgages. The average time on market actually fell two days since last month, continuing its downward trend.
- Record-high prices and a negative outlook for landlords are motivating more vendors to commit, thereby increasing the supply of new instructions. 16% more properties were placed on the market last month compared to September 2021.
- Yorkshire and Welsh property markets now lead in annualised regional price growth (+7.0%and +7.2% respectively).
- Monetary inflation remains very high at 13.9% (RPI ex. housing), making current real growth around 10% [sic: a real-terms fall of around 10%] year-on-year. Moreover, despite rising mortgage costs, the real mortgage interest rate remains around -8%.
- London rents continue their skywards trajectory. Demand has decimated supply and this is driving annualised rental growth to a phenomenal 28.2%.
- Central London rents rose the fastest at first but the current new growth leaders are the boroughs of Bexley, Hounslow and Newham (+42.6%, +39.7% and +39.1% annualised respectively).
- Correspondingly, yields across the entire capital region are vastly improving and this has not escaped the notice of investors.
Summary
The London sales market finally returns to strength while the overheated regional markets indicate more realistic pricing. Sterling weakness, in US dollar terms, is now making the UK capital's property market more attractive, but the recovery has been on the cards since before the lockdowns wreaked havoc. Rapidly rising rents have brought yields back up significantly and worsening scarcity of available properties to let will ensure that the trend continues. The total stock of property for sale in the capital region is down 4.7% since October last year.
Meanwhile, stock levels are recovering after the rabid buying frenzy that drove sales agents' portfolios down to unprecedented levels. The greatest increases in sales stock over the last twelve months are in Wales (+49%), the South West (+46%) and the East of England (+42%). The drought is now over and the inevitable rebalancing of supply and demand is underway. More cautious pricing is apparent across most English regions, Wales and Scotland, as evidenced by small dips in average prices. Panic selling appears unlikely while strong rental demand continues to support property values.
Key figures
| Measure | Figure |
|---|---|
| Monthly change in asking prices | -0.2% |
| Annual change in asking prices | 3.9% |
| Typical Time on Market | 67 days |
| Change in new instructions | +16% |
| Monetary inflation (RPI ex. housing) | 13.9% |
| Real mortgage interest rate | -8% |
| London rental growth | 28.2% |
Figures are for England and Wales unless the report states otherwise, as published in the edition.
Charts from the report
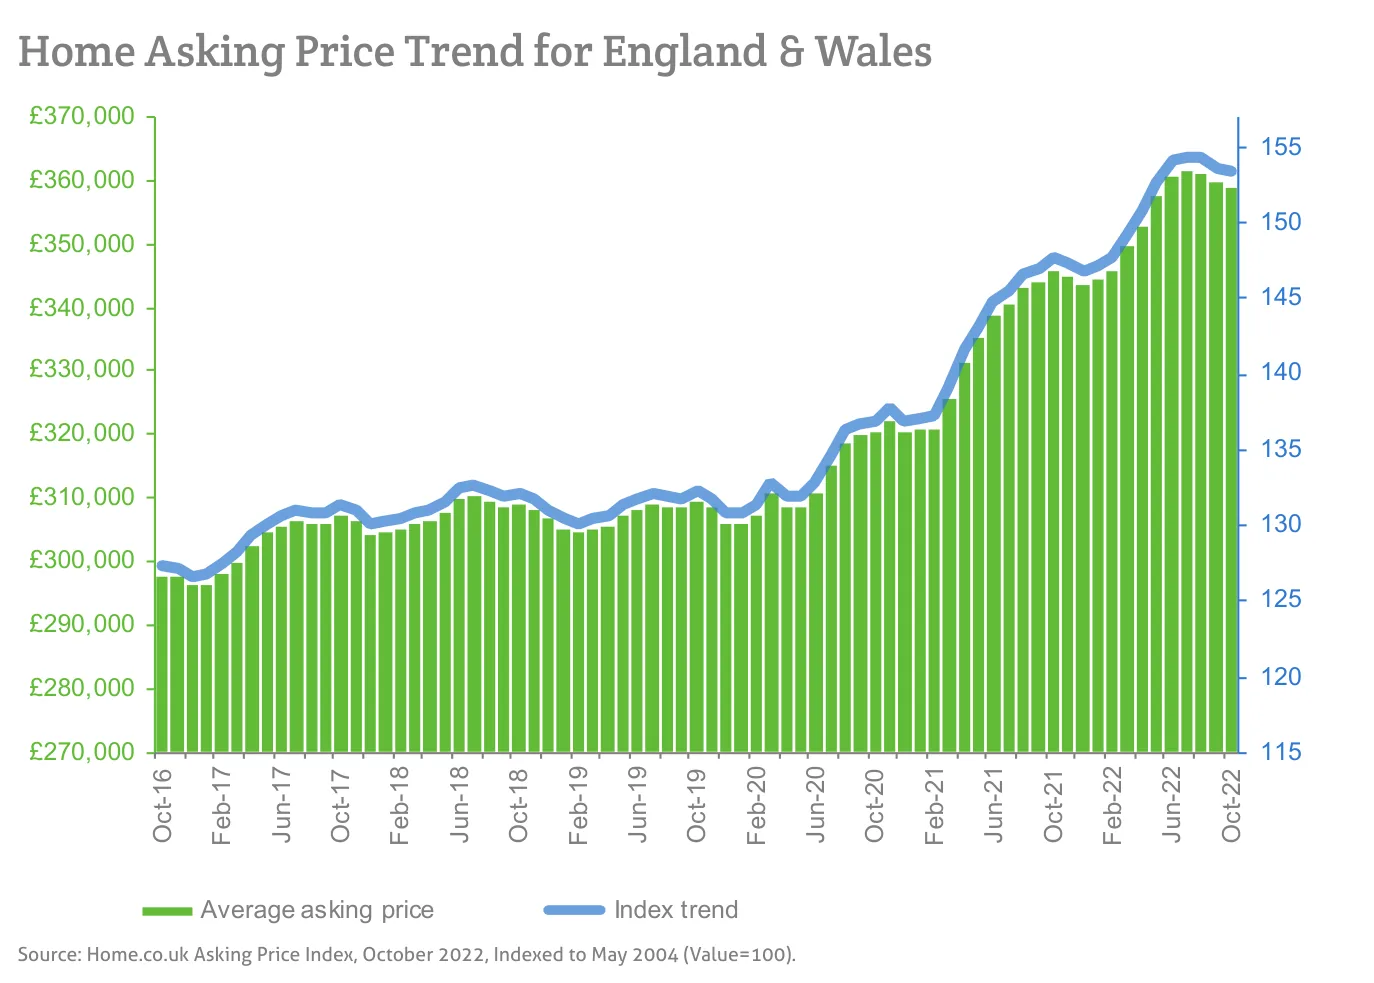
Source: Home.co.uk Asking Price Index, October 2022, Indexed to May 2004 (Value=100).
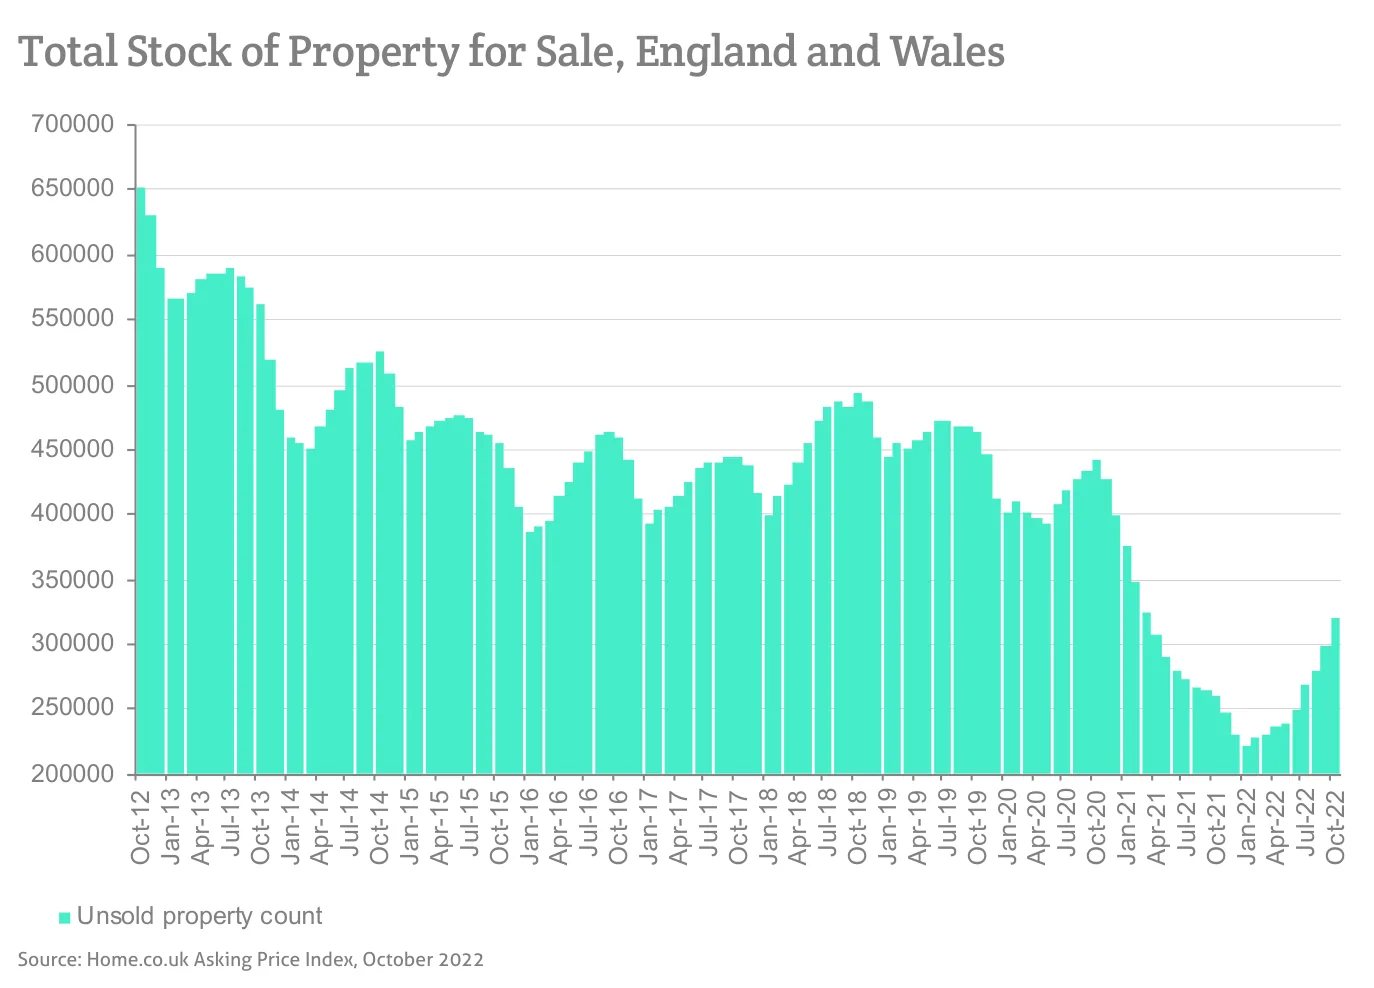
Source: Home.co.uk Asking Price Index, October 2022
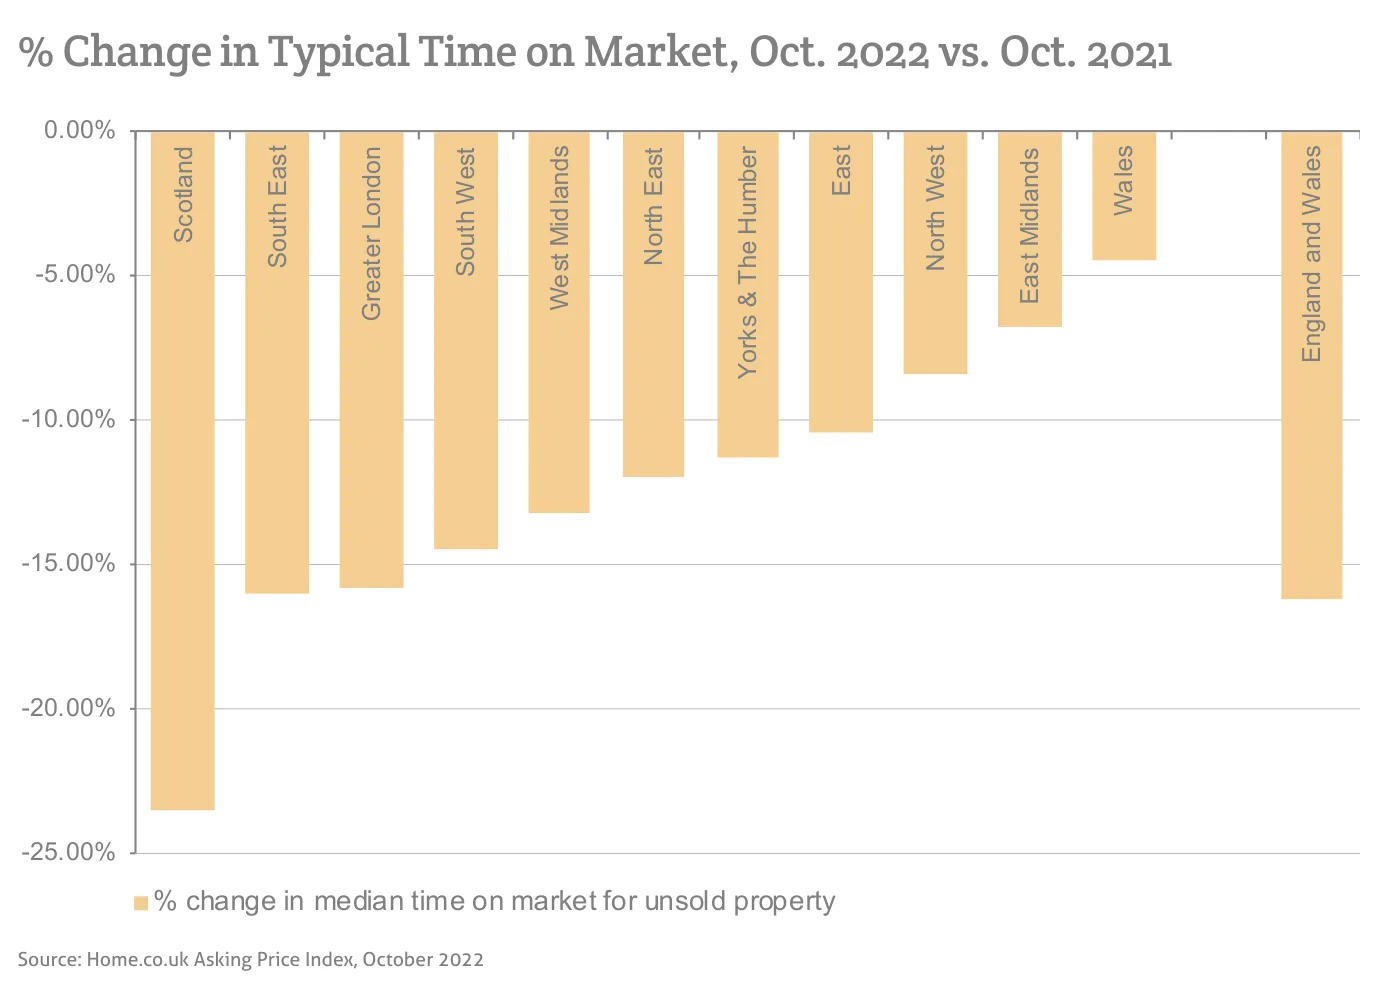
Source: Home.co.uk Asking Price Index, October 2022
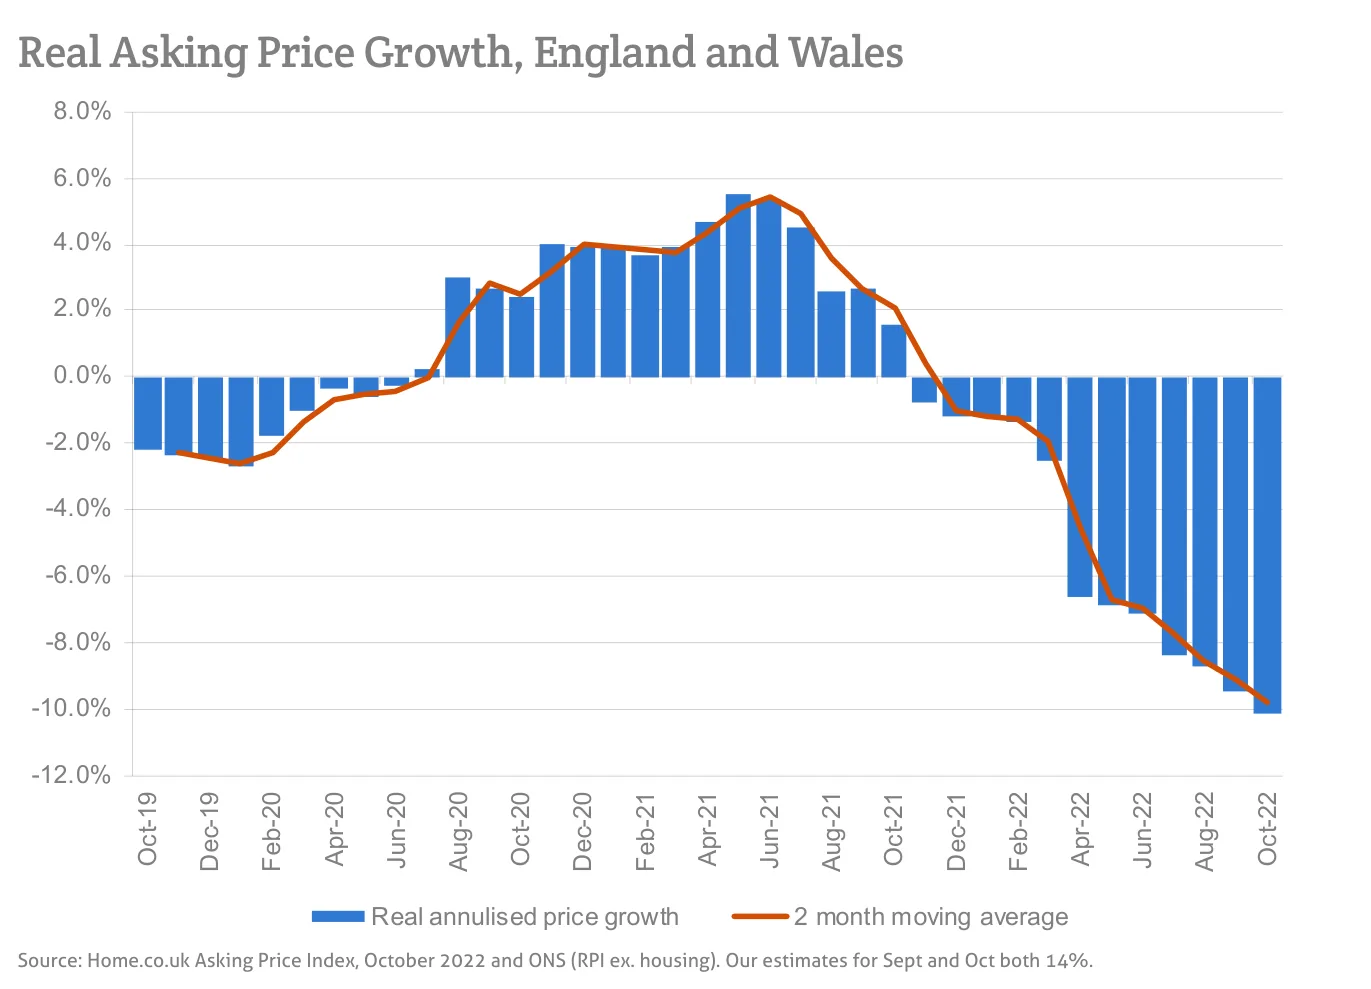
Source: Home.co.uk Asking Price Index, October 2022 and ONS (RPI ex. housing). Our estimates for Sept and Oct both 14%.
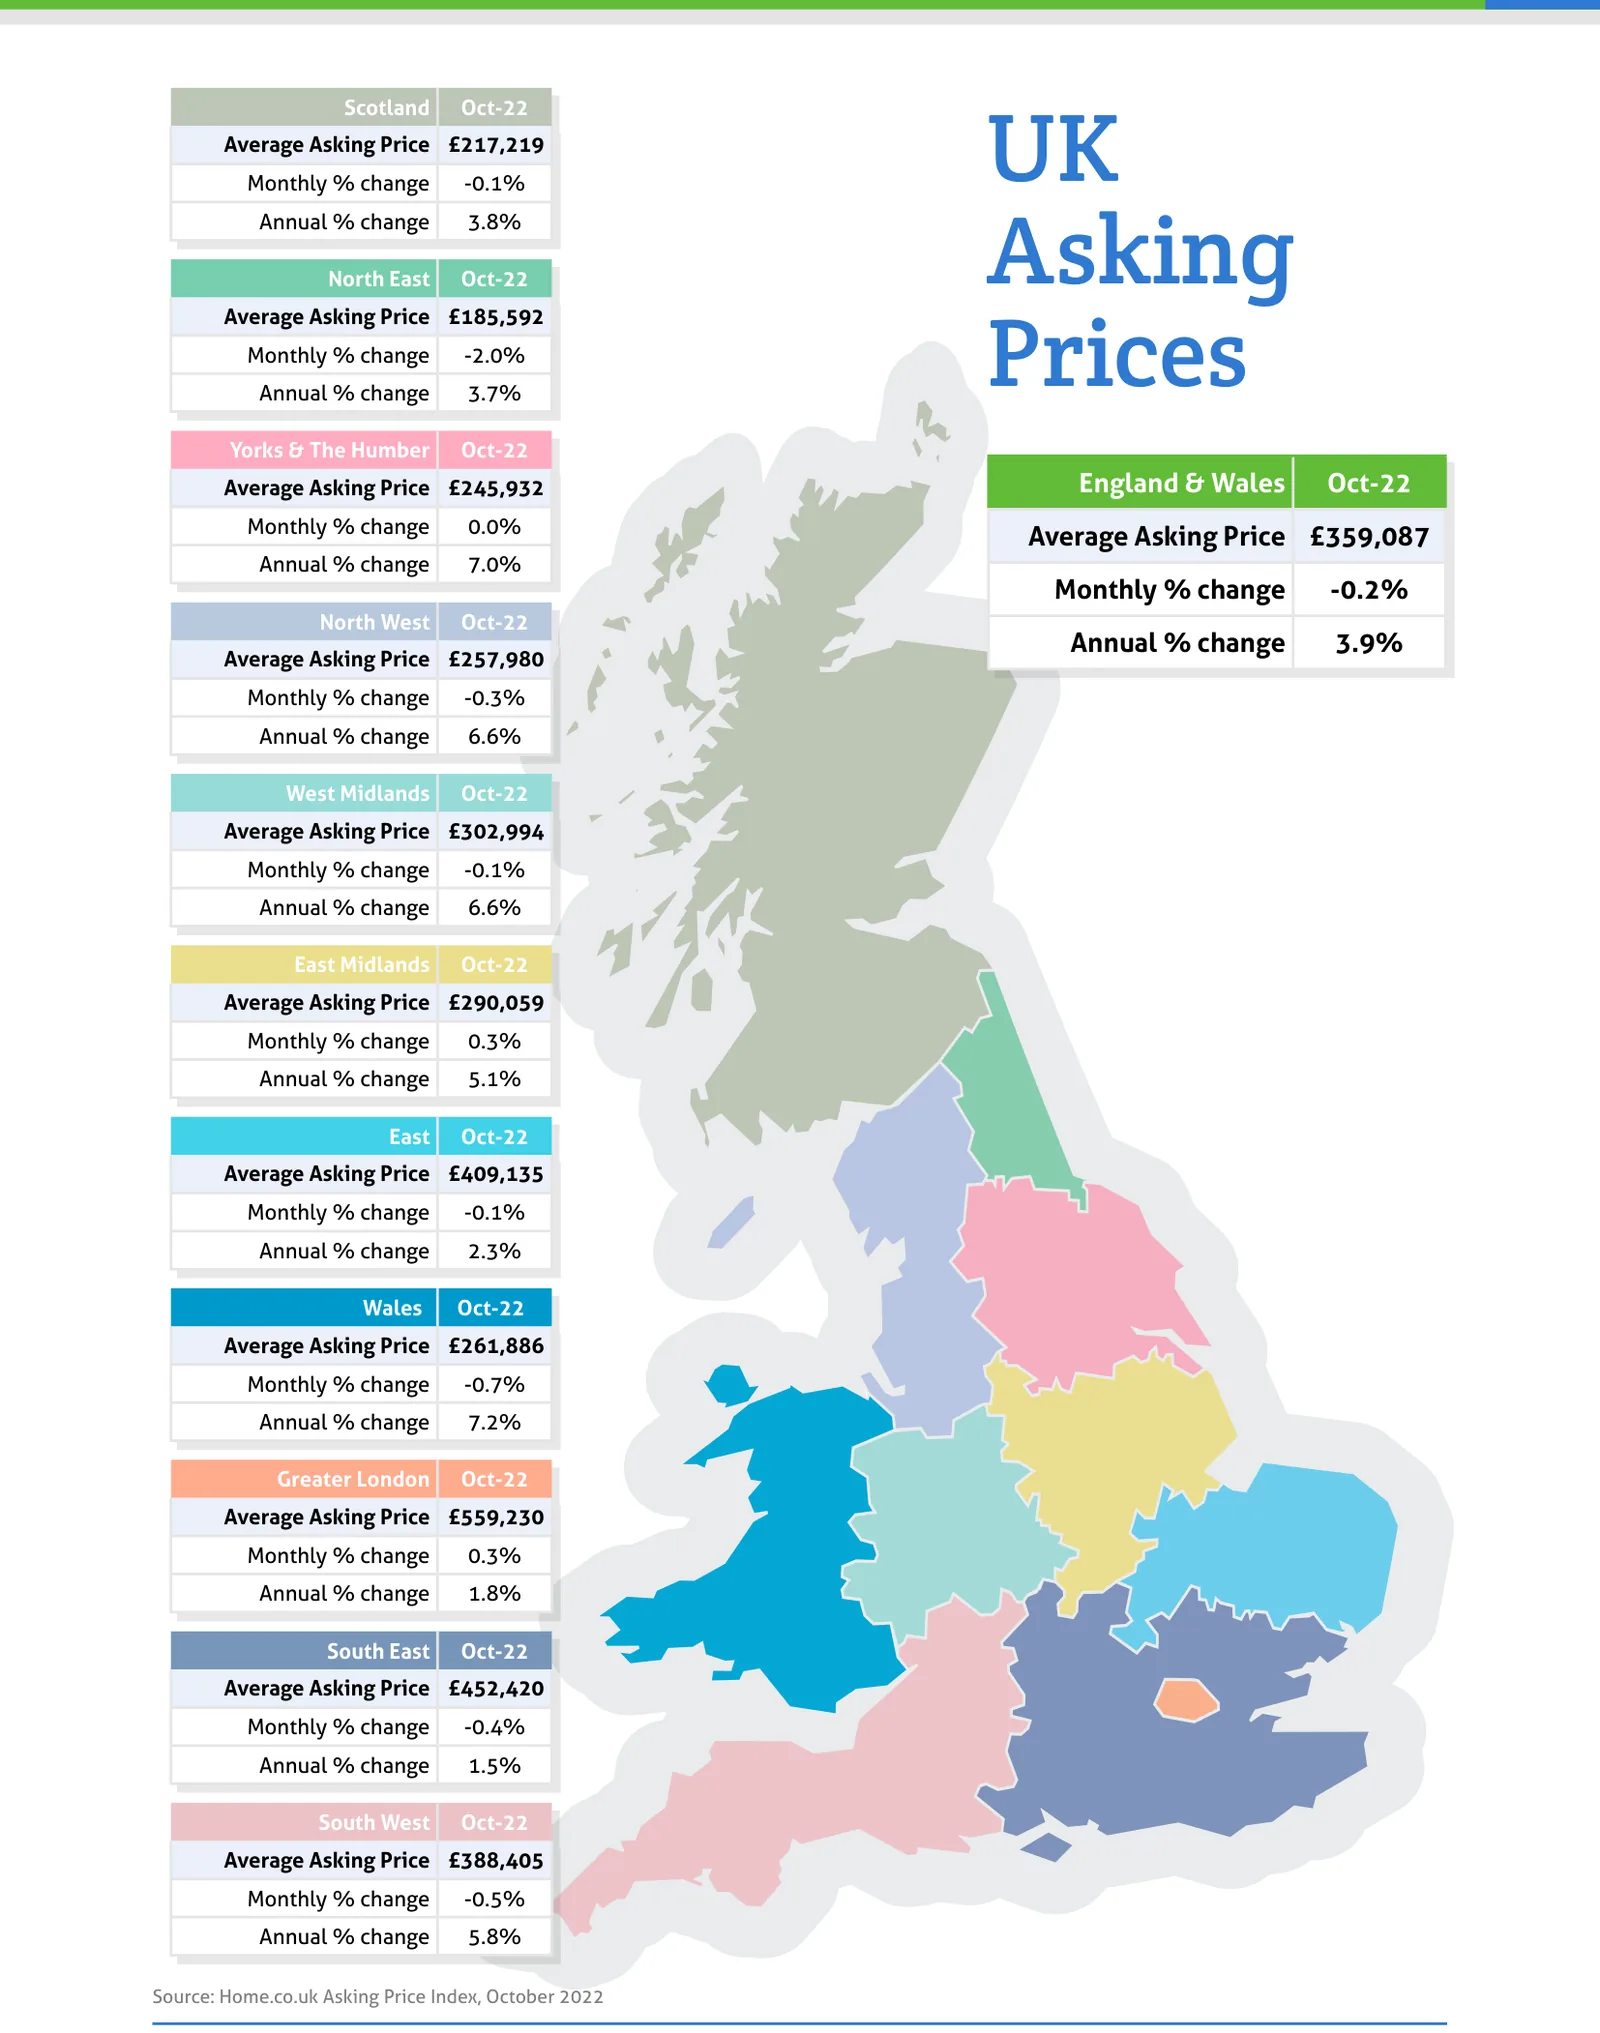
Source: Home.co.uk Asking Price Index, October 2022
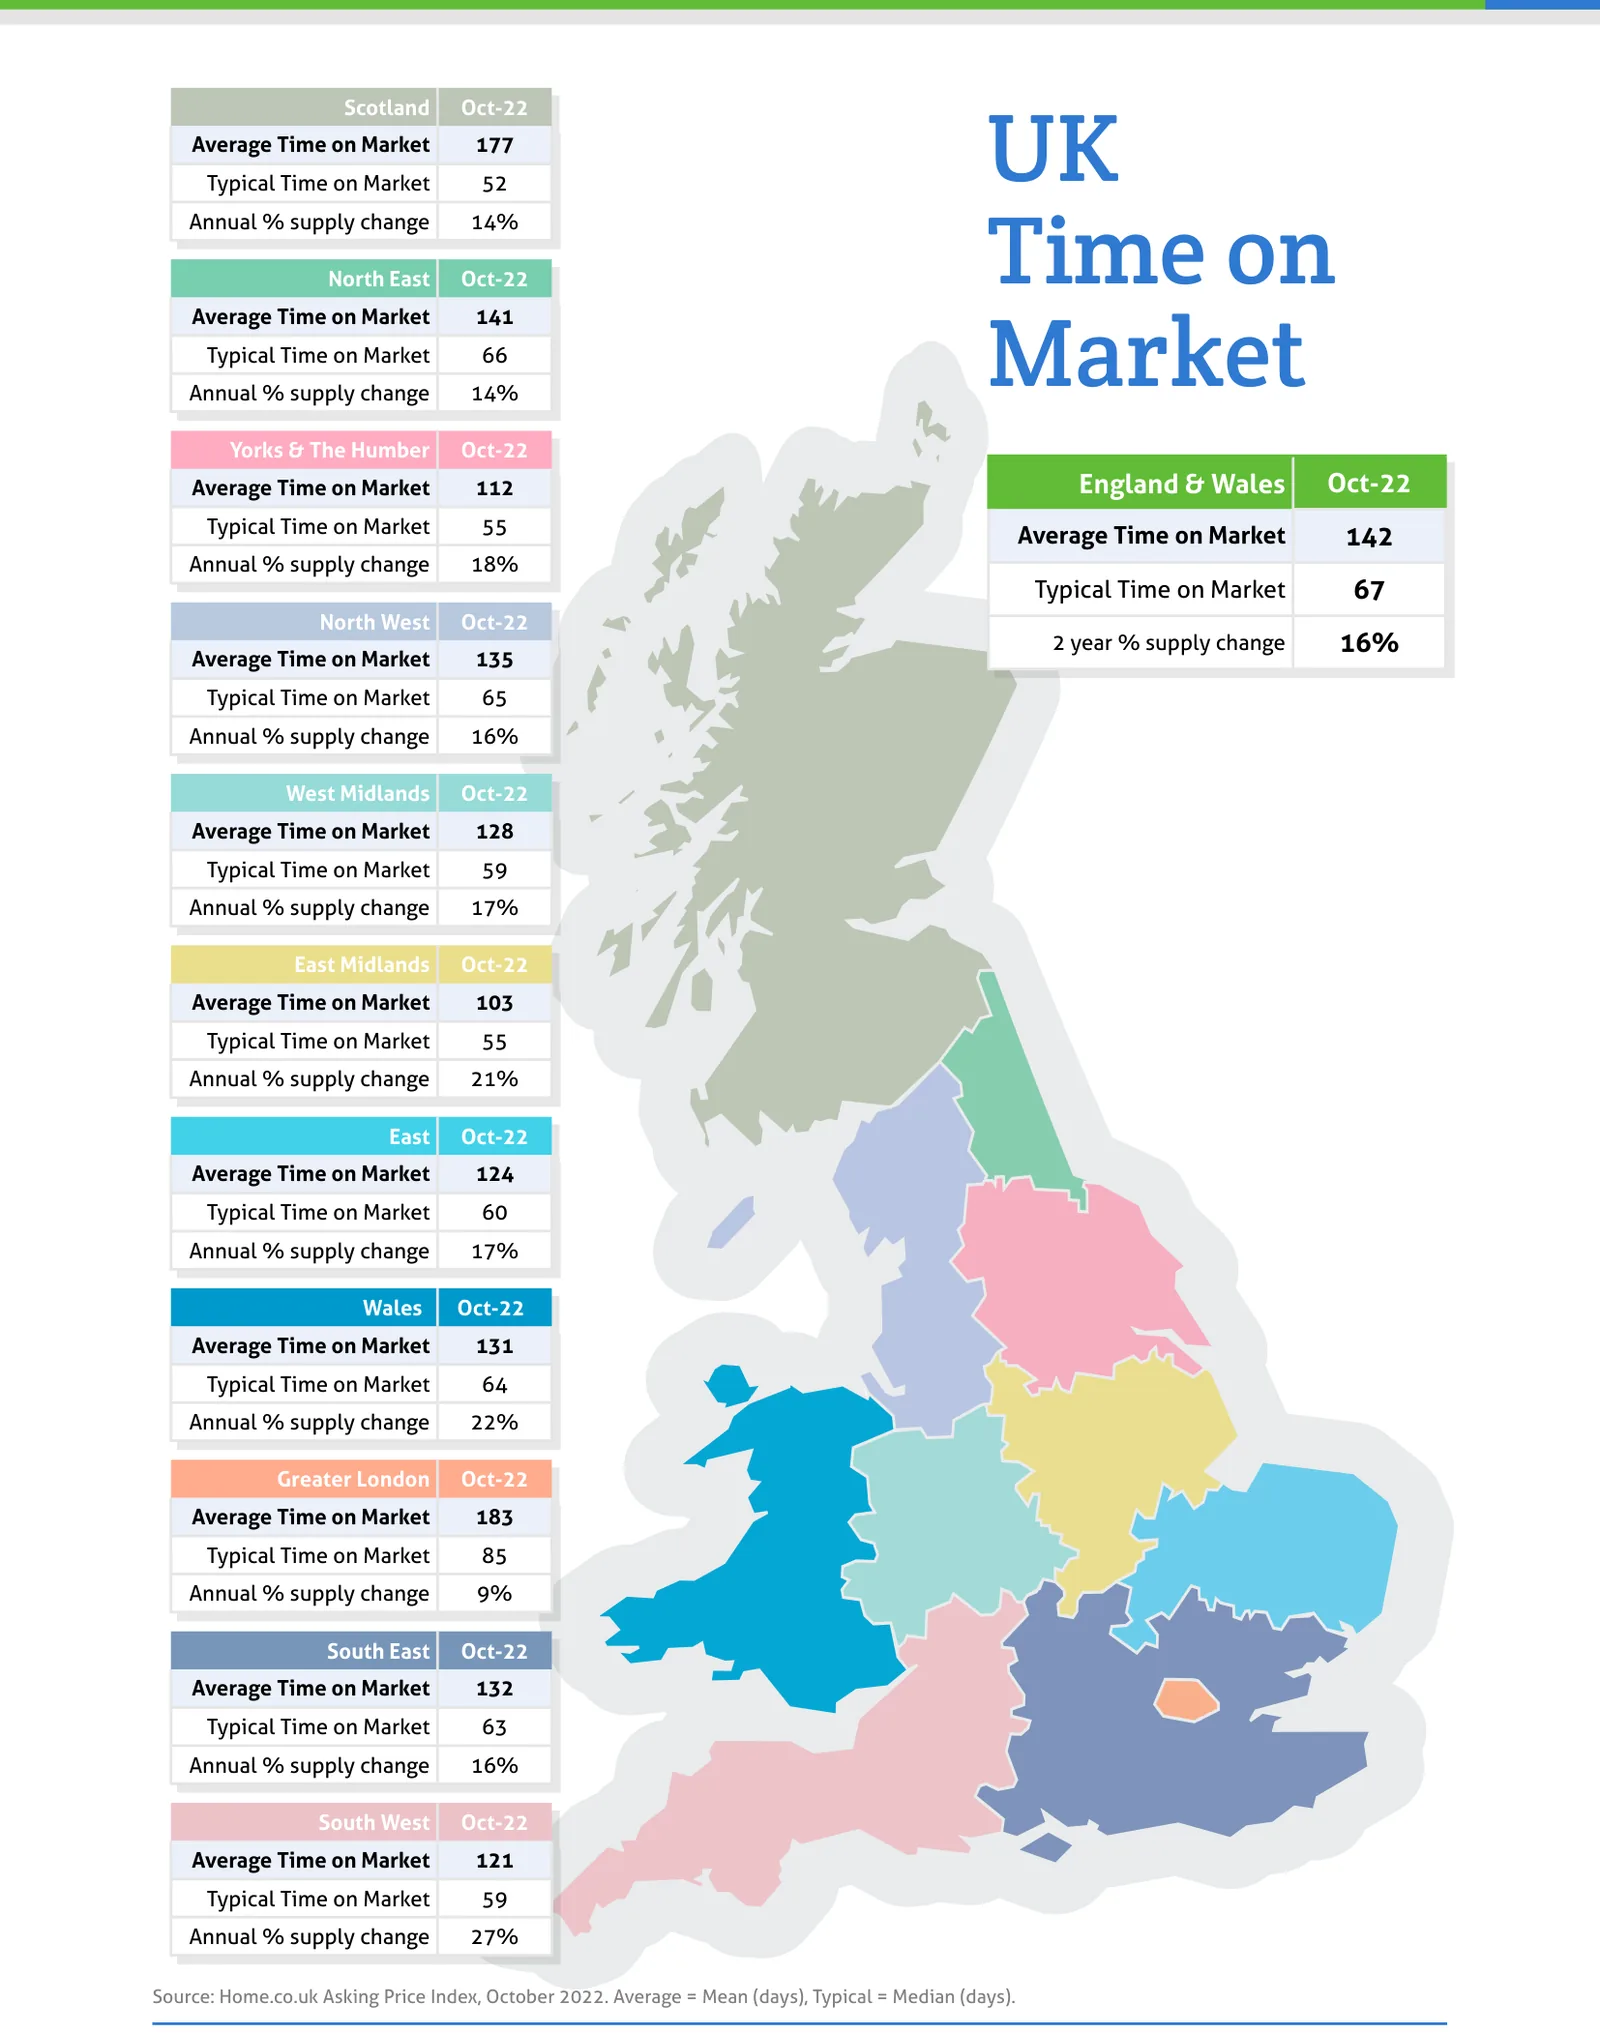
Source: Home.co.uk Asking Price Index, October 2022. Average = Mean (days), Typical = Median (days).
Regional tables
UK Asking Prices, Oct-22
| Region | Average Asking Price | Monthly % change | Annual % change |
|---|---|---|---|
| Scotland | £217,219 | -0.1% | 3.8% |
| North East | £185,592 | -2.0% | 3.7% |
| Yorks & The Humber | £245,932 | 0.0% | 7.0% |
| England & Wales | £359,087 | -0.2% | 3.9% |
| North West | £257,980 | -0.3% | 6.6% |
| West Midlands | £302,994 | -0.1% | 6.6% |
| East Midlands | £290,059 | 0.3% | 5.1% |
| East | £409,135 | -0.1% | 2.3% |
| Wales | £261,886 | -0.7% | 7.2% |
| Greater London | £559,230 | 0.3% | 1.8% |
| South East | £452,420 | -0.4% | 1.5% |
| South West | £388,405 | -0.5% | 5.8% |
UK Time on Market, Oct-22
| Region | Average Time on Market | Typical Time on Market | Annual % supply change |
|---|---|---|---|
| Scotland | 177 | 52 | 14% |
| North East | 141 | 66 | 14% |
| Yorks & The Humber | 112 | 55 | 18% |
| England & Wales | 142 | 67 | |
| North West | 135 | 65 | 16% |
| West Midlands | 128 | 59 | 17% |
| East Midlands | 103 | 55 | 21% |
| East | 124 | 60 | 17% |
| Wales | 131 | 64 | 22% |
| Greater London | 183 | 85 | 9% |
| South East | 132 | 63 | 16% |
| South West | 121 | 59 | 27% |
The report also prints '2 year % supply change' in 1 of its 12 region boxes (England & Wales 16%), so it is not a column of this table.
From the director's commentary
"What a pickle the Bank of England has got itself into by raising interest rates when the economy is already on its knees in the wake of the pandemic."
Doug Shephard, Director at Home.co.uk
Read the full October 2022 edition (PDF, 10 pages)
About the Home Asking Price Index
The Home Asking Price Index measures the change in the prices sellers ask for residential property across England, Wales and Scotland. Today it is computed every month from around half a million advertised homes and is mix-adjusted, so a change in what happens to be on the market does not move the figure; earlier editions state the sample they were built from. Because an asking price is set months before a sale completes, the index runs around five months ahead of completed-sale measures such as the UK House Price Index.
Every edition in the archive, back to October 2006, is listed on the index page. How we measure the UK property market explains the listing data behind it, and today's figures by area are on house prices and rental prices.
Text and figures above are quoted from the October 2022 edition as published, with punctuation normalised for the web, and are not revised. Later editions may restate them.
More in What is happening to house prices: the Home guide
Thinking about your next move?
See what your home's worth in seconds, with the UK's longest-running property data behind it.
Get an instant valuation