

























Home Asking Price Index, October 2021: inflation rise challenges real home price growth
Asking prices across England and Wales rose 0.5% in the month, pushing annual growth to 7.8%, while unsold stock fell to a record low of 260,590.

This is the October 2021 edition of the Home Asking Price Index, released on 13 October 2021, under the headline:
Inflation Rise Challenges Real Home Price Growth
The headlines and summary below are the report's own words, with the key figures as it published them, followed by the report's charts and regional tables as printed.
Headlines
- Despite the end of the stamp duty tax break, asking prices across England and Wales moved up again thanks to low stock and low supply, adding 0.5% since last month and taking the annualised average growth up to 7.8%. However, surging monetary inflation at 5.0% (RPI ex-housing for August) accounts for most of this rise.
- The total stock of property for sale in England and Wales has been eroded further to a new record low of 260,590, 41.1% lower than in October 2020 and 47.1% less than in October 2018.
- Monthly supply of new instructions continues to come in below expectations across the UK (-35% compared to September 2020). The South East is worst hit (-43%) while Greater London, formerly plagued by vast oversupply, indicates a further drop in the number of new instructions (down 42% compared to September 2020).
- The market has gained momentum since our September report with the Typical Time on Market for unsold property in England and Wales falling slightly by two days since last month to 80 days, defying seasonal expectations.
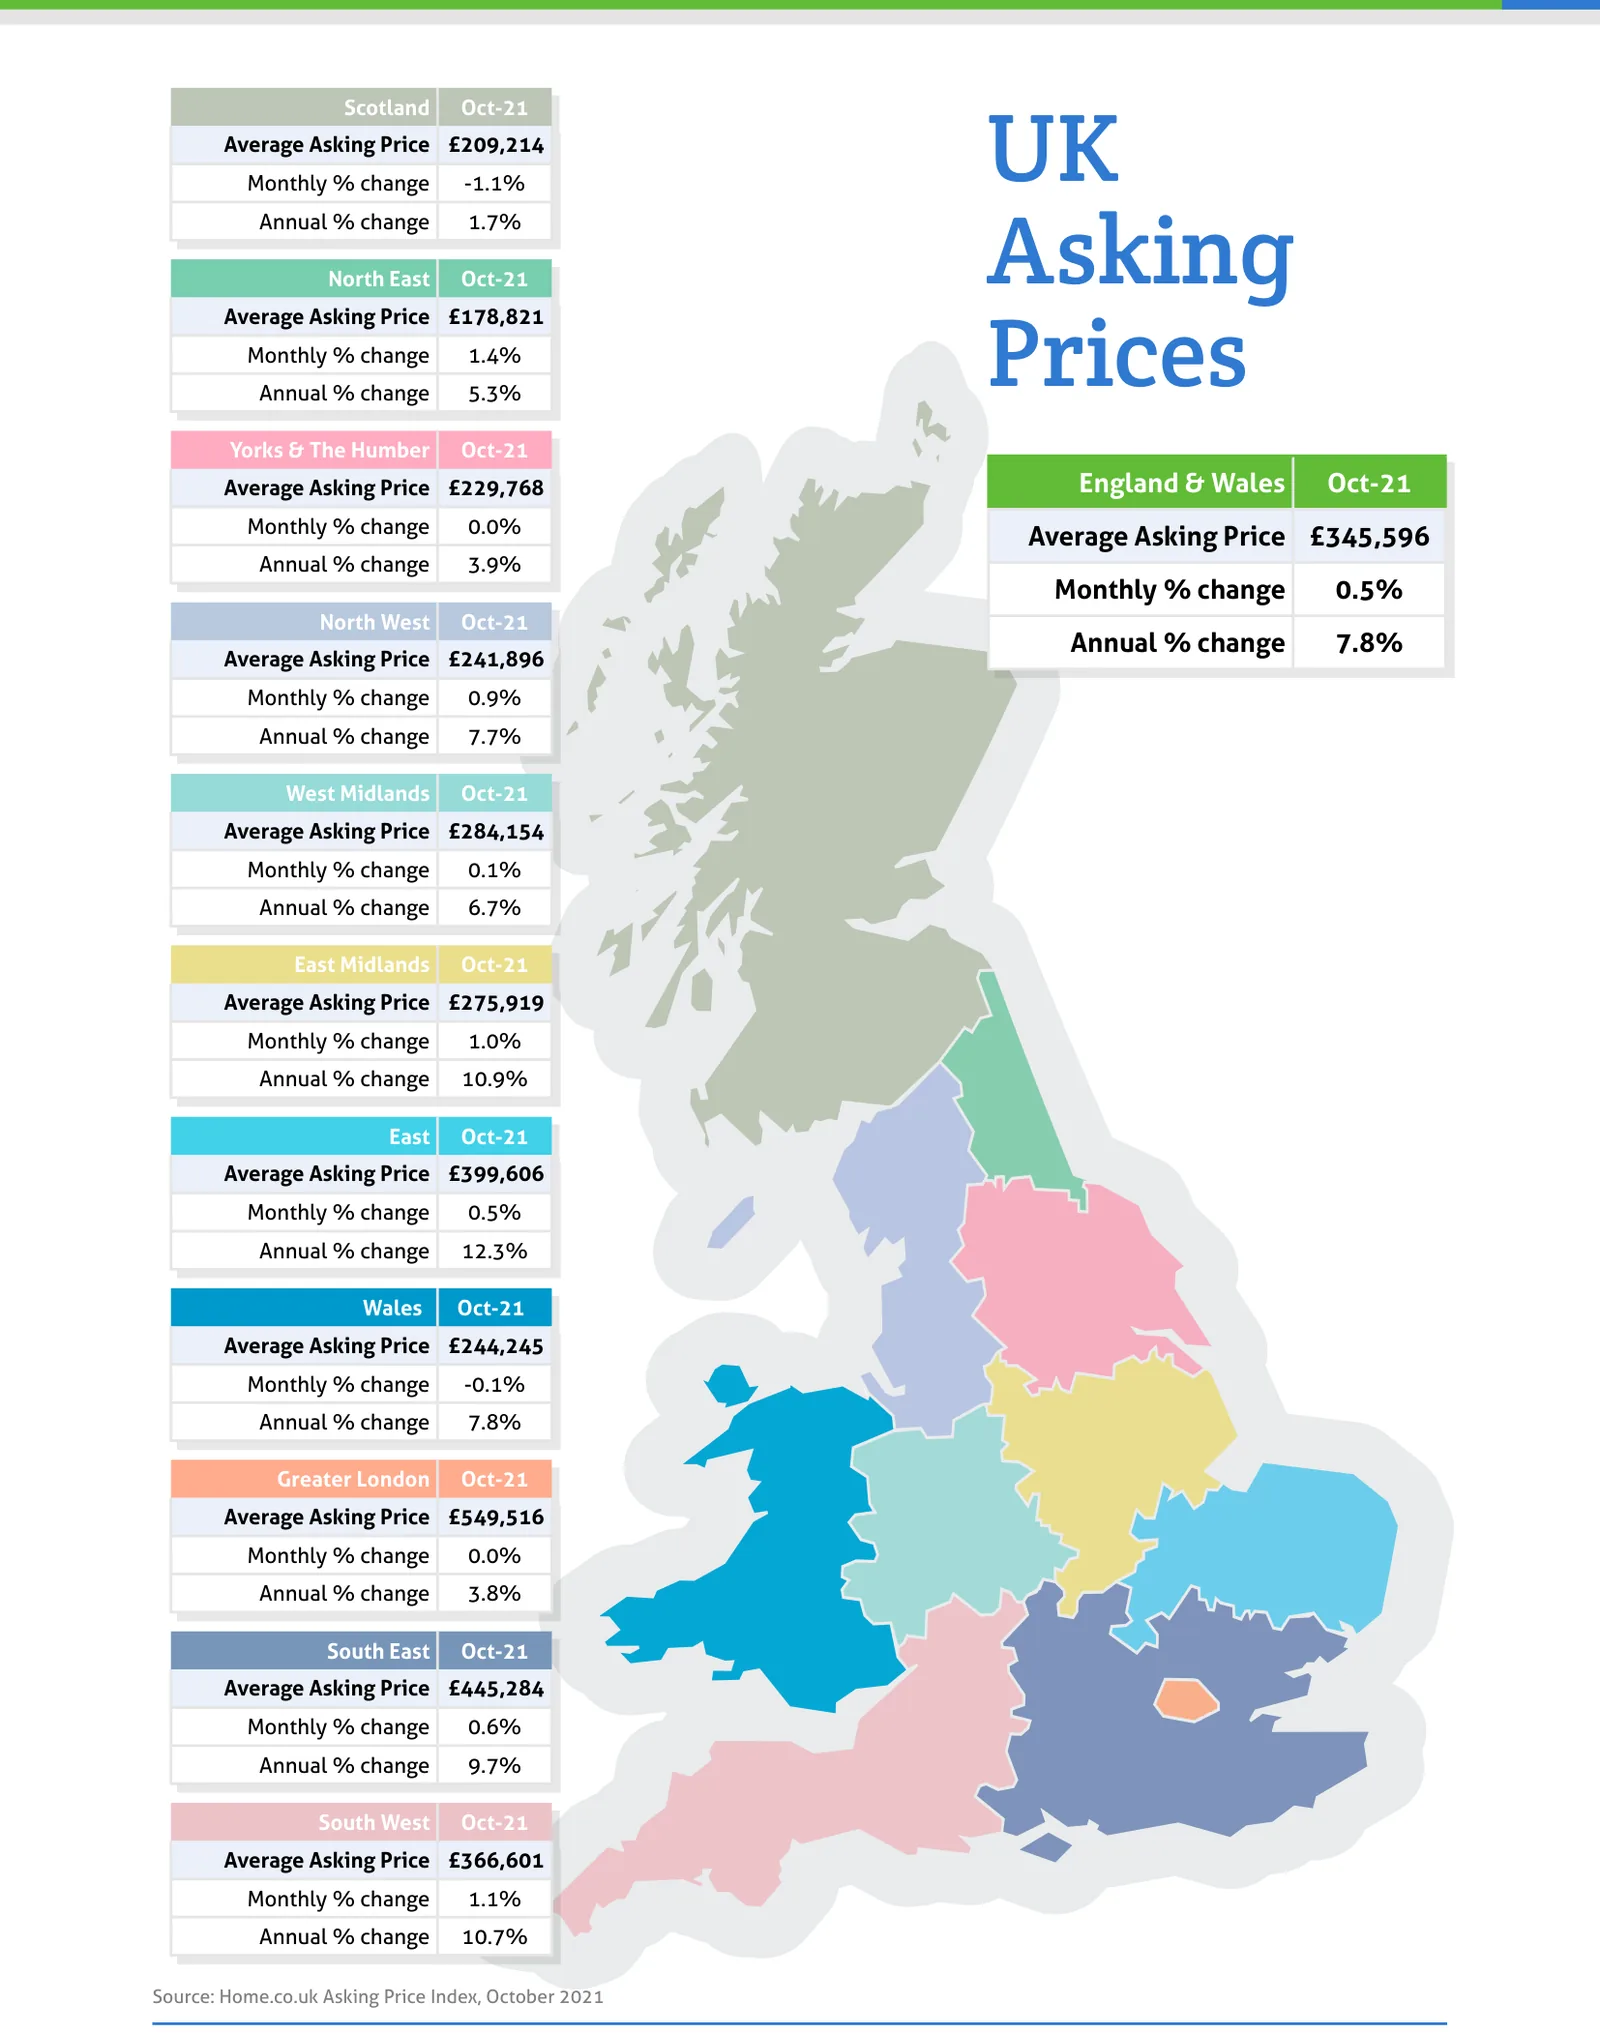
- Low supply and considerable demand continue to push up prices in all English regions except Greater London, which indicates no change since last month. Scottish prices show a serious monthly drop of -1.1%. The largest monthly rise is in the North East of England (+1.4%).
- The East of England property market continues to lead the 12-month regional price growth chart with a staggering gain of 12.3%, followed closely by the East Midlands (+10.9%).
- Greater London is no longer the UK's worst-performing region with 3.8% annualised growth, having been replaced by Scotland where prices have risen only 1.7% over the last year. Yorkshire is now the next worst performer with annualised home price inflation of 3.9%.
- The sales market is now supported by soaring rents in Greater London. Annualised growth in asking rents has now firmly moved into positive territory following the COVID exodus (+11.5%). The greatest rises in asking rents over the last twelve months are in the City (+40.6%), Kensington and Chelsea (+28.7%), Tower Hamlets (+26.6%) and Camden (24.0%), confirming the continued return to city living.
- Scarcity of rental properties persists in all English regions, Scotland and Wales. Rents are up 5.3% across the UK since October 2020. However, despite reduced supply, Scotland and Wales indicate the lowest rental growth (-1.0% and 0.4% respectively).
- The largest annualised average rent hikes remain in the South East of England (+7.3%) and the East (+8.1%).
Summary
Rising inflation, caused by events in the wider economy, threatens to undermine all the gains of the COVID property boom. Three regions now show growth lower than the latest ONS figure (5.0%, RPI ex-housing August) which is probably an underestimate of the current rate of loss of purchasing power of sterling (see comment section).
Over the last year, price growth in the property market has been propelled by the twin tailwinds of low supply and low mortgage interest rates. Added to that, the stamp duty holiday gave significant extra boost and the post-lockdown quest for space increased demand outside of London and other large cities. Scarcity has also driven up rents across most of the UK and supply continues to dwindle.
Across most of the UK, scarcity continues to push up both prices and rents. However, Scotland is now indicating that affordability limits have been reached in both sales and rental markets despite relatively low supply. The number of new instructions entering the UK sales market continues to be low compared to pre-COVID levels (down 7% September 2021 vs. September 2019). The number of newly available rental properties entering the market is also down considerably across the UK (down 31% September 2021 vs. September 2020).
Key figures
| Measure | Figure |
|---|---|
| Monthly change in asking prices (England and Wales) | +0.5% |
| Annual change in asking prices (England and Wales) | +7.8% |
| Total unsold stock (England and Wales) | 260,590 |
| Typical Time on Market (England and Wales) | 80 days |
| Monthly supply of new instructions (UK) | -35% |
| Annual change in asking rents (UK) | +5.3% |
| New instructions vs September 2019 (UK) | -7% |
| New rental instructions vs September 2020 (UK) | -31% |
Figures are for England and Wales unless the report states otherwise, as published in the edition.
Charts from the report
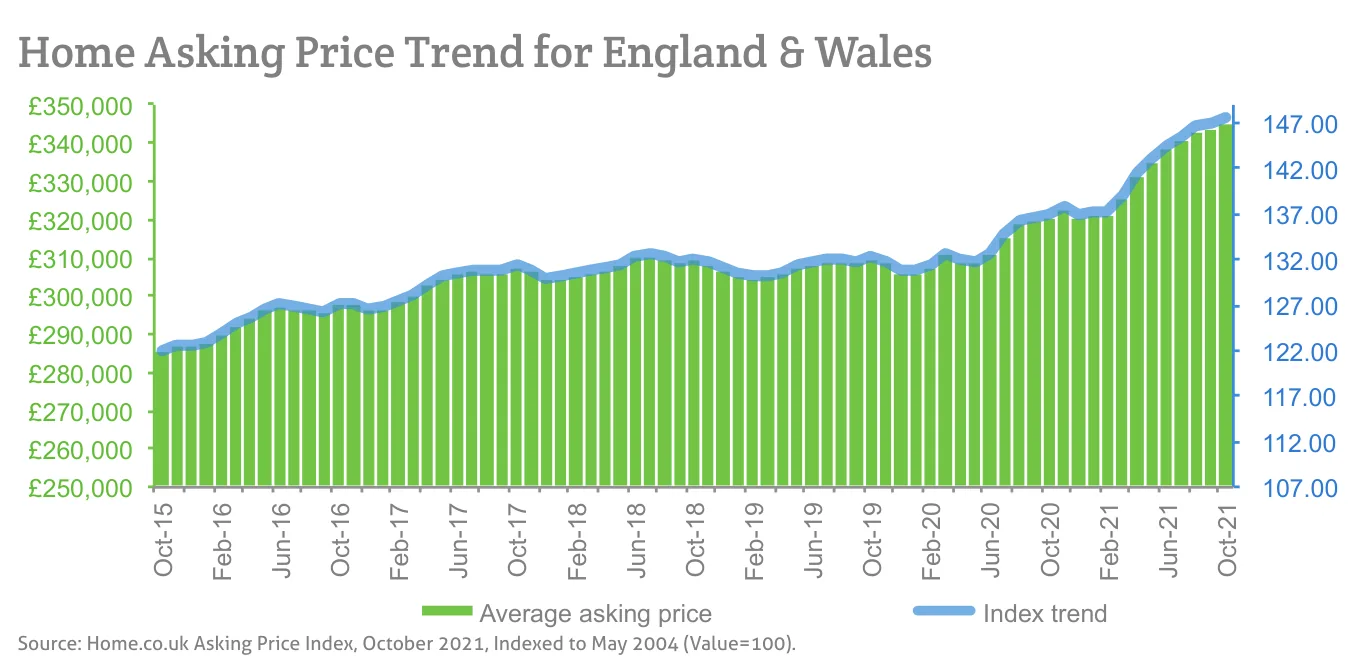
Source: Home.co.uk Asking Price Index, October 2021, Indexed to May 2004 (Value=100).
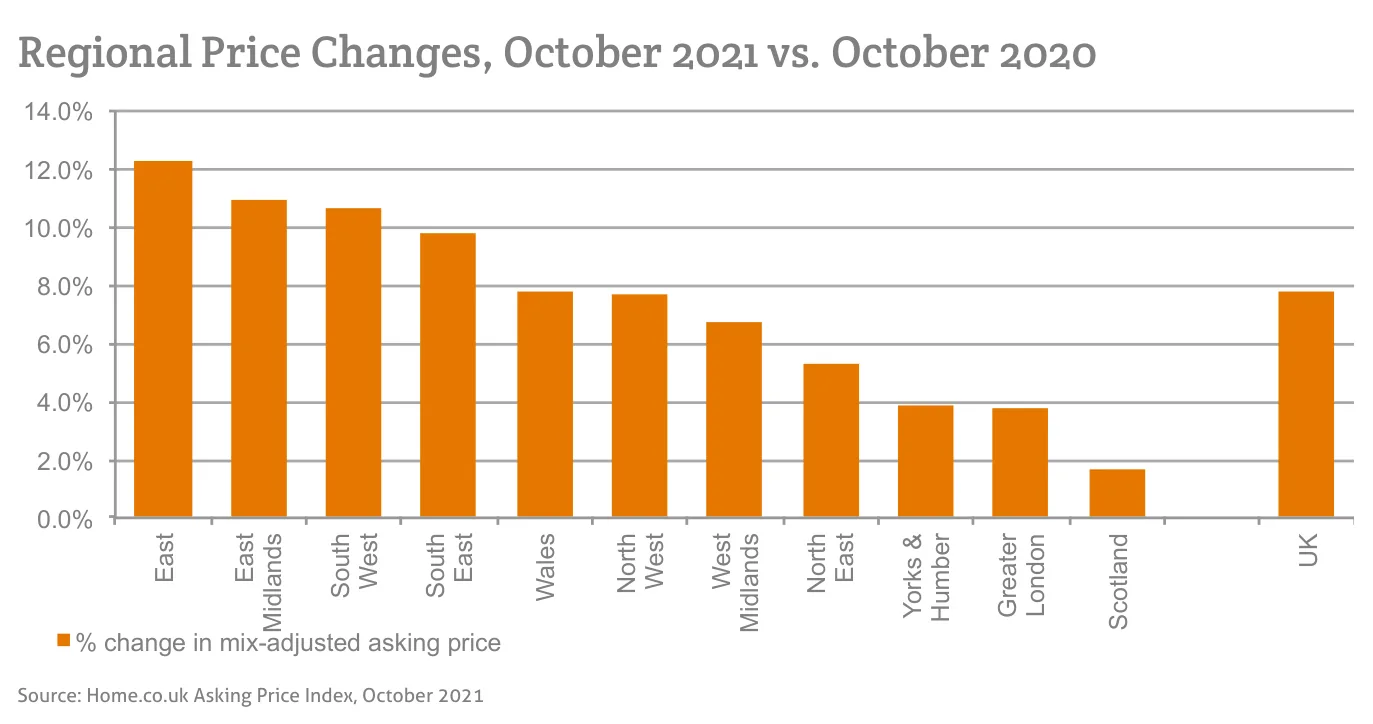
Source: Home.co.uk Asking Price Index, October 2021
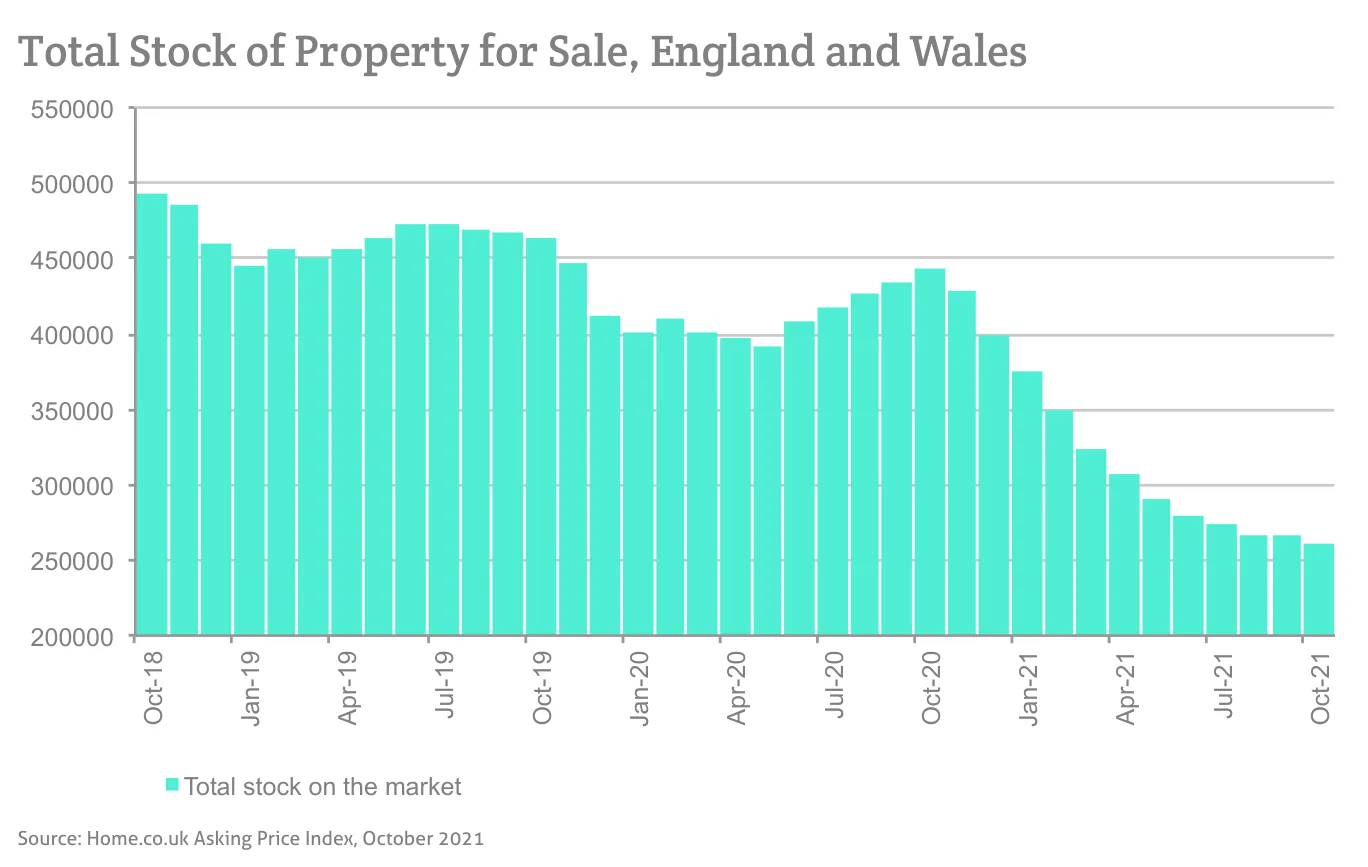
Source: Home.co.uk Asking Price Index, October 2021
Source: Home.co.uk Asking Price Index, October 2021
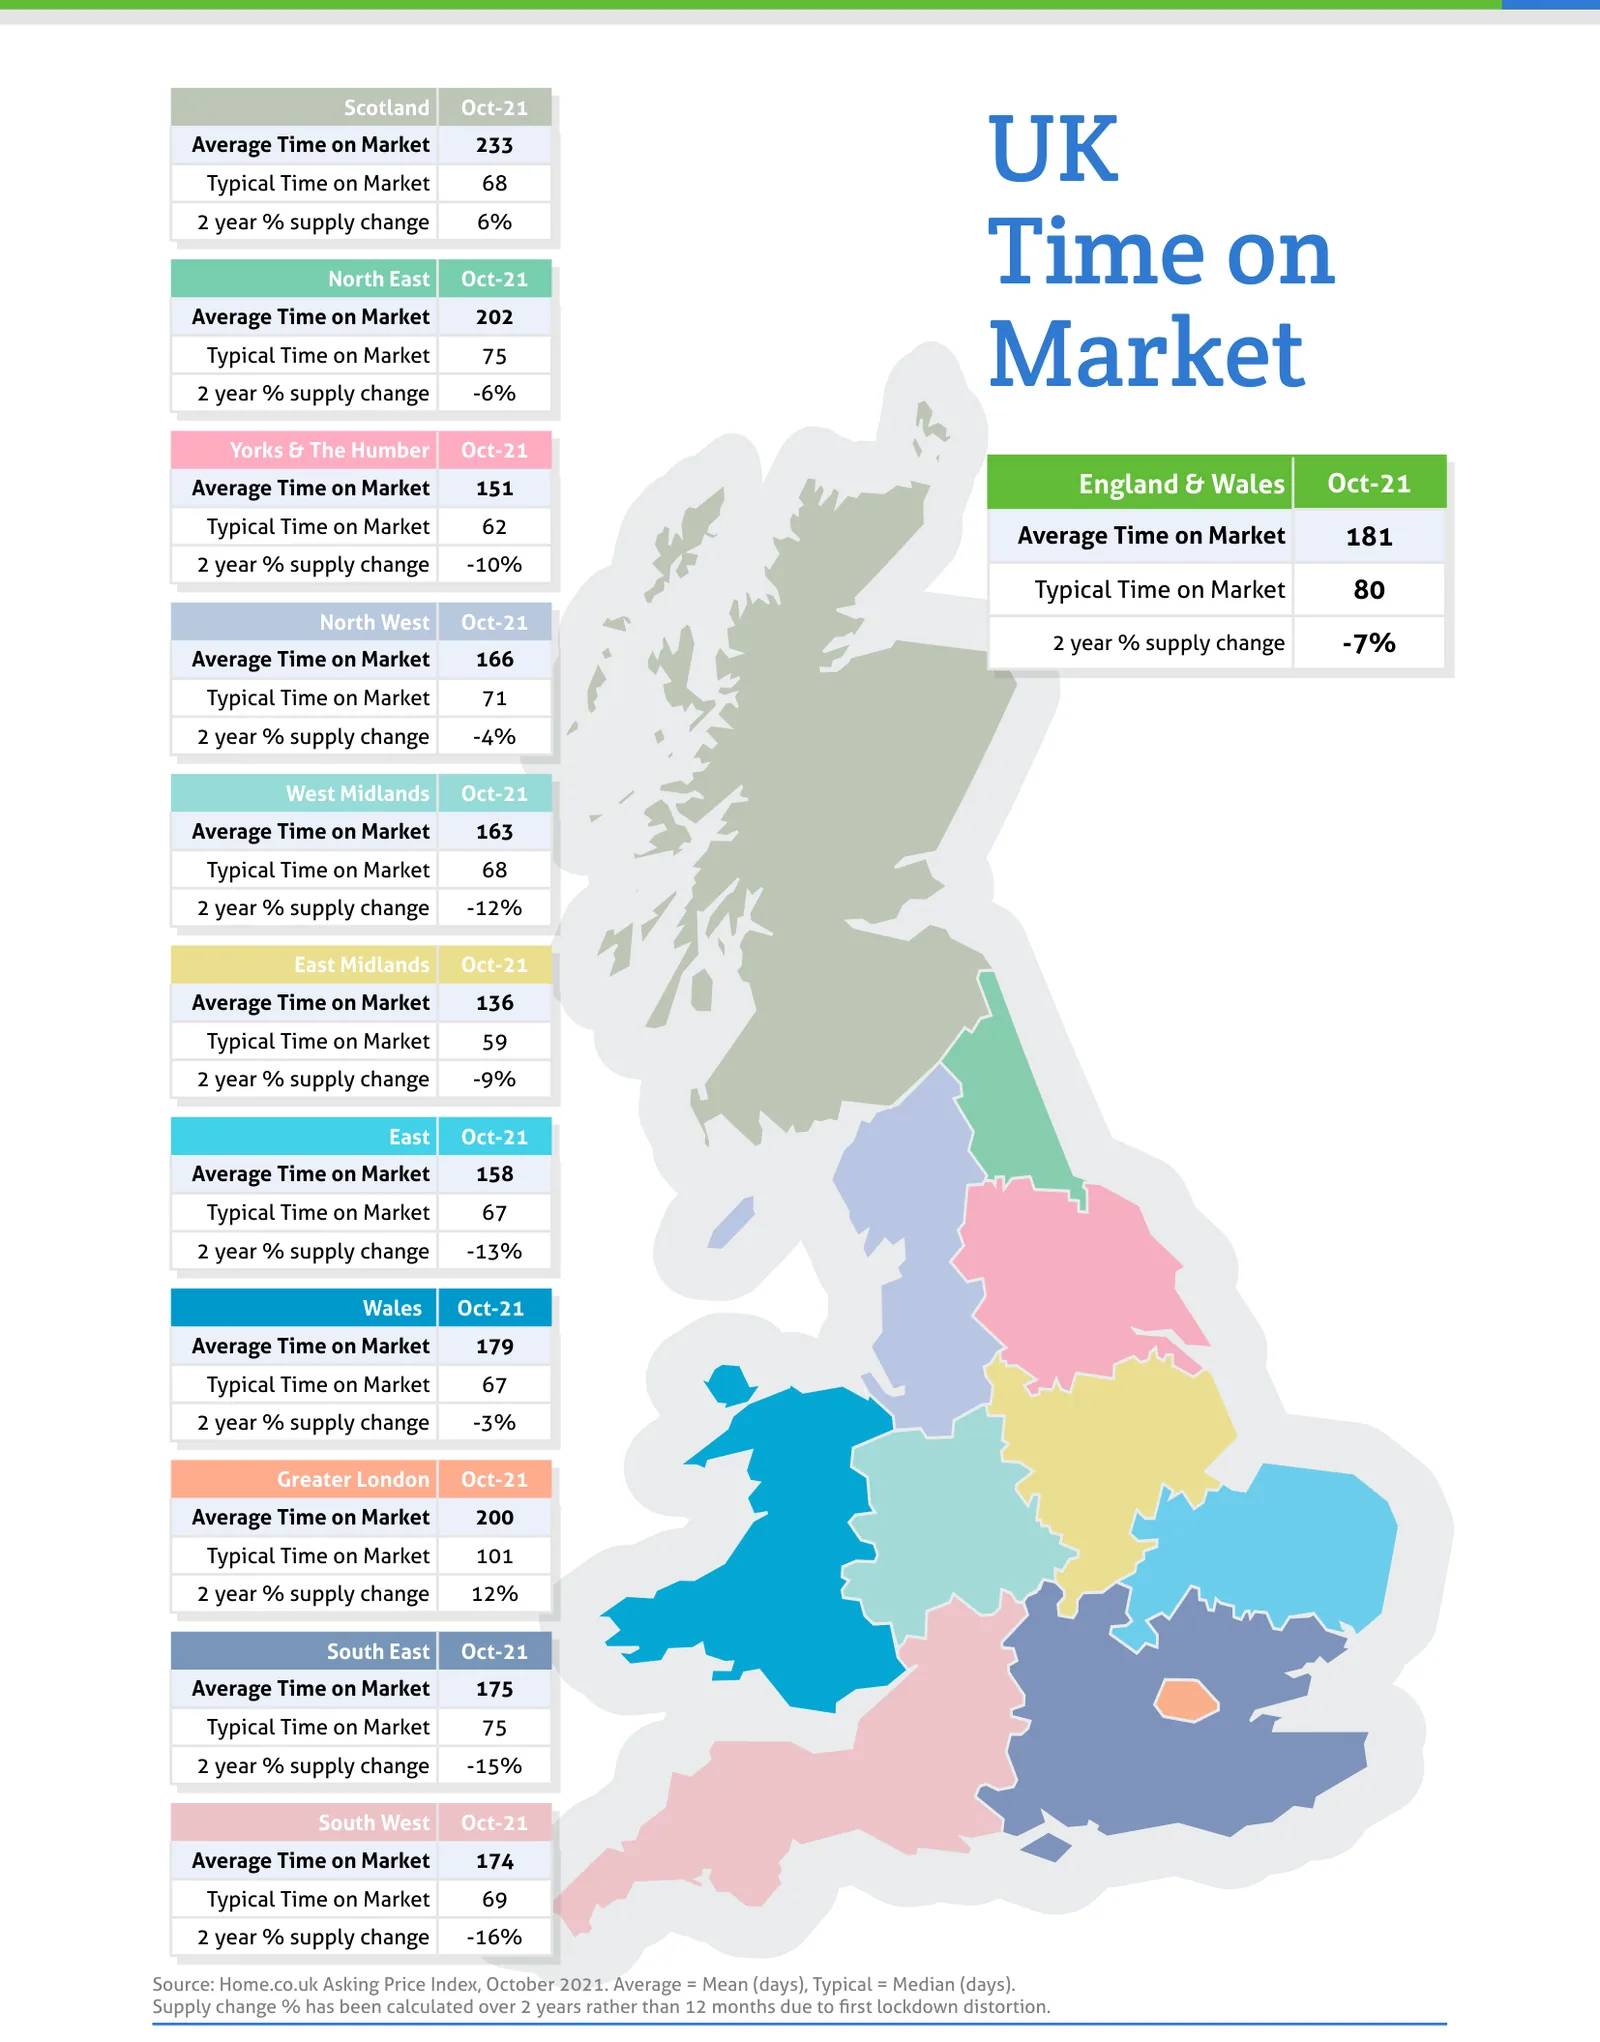
Source: Home.co.uk Asking Price Index, October 2021. Average = Mean (days), Typical = Median (days).
Regional tables
UK Asking Prices, Oct-21
| Region | Average Asking Price | Monthly % change | Annual % change |
|---|---|---|---|
| Scotland | £209,214 | -1.1% | 1.7% |
| North East | £178,821 | 1.4% | 5.3% |
| Yorks & The Humber | £229,768 | 0.0% | 3.9% |
| England & Wales | £345,596 | 0.5% | 7.8% |
| North West | £241,896 | 0.9% | 7.7% |
| West Midlands | £284,154 | 0.1% | 6.7% |
| East Midlands | £275,919 | 1.0% | 10.9% |
| East | £399,606 | 0.5% | 12.3% |
| Wales | £244,245 | -0.1% | 7.8% |
| Greater London | £549,516 | 0.0% | 3.8% |
| South East | £445,284 | 0.6% | 9.7% |
| South West | £366,601 | 1.1% | 10.7% |
UK Time on Market, Oct-21
| Region | Average Time on Market | Typical Time on Market | 2 year % supply change |
|---|---|---|---|
| Scotland | 233 | 68 | 6% |
| North East | 202 | 75 | -6% |
| Yorks & The Humber | 151 | 62 | -10% |
| England & Wales | 181 | 80 | -7% |
| North West | 166 | 71 | -4% |
| West Midlands | 163 | 68 | -12% |
| East Midlands | 136 | 59 | -9% |
| East | 158 | 67 | -13% |
| Wales | 179 | 67 | -3% |
| Greater London | 200 | 101 | 12% |
| South East | 175 | 75 | -15% |
| South West | 174 | 69 | -16% |
From the director's commentary
"It doesn't matter that prices are going up; it matters that home prices need to rise faster than inflation or you are losing purchasing power in your capital invested. Having one's capital tied up in an asset that is falling in value in real terms is painful and ultimately a malinvestment."
Doug Shephard, Director at Home.co.uk
Read the full October 2021 edition (PDF, 7 pages)
About the Home Asking Price Index
The Home Asking Price Index measures the change in the prices sellers ask for residential property across England, Wales and Scotland. Today it is computed every month from around half a million advertised homes and is mix-adjusted, so a change in what happens to be on the market does not move the figure; earlier editions state the sample they were built from. Because an asking price is set months before a sale completes, the index runs around five months ahead of completed-sale measures such as the UK House Price Index.
Every edition in the archive, back to October 2006, is listed on the index page. How we measure the UK property market explains the listing data behind it, and today's figures by area are on house prices and rental prices.
Text and figures above are quoted from the October 2021 edition as published, with punctuation normalised for the web, and are not revised. Later editions may restate them.
More in What is happening to house prices: the Home guide
Thinking about your next move?
See what your home's worth in seconds, with the UK's longest-running property data behind it.
Get an instant valuation