

























Home Asking Price Index, October 2019: reluctant vendors cut supply and boost home prices
Asking prices across England and Wales rose 0.3% in October as UK supply fell 17% year-on-year, lifting annual growth to +0.1%.

This is the October 2019 edition of the Home Asking Price Index, released on 15 October 2019, under the headline:
Reluctant Vendors Cut Supply and Boost Home Prices
The headlines and summary below are the report's own words, with the key figures as it published them, followed by the report's charts and regional tables as printed.
Headlines
- The supply of new sales instructions has reduced in all regions, with the biggest drop in London of 33% (Sept 2019 vs. Sept 2018), as vendors fail to commit fearing Brexit fallout.
- This sudden supply shortage has consequently served to support prices. Since last month, asking price rises have been observed in every region except the North East.
- Overall, prices rose 0.3% across England and Wales.
- Stock levels are down further in London (-21% year-on-year), emboldening vendors when setting the asking price (up 0.2% month-on-month).
- Supply of new instructions is down 17% overall (year-on-year, UK).
Summary
London takes the spotlight again this month as risk aversion on the part of vendors leads to a massive drop in supply. Moreover, the capital is not alone; sudden supply drops are apparent in many regions and, nationally, supply is down 17% year-on-year as approximately one in six vendors sits on their hands.
The acute drop in supply, born of Brexit woes, is affecting all regions. Most show double-figure percentage drops year-on-year, with only two regions (West Midlands and Yorkshire) showing single-figure drops of 5% and 7% respectively. Of course, these shortages look tiny when compared to London's massive 33% fall, but all such reductions in supply will bolster both vendors' and agents' confidence when setting the asking price (see chart).
Meanwhile, low and falling rental stock levels are initiating a surge in rent hikes, led by seven key boroughs. Wandsworth, Hackney, Haringey, Hammersmith and Fulham, Sutton, Brent and Islington are all showing double-digit rent inflation, yields are soaring and, consequently, property prices look set to surge over the next twelve months and beyond. In fact, asking prices are already beginning to follow rents upward in Wandsworth, Hammersmith and Fulham, Sutton, Brent and Islington.
Key figures
| Measure | Figure |
|---|---|
| Annual price growth (England & Wales) | +0.1% |
| Monthly price change (England & Wales) | +0.3% |
| Total stock levels change (England & Wales) | -5.8% |
| Typical Time on Market (England & Wales) | 99 days |
| New instructions change (UK) | -17% |
Figures are for England and Wales unless the report states otherwise, as published in the edition.
Charts from the report
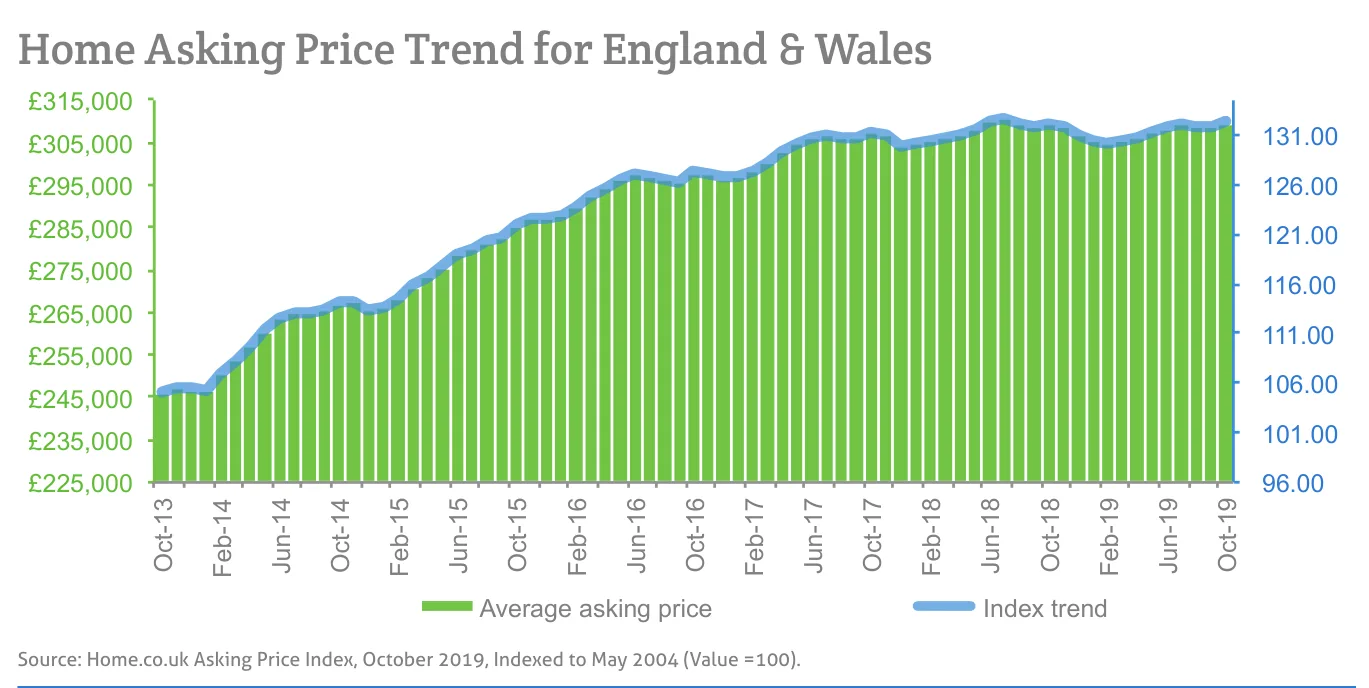
Source: Home.co.uk Asking Price Index, October 2019, Indexed to May 2004 (Value =100).
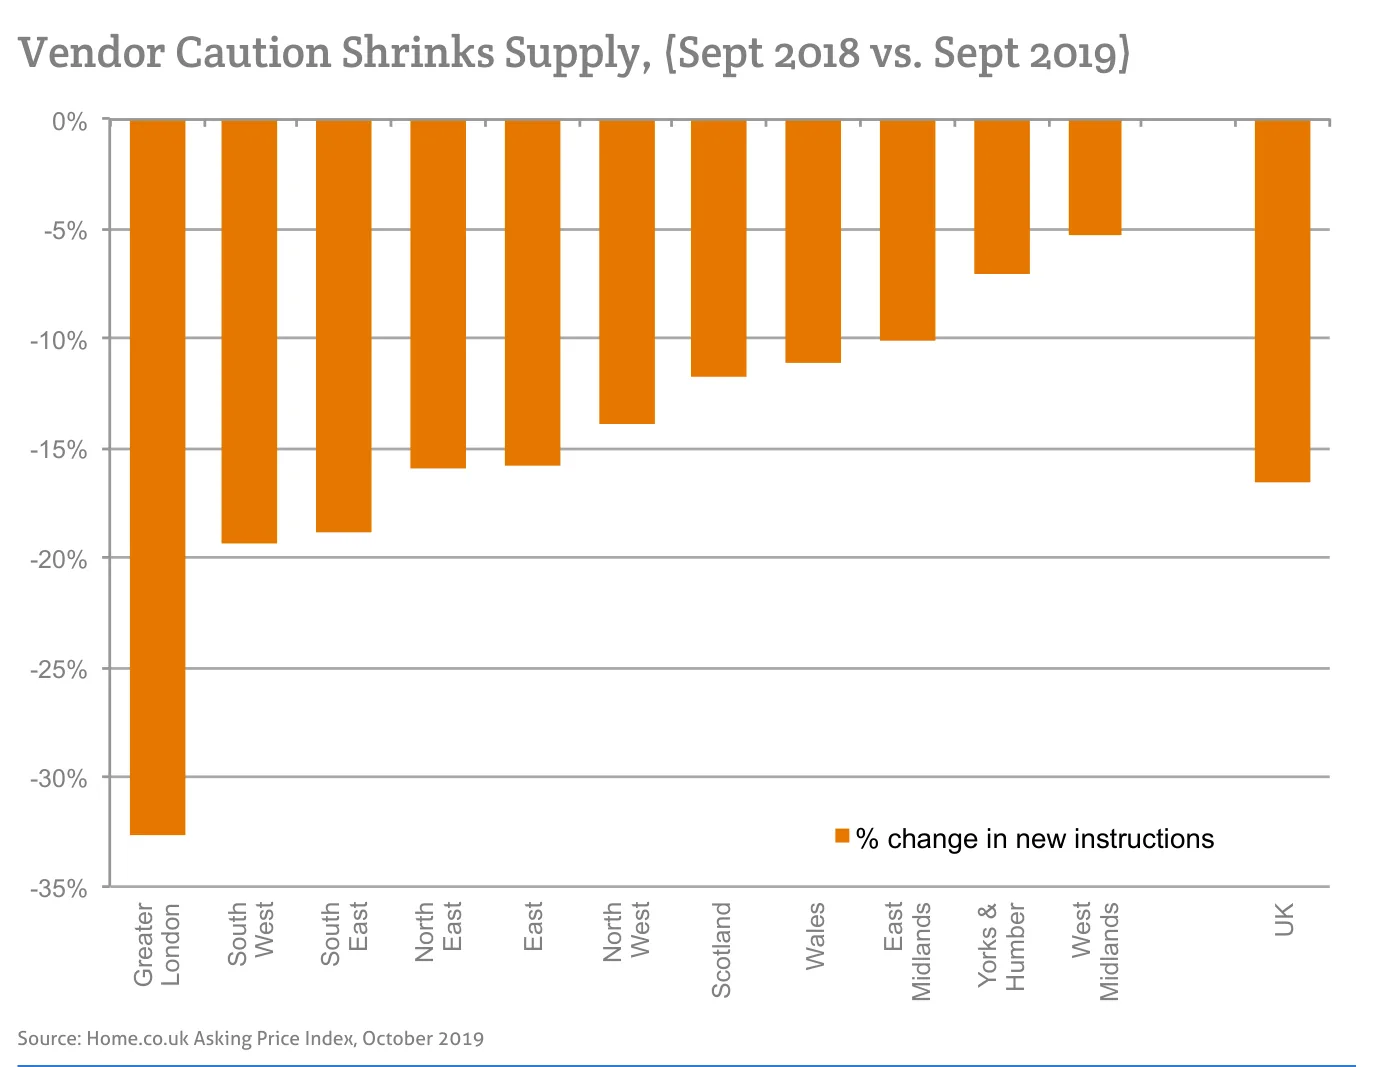
Source: Home.co.uk Asking Price Index, October 2019
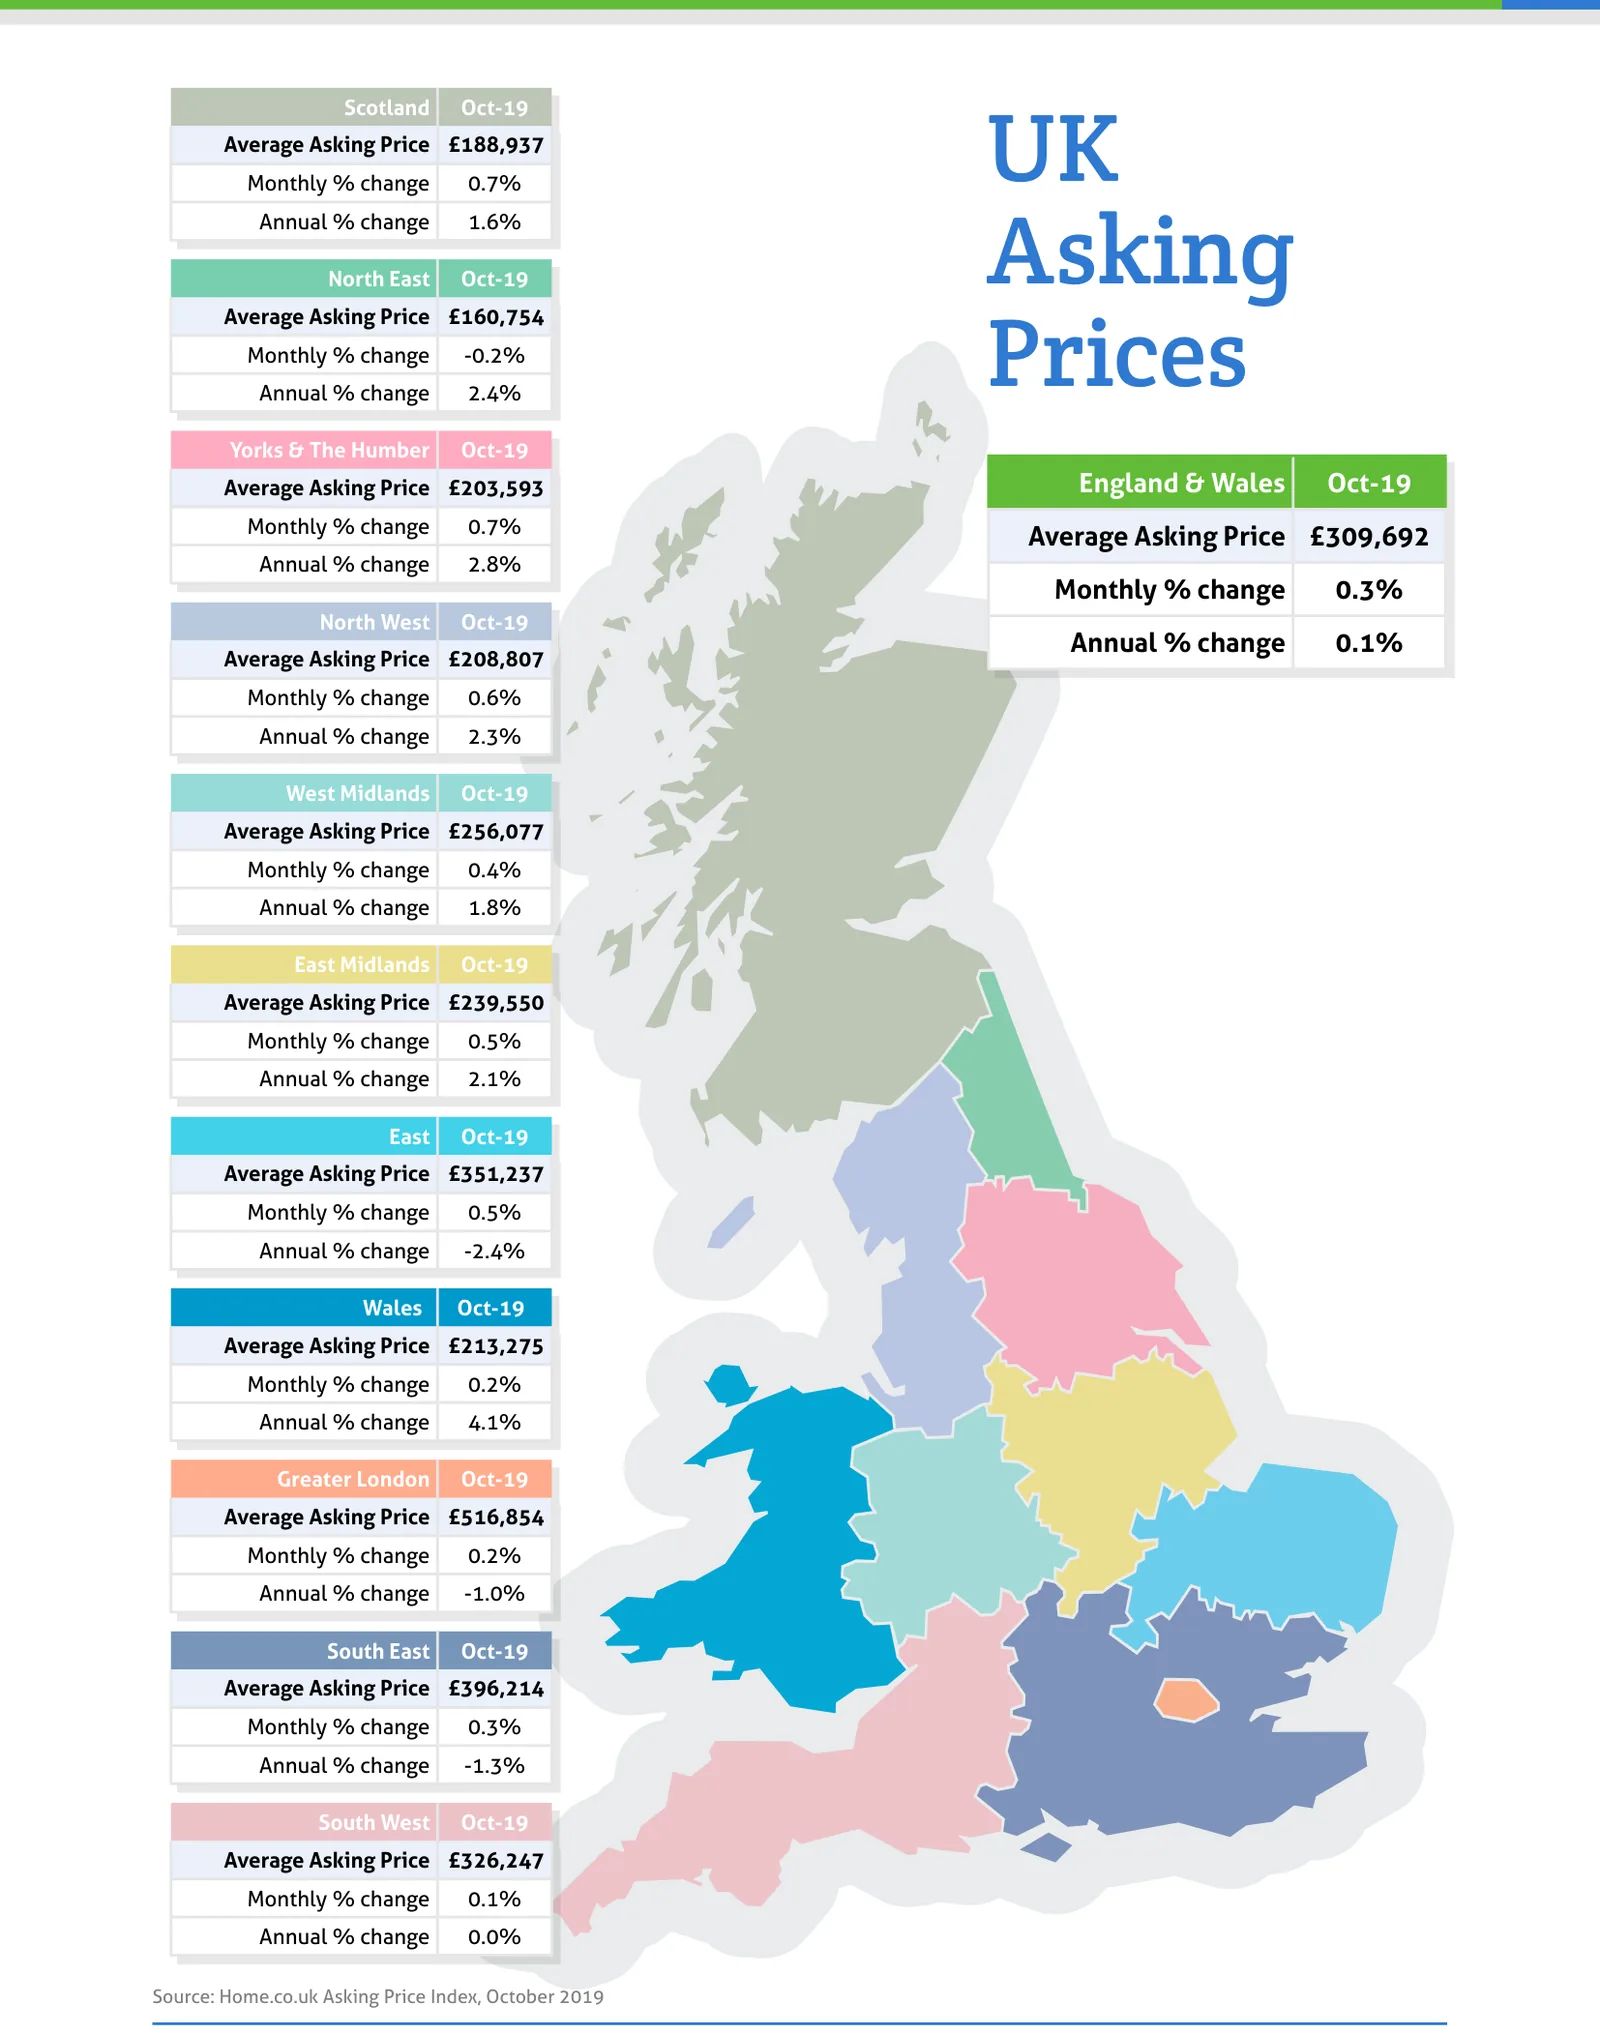
Source: Home.co.uk Asking Price Index, October 2019
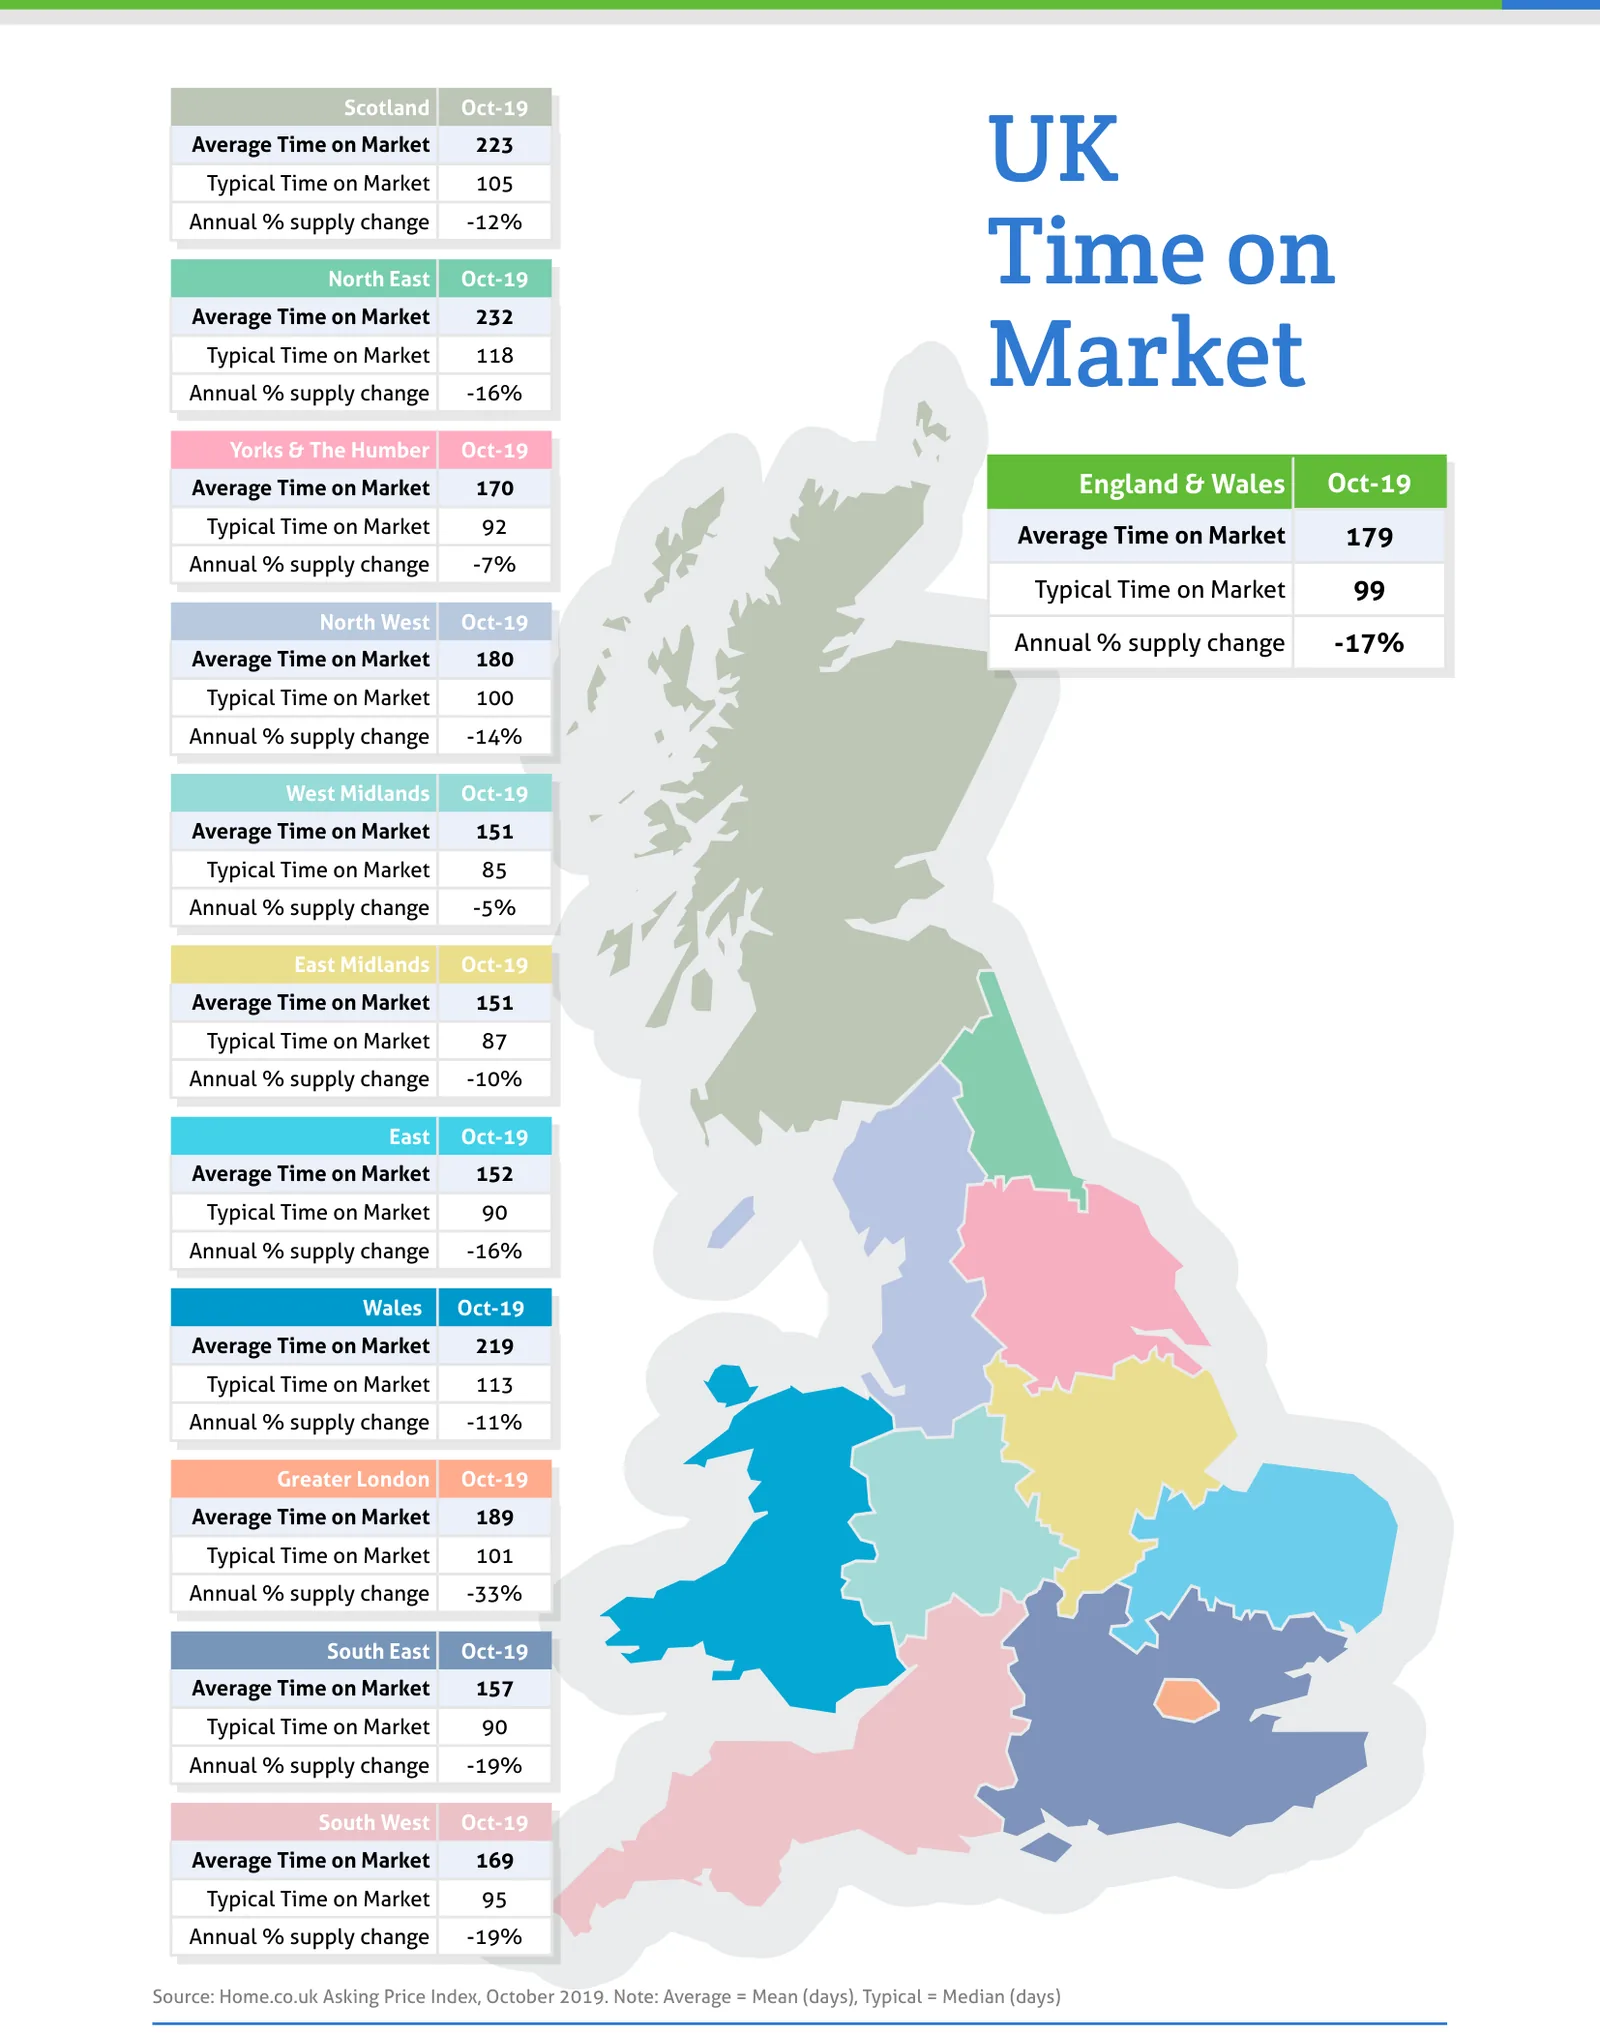
Source: Home.co.uk Asking Price Index, October 2019. Note: Average = Mean (days), Typical = Median (days)
Regional tables
UK Asking Prices, Oct-19
| Region | Average Asking Price | Monthly % change | Annual % change |
|---|---|---|---|
| Scotland | £188,937 | 0.7% | 1.6% |
| North East | £160,754 | -0.2% | 2.4% |
| Yorks & The Humber | £203,593 | 0.7% | 2.8% |
| England & Wales | £309,692 | 0.3% | 0.1% |
| North West | £208,807 | 0.6% | 2.3% |
| West Midlands | £256,077 | 0.4% | 1.8% |
| East Midlands | £239,550 | 0.5% | 2.1% |
| East | £351,237 | 0.5% | -2.4% |
| Wales | £213,275 | 0.2% | 4.1% |
| Greater London | £516,854 | 0.2% | -1.0% |
| South East | £396,214 | 0.3% | -1.3% |
| South West | £326,247 | 0.1% | 0.0% |
UK Time on Market, Oct-19
| Region | Average Time on Market | Typical Time on Market | Annual % supply change |
|---|---|---|---|
| Scotland | 223 | 105 | -12% |
| North East | 232 | 118 | -16% |
| Yorks & The Humber | 170 | 92 | -7% |
| England & Wales | 179 | 99 | -17% |
| North West | 180 | 100 | -14% |
| West Midlands | 151 | 85 | -5% |
| East Midlands | 151 | 87 | -10% |
| East | 152 | 90 | -16% |
| Wales | 219 | 113 | -11% |
| Greater London | 189 | 101 | -33% |
| South East | 157 | 90 | -19% |
| South West | 169 | 95 | -19% |
From the director's commentary
"Brexit jitters have slashed supply across the UK. No one predicted this: a result of extreme caution on the part of potential sellers."
Doug Shephard, Director at Home.co.uk
Read the full October 2019 edition (PDF, 7 pages)
About the Home Asking Price Index
The Home Asking Price Index measures the change in the prices sellers ask for residential property across England, Wales and Scotland. Today it is computed every month from around half a million advertised homes and is mix-adjusted, so a change in what happens to be on the market does not move the figure; earlier editions state the sample they were built from. Because an asking price is set months before a sale completes, the index runs around five months ahead of completed-sale measures such as the UK House Price Index.
Every edition in the archive, back to October 2006, is listed on the index page. How we measure the UK property market explains the listing data behind it, and today's figures by area are on house prices and rental prices.
Text and figures above are quoted from the October 2019 edition as published, with punctuation normalised for the web, and are not revised. Later editions may restate them.
More in What is happening to house prices: the Home guide
Thinking about your next move?
See what your home's worth in seconds, with the UK's longest-running property data behind it.
Get an instant valuation