

























Home Asking Price Index, October 2018: price cutting hits 7-year high as vendors' patience wanes
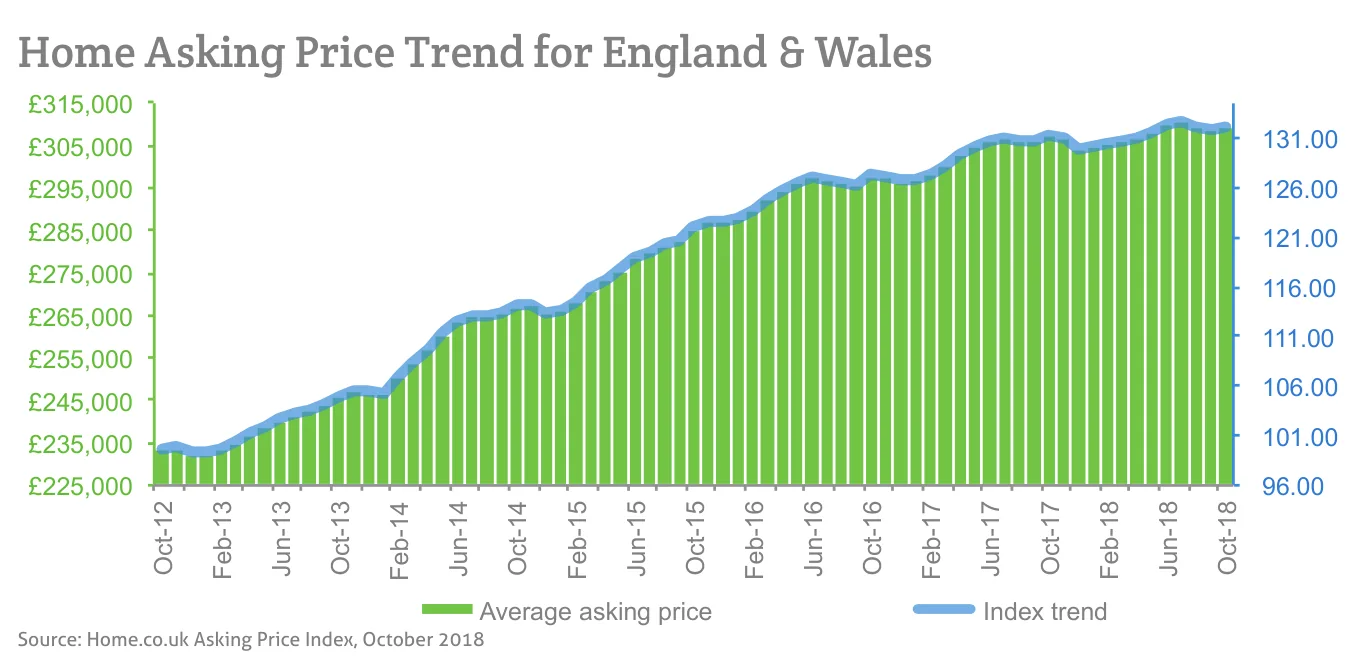
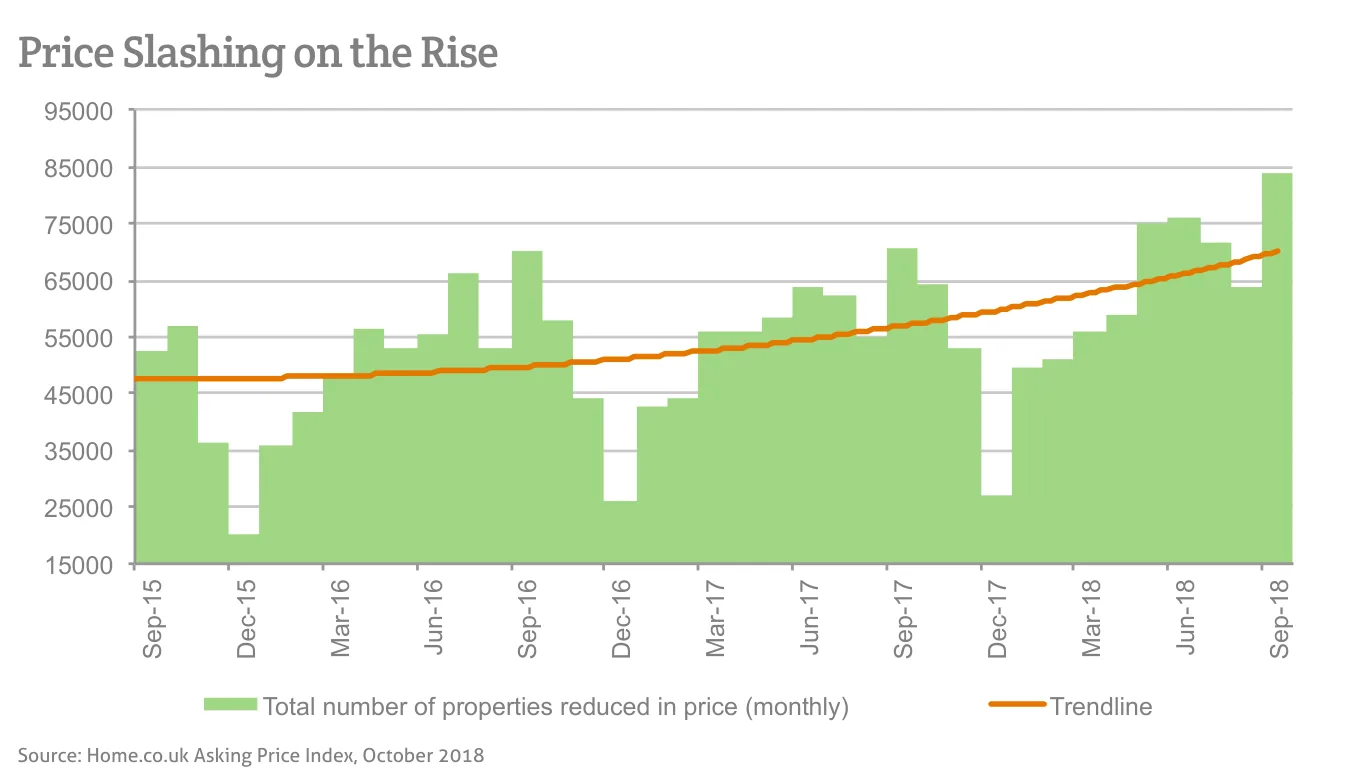
Price reductions across England and Wales reached a seven-year high in September, even as average asking prices edged up 0.2% and annual growth slowed to just 0.6%.

This is the October 2018 edition of the Home Asking Price Index, released on 12 October 2018, under the headline:
Price Cutting Hits 7-Year High as Vendors' Patience Wanes
The headlines and summary below are the report's own words, with the key figures as it published them, followed by the report's charts and regional tables as printed.
Headlines
- The total number of properties that had their asking prices reduced in September soared to levels last seen in September 2011 (83,780 in mainland UK).
- 16% of properties currently for sale have had their prices reduced in the last 30 days (England and Wales): a percentage last seen in the dark days of January 2009.
- Despite this, home prices in England and Wales actually nudged up by 0.2% this month, buoyed by euphoric rises in the booming West Midlands and Yorkshire regions.
- The largest monthly slide was in Greater London (-0.4%), where prices have now fallen a total of 5.6% since their peak in May 2016.
- Supply increases indicate a worsening market for vendors: up by 6% year-on-year (YoY) and the highest September total since 2012.
- The mix-adjusted average price growth for England and Wales slid to a mere 0.6% year-on-year, far below the rate of monetary inflation.
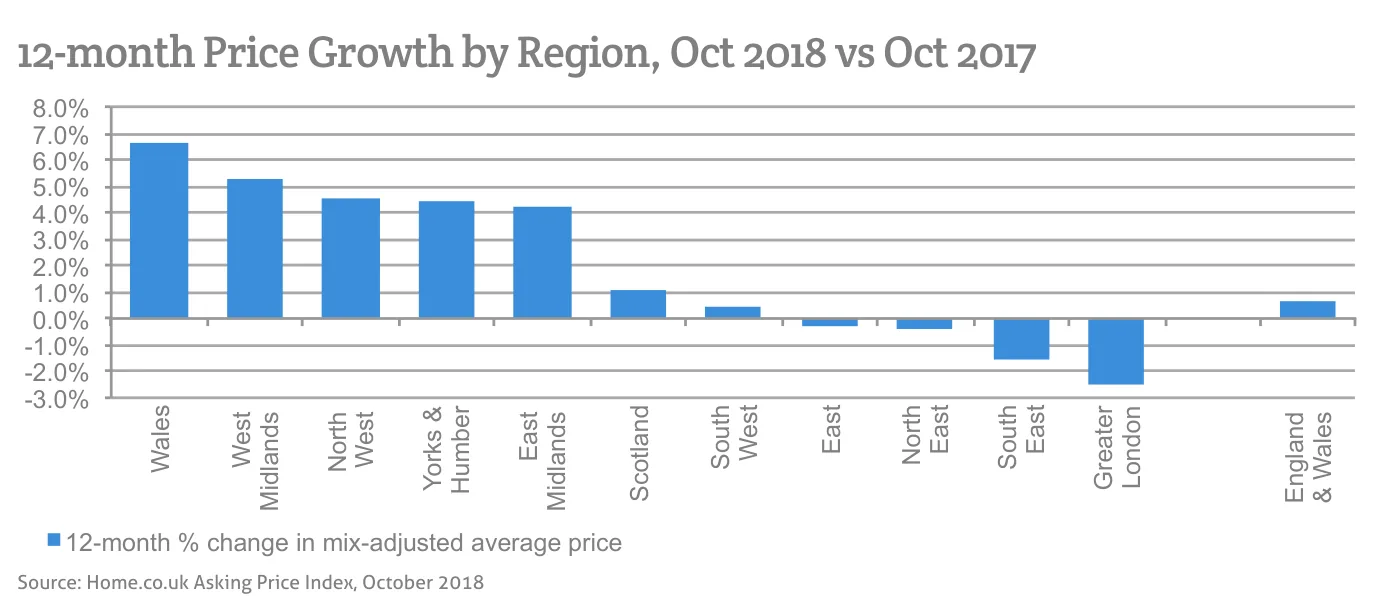
- Some regional property markets remain in the grip of late-cycle booms and continue to indicate significant annualised gains: Welsh prices were up 6.6% and by 5.3% in the West Midlands (YoY).
- Typical Time on Market continues to rise in London (+12%), the South East (+11%) and the East of England (+13% YoY), leading to vendor frustration and price cutting.
- Typical Time on Market for England and Wales has risen to 92 days, three days longer than in October 2017.
Summary
Overall, supply of property for sale in the UK is up by 6% and the total stock for sale has increased by 10.7% year-on-year.
Slower market conditions have triggered the classic response from sellers. Price cutting is becoming the new norm as the market adapts to reduced demand. This month a fourth region, the East of England, joined the year-on-year negative club as the slowdown spreads north and west. Expectations are that prices will slide in these regions (with others soon to follow) for several years as the 'double-bubble' deflates.
In October 2017, the annualised rate of increase of home prices was 3.3%; today the same measure is just 0.6% and is trending to zero (and below).
Key figures
| Measure | Figure |
|---|---|
| Properties with price reductions (mainland UK, September) | 83,780 |
| Properties reduced in price in last 30 days | 16% |
| Monthly change in asking prices (England & Wales) | +0.2% |
| Annual change in asking prices (England & Wales) | 0.6% |
| Typical Time on Market (England & Wales) | 92 days |
| Supply increase (UK, year-on-year) | +6% |
| Total stock for sale increase (UK, year-on-year) | +10.7% |
| Greater London monthly price change | -0.4% |
Figures are for England and Wales unless the report states otherwise, as published in the edition.
Charts from the report
Source: Home.co.uk Asking Price Index, October 2018
Source: Home.co.uk Asking Price Index, October 2018
Source: Home.co.uk Asking Price Index, October 2018
Source: Home.co.uk Asking Price Index, October 2018
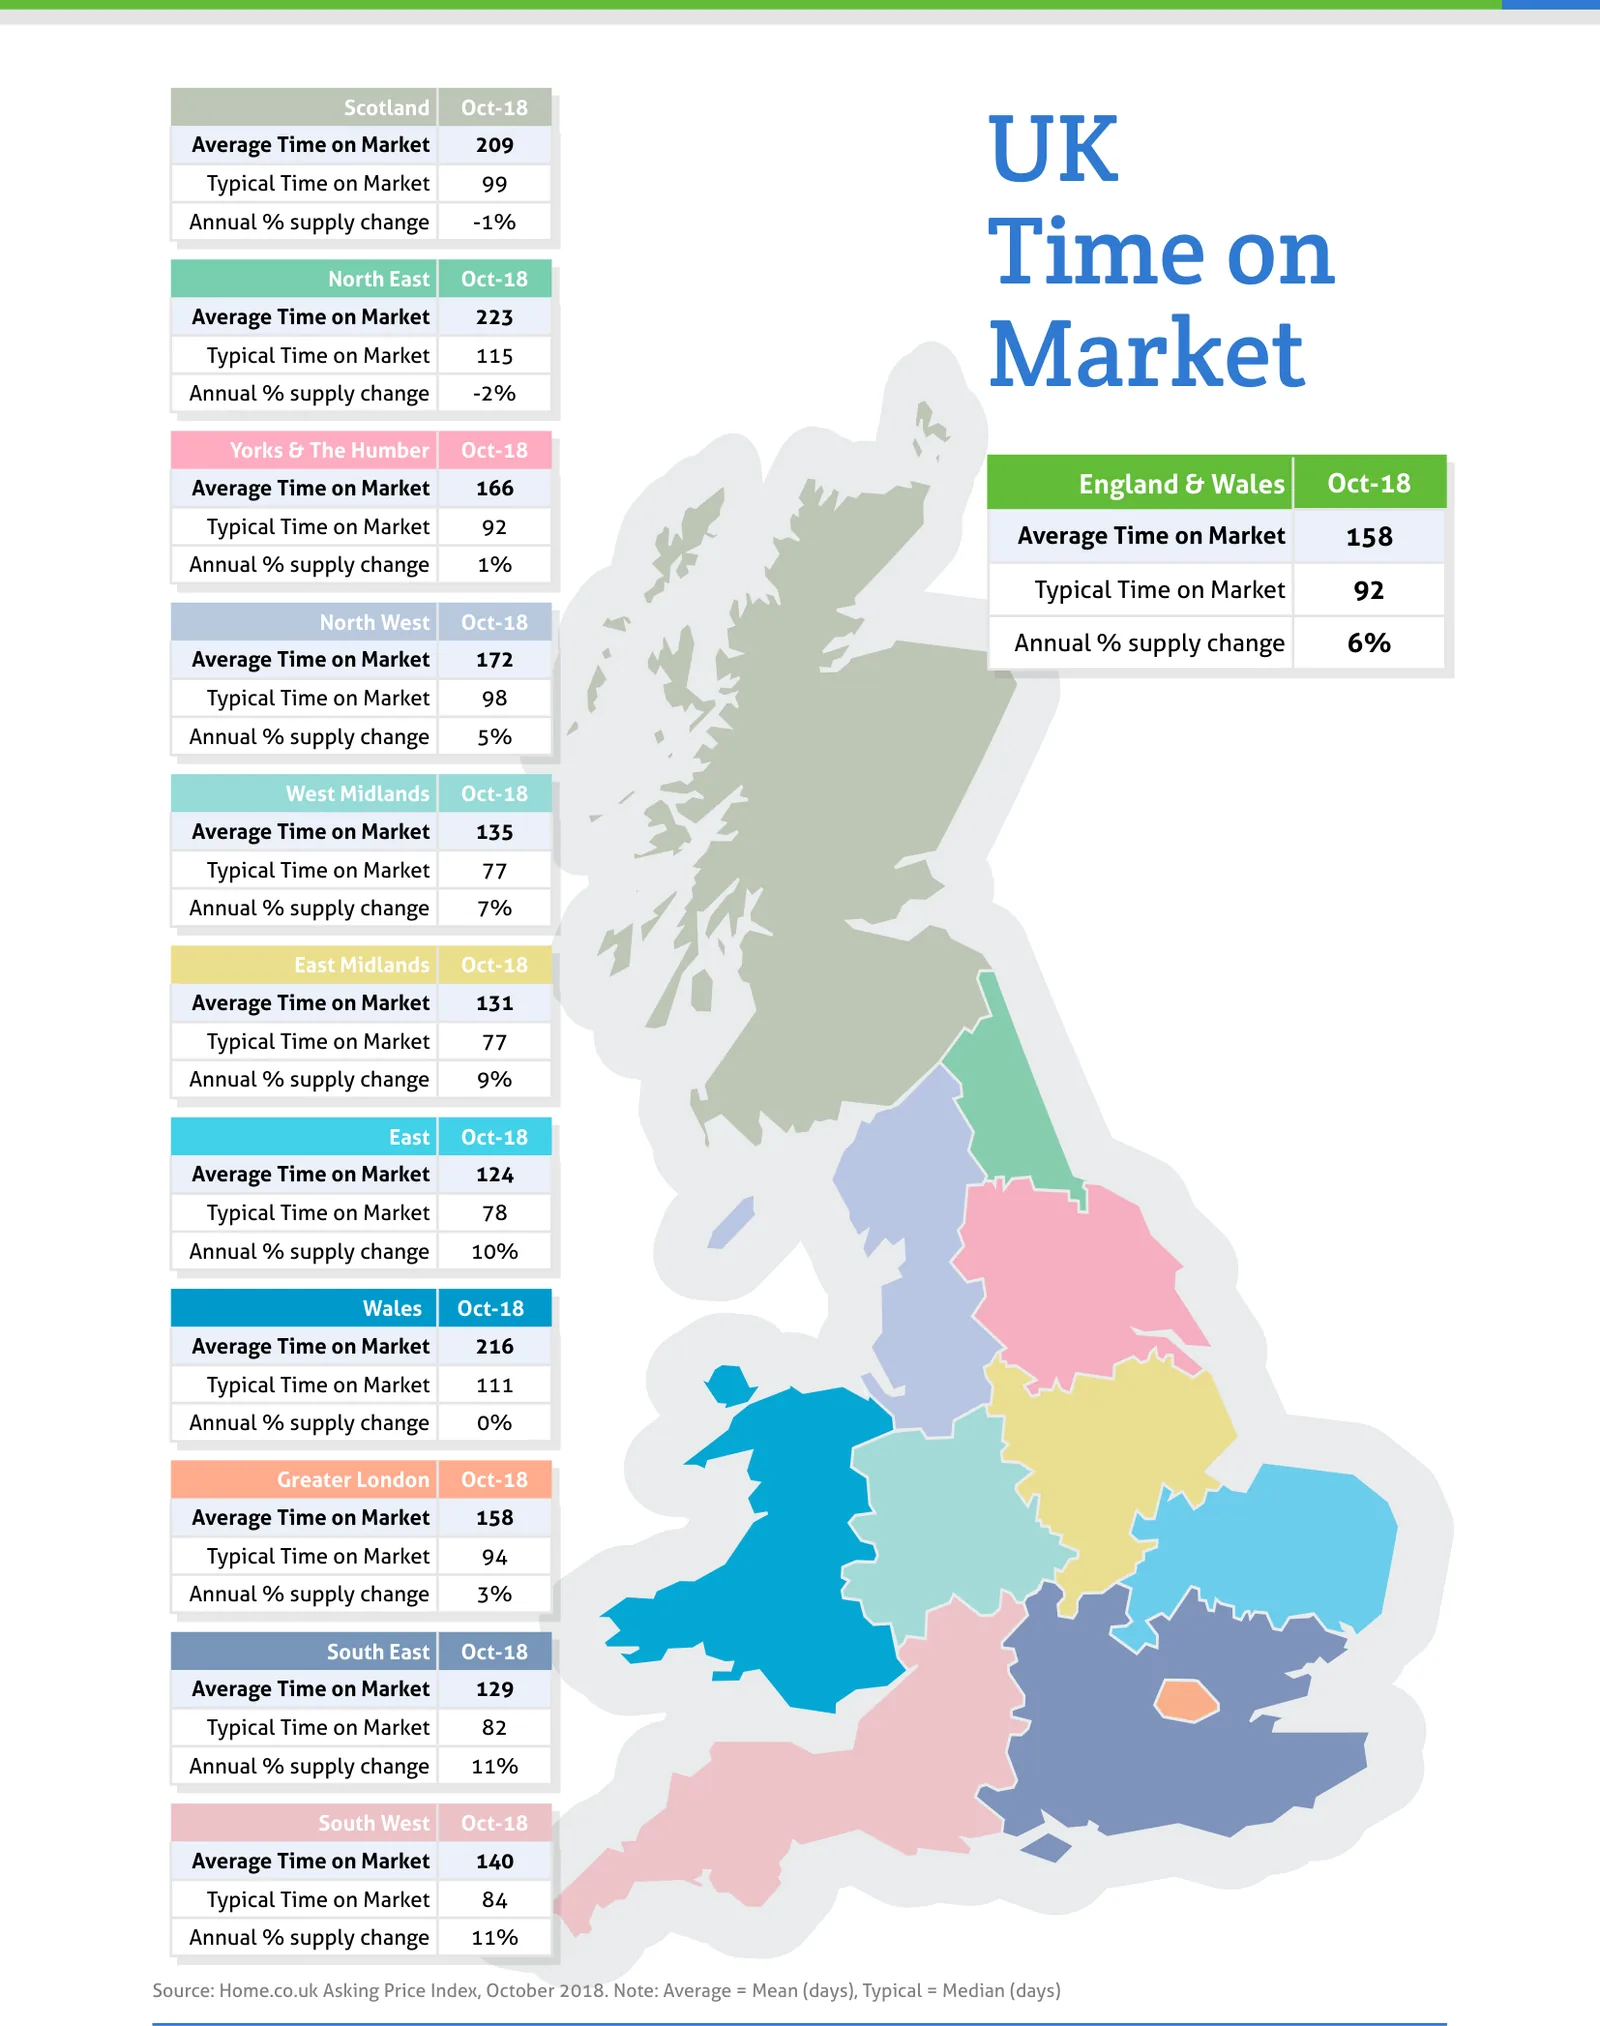
Source: Home.co.uk Asking Price Index, October 2018. Note: Average = Mean (days), Typical = Median (days)
Regional tables
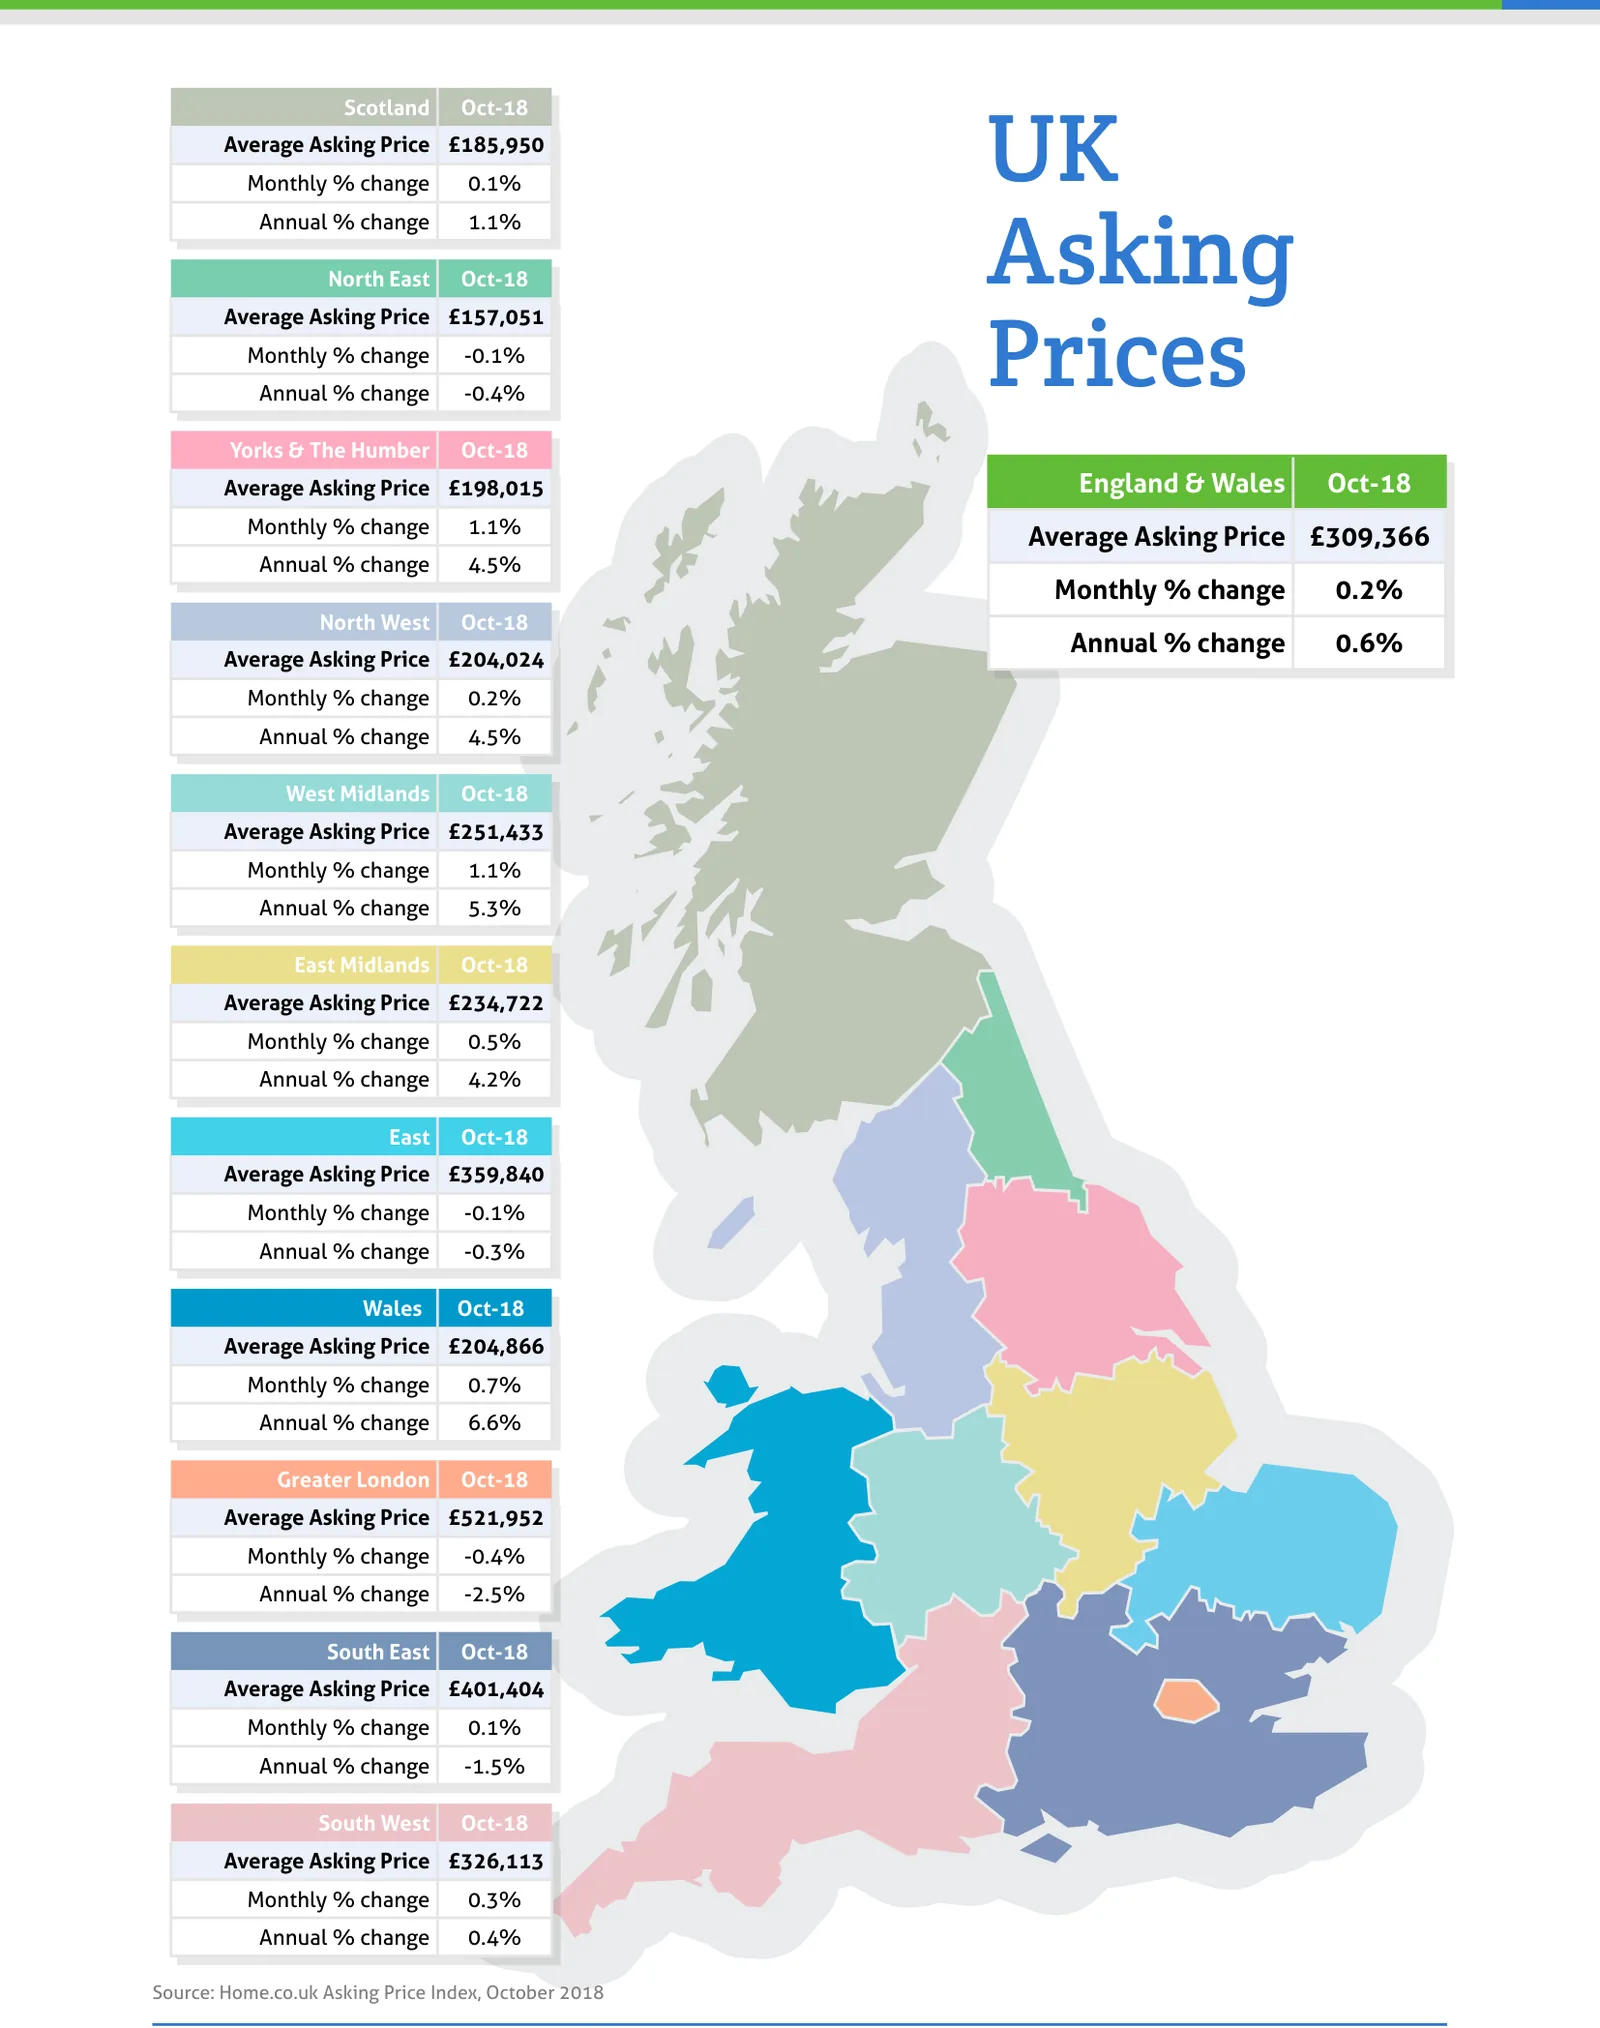
UK Asking Prices, Oct-18
| Region | Average Asking Price | Monthly % change | Annual % change |
|---|---|---|---|
| Scotland | £185,950 | 0.1% | 1.1% |
| North East | £157,051 | -0.1% | -0.4% |
| Yorks & The Humber | £198,015 | 1.1% | 4.5% |
| England & Wales | £309,366 | 0.2% | 0.6% |
| North West | £204,024 | 0.2% | 4.5% |
| West Midlands | £251,433 | 1.1% | 5.3% |
| East Midlands | £234,722 | 0.5% | 4.2% |
| East | £359,840 | -0.1% | -0.3% |
| Wales | £204,866 | 0.7% | 6.6% |
| Greater London | £521,952 | -0.4% | -2.5% |
| South East | £401,404 | 0.1% | -1.5% |
| South West | £326,113 | 0.3% | 0.4% |
UK Time on Market, Oct-18
| Region | Average Time on Market | Typical Time on Market | Annual % supply change |
|---|---|---|---|
| Scotland | 209 | 99 | -1% |
| North East | 223 | 115 | -2% |
| Yorks & The Humber | 166 | 92 | 1% |
| England & Wales | 158 | 92 | 6% |
| North West | 172 | 98 | 5% |
| West Midlands | 135 | 77 | 7% |
| East Midlands | 131 | 77 | 9% |
| East | 124 | 78 | 10% |
| Wales | 216 | 111 | 0% |
| Greater London | 158 | 94 | 3% |
| South East | 129 | 82 | 11% |
| South West | 140 | 84 | 11% |
From the director's commentary
"Overall, annualised price growth for England and Wales looks set to hit zero by the end of the year and fall into the negative in early 2019. This is the hangover after one of the biggest property investment binges in UK history, fuelled, of course, by ultra-low interest rates."
Doug Shephard, Director at Home.co.uk
Read the full October 2018 edition (PDF, 7 pages)
About the Home Asking Price Index
The Home Asking Price Index measures the change in the prices sellers ask for residential property across England, Wales and Scotland. Today it is computed every month from around half a million advertised homes and is mix-adjusted, so a change in what happens to be on the market does not move the figure; earlier editions state the sample they were built from. Because an asking price is set months before a sale completes, the index runs around five months ahead of completed-sale measures such as the UK House Price Index.
Every edition in the archive, back to October 2006, is listed on the index page. How we measure the UK property market explains the listing data behind it, and today's figures by area are on house prices and rental prices.
Text and figures above are quoted from the October 2018 edition as published, with punctuation normalised for the web, and are not revised. Later editions may restate them.
More in What is happening to house prices: the Home guide
Thinking about your next move?
See what your home's worth in seconds, with the UK's longest-running property data behind it.
Get an instant valuation