

























Home Asking Price Index, November 2025: sales market cools rapidly and prices retreat
England and Wales asking prices fell 0.4% in October, with annualised growth slowing to just 0.4% amid a glut of unsold stock.

This is the November 2025 edition of the Home Asking Price Index, released on 13 November 2025, under the headline:
Sales Market Cools Rapidly and Prices Retreat
The headlines and summary below are the report's own words, with the key figures as it published them, followed by the report's charts and regional tables as printed.
Headlines
- The mix-adjusted average asking price for England and Wales dropped by 0.4% during October, bringing the annualised growth figure down to a mere 0.4%. Perhaps surprisingly, the North East and Yorkshire indicated the largest month-on-month declines.
- Annualised home price growth across England and Wales continues to be outpaced by monetary inflation. We estimate that overall real growth currently stands at around -4.2%. Even the best-performing regions are now suffering losses of capital value in real terms (vs. RPI ex-housing).
- There remains a veritable glut of unsold stock on the market. The total portfolio count for England and Wales is at its highest November reading since 2013. Oversupply is rebalancing the market in favour of buyers.
- Vendor numbers have swelled considerably. October showed the highest number of new instructions for that month in many years. Such a surge suggests that many investors are throwing in the towel. There were 7% more properties entering the market during October this year than in October 2024. The largest surges were in the East Midlands, Wales and the West Midlands (all up 11% year-on-year).
- Yorkshire remains the top regional property market growth leader with a year-on-year gain of 3.2%, albeit notably sub-inflation. Meanwhile, the South West remains the worst regional performer with a worsening annualised decline of 1.3%, just outpacing London's annualised decline of 0.9%.
- In the wake of a spectacular record-breaking summer, the sales market momentum is now plummeting. Notably, this greater throughput has not been sufficient to significantly reduce the unsold stock total. Typical Time on Market (TTM) for unsold properties is trending higher and is currently eight days more than in November last year.
- The annualised national growth in asking rents slides even further into the negative (now -3.7%). All English regions, Scotland and Wales indicate year-on-year falls in the mix-adjusted average asking rent. The worst performer is Wales with a decline of 11.6%.
- Seventeen of the 33 London boroughs indicate positive asking rent growth (up from 13 last month). Kensington and Chelsea is the slowest market (TTM: 37 days) while Waltham Forest is by far the speediest lettings borough (TTM: 12 days).
Summary
Over the course of recent months, it is becoming increasingly apparent that the UK property market is suffering from oversupply and that, in turn, is creating downward pressure on prices. Even the formerly top-performing northern regions are now showing sub-inflation growth. The key driver there was buy-to-let investment but, with negative capital gains in real terms and rents now sliding, investment impetus will inevitably wane.
As we head into the festive period, we can expect significant on-market reductions and more competitive pricing of new listings. Vendors can expect offers to come in below the asking price as buyers increasingly have the upper hand.
The poor state of the wider economy is casting a long shadow. Rising unemployment and the expectation of tax rises in the November budget will erode the number of potential buyers and their buying potential. The market will therefore adjust to these new circumstances, most likely by reducing prices and rents.
Key figures
| Measure | Figure |
|---|---|
| Monthly change in asking prices | -0.4% |
| Annualised asking price growth | 0.4% |
| Estimated real growth | -4.2% |
| New instructions year-on-year | +7% |
| Annualised asking rent growth | -3.7% |
Figures are for England and Wales unless the report states otherwise, as published in the edition.
Charts from the report
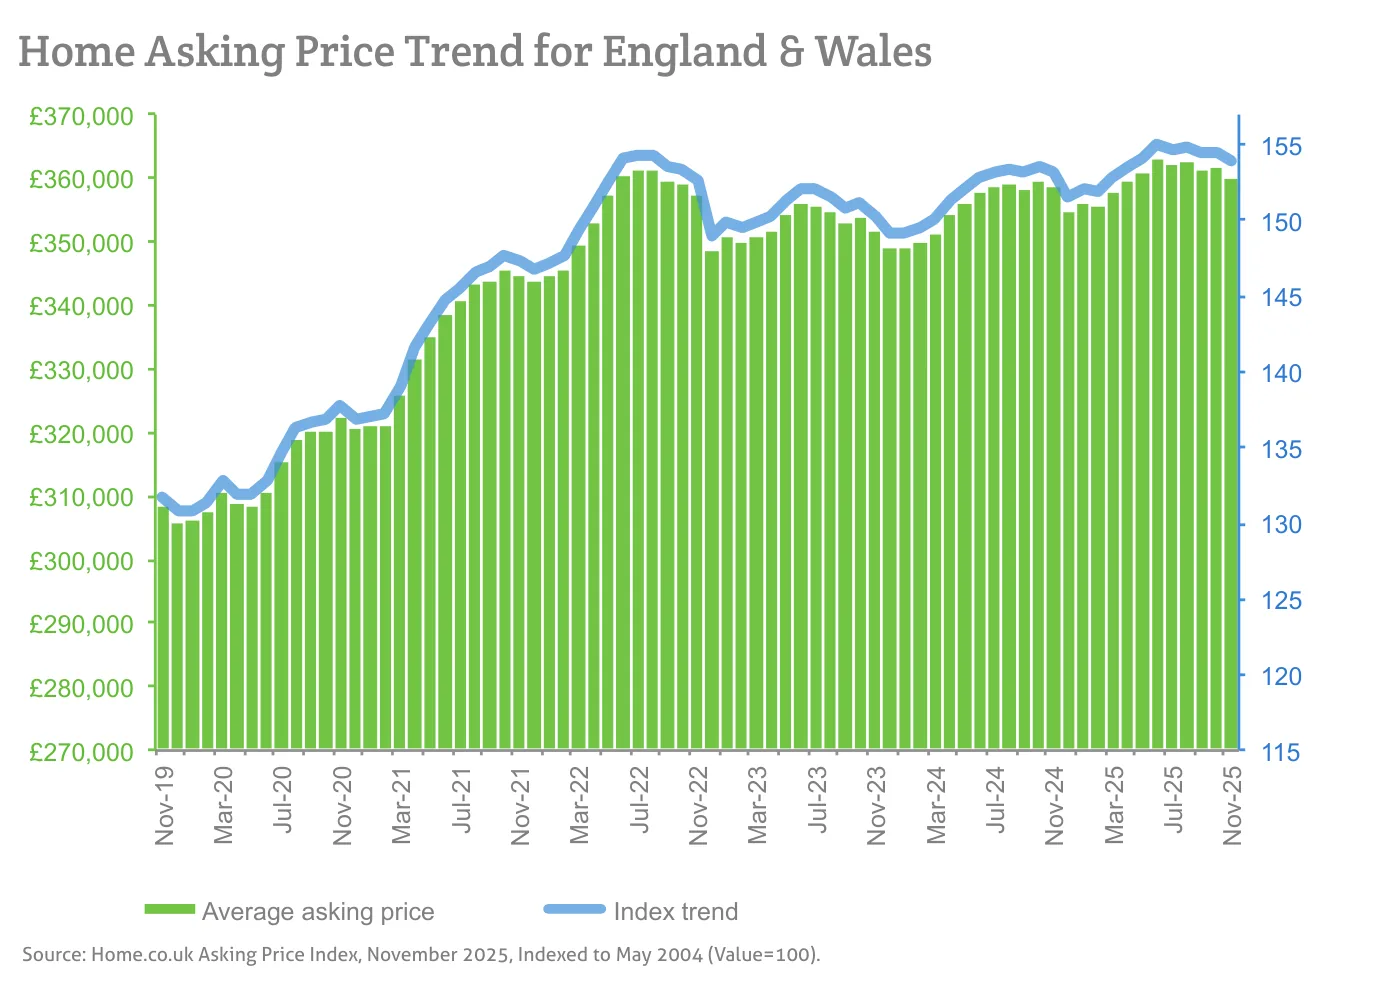
Source: Home.co.uk Asking Price Index, November 2025, Indexed to May 2004 (Value=100).
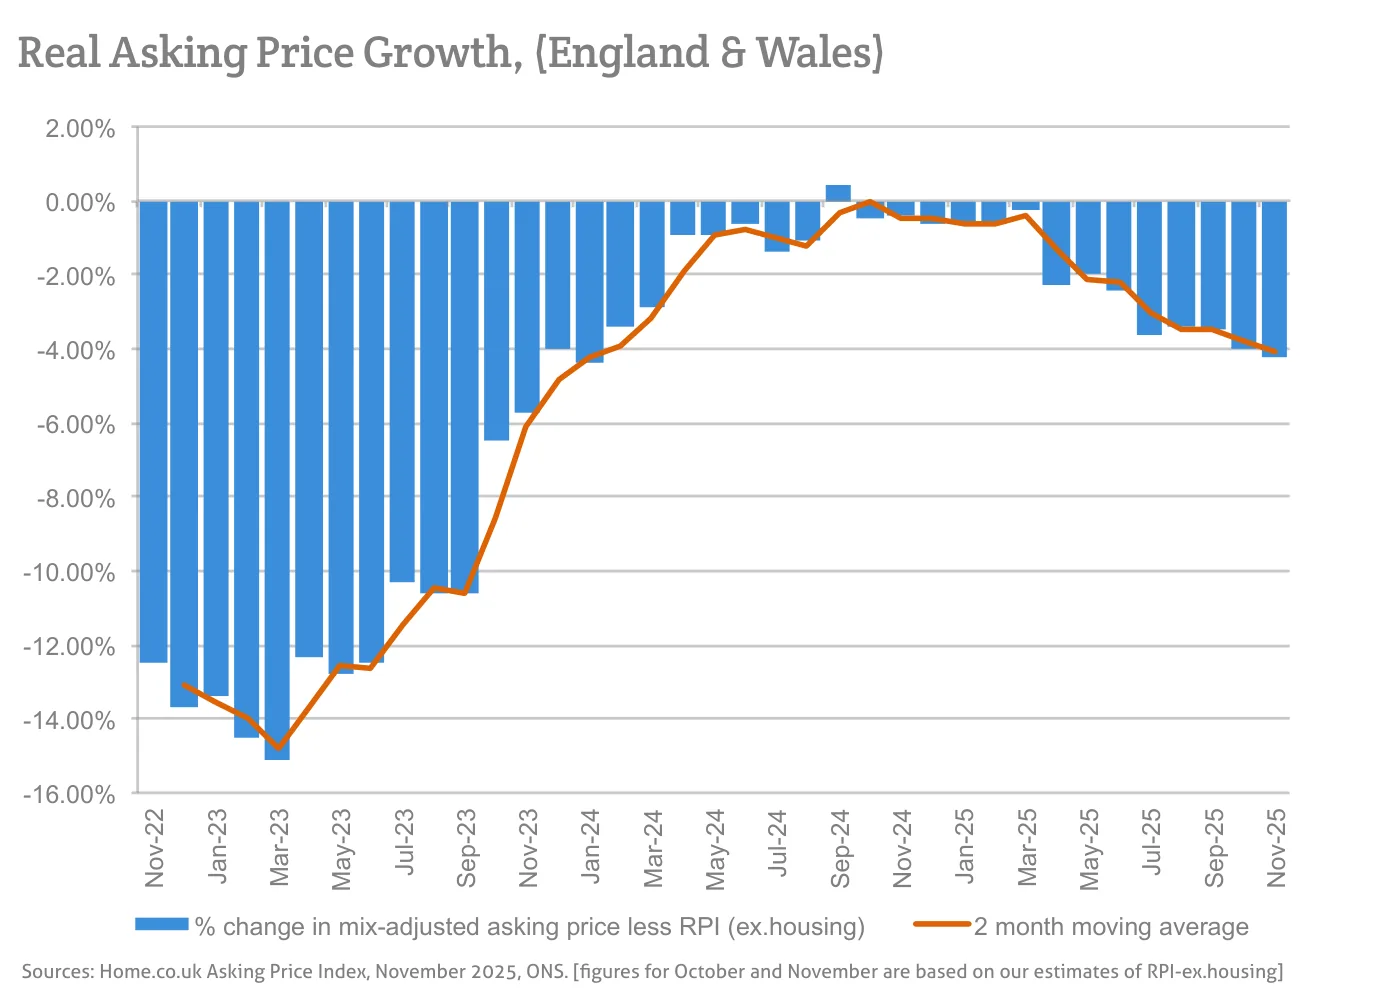
Sources: Home.co.uk Asking Price Index, November 2025, ONS. [figures for October and November are based on our estimates of RPI-ex.housing]
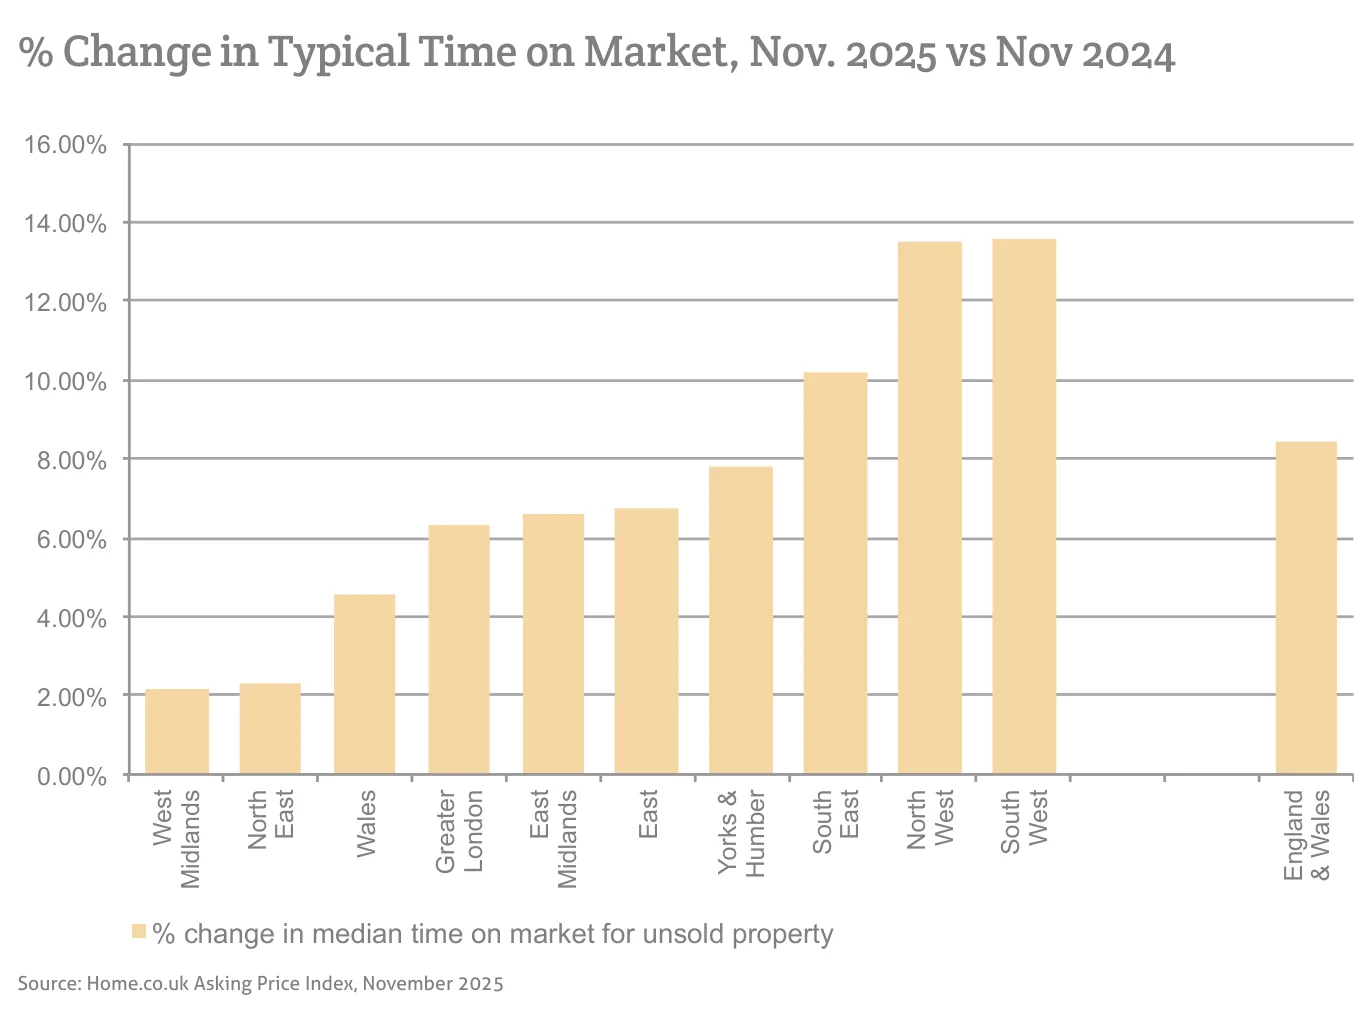
Source: Home.co.uk Asking Price Index, November 2025
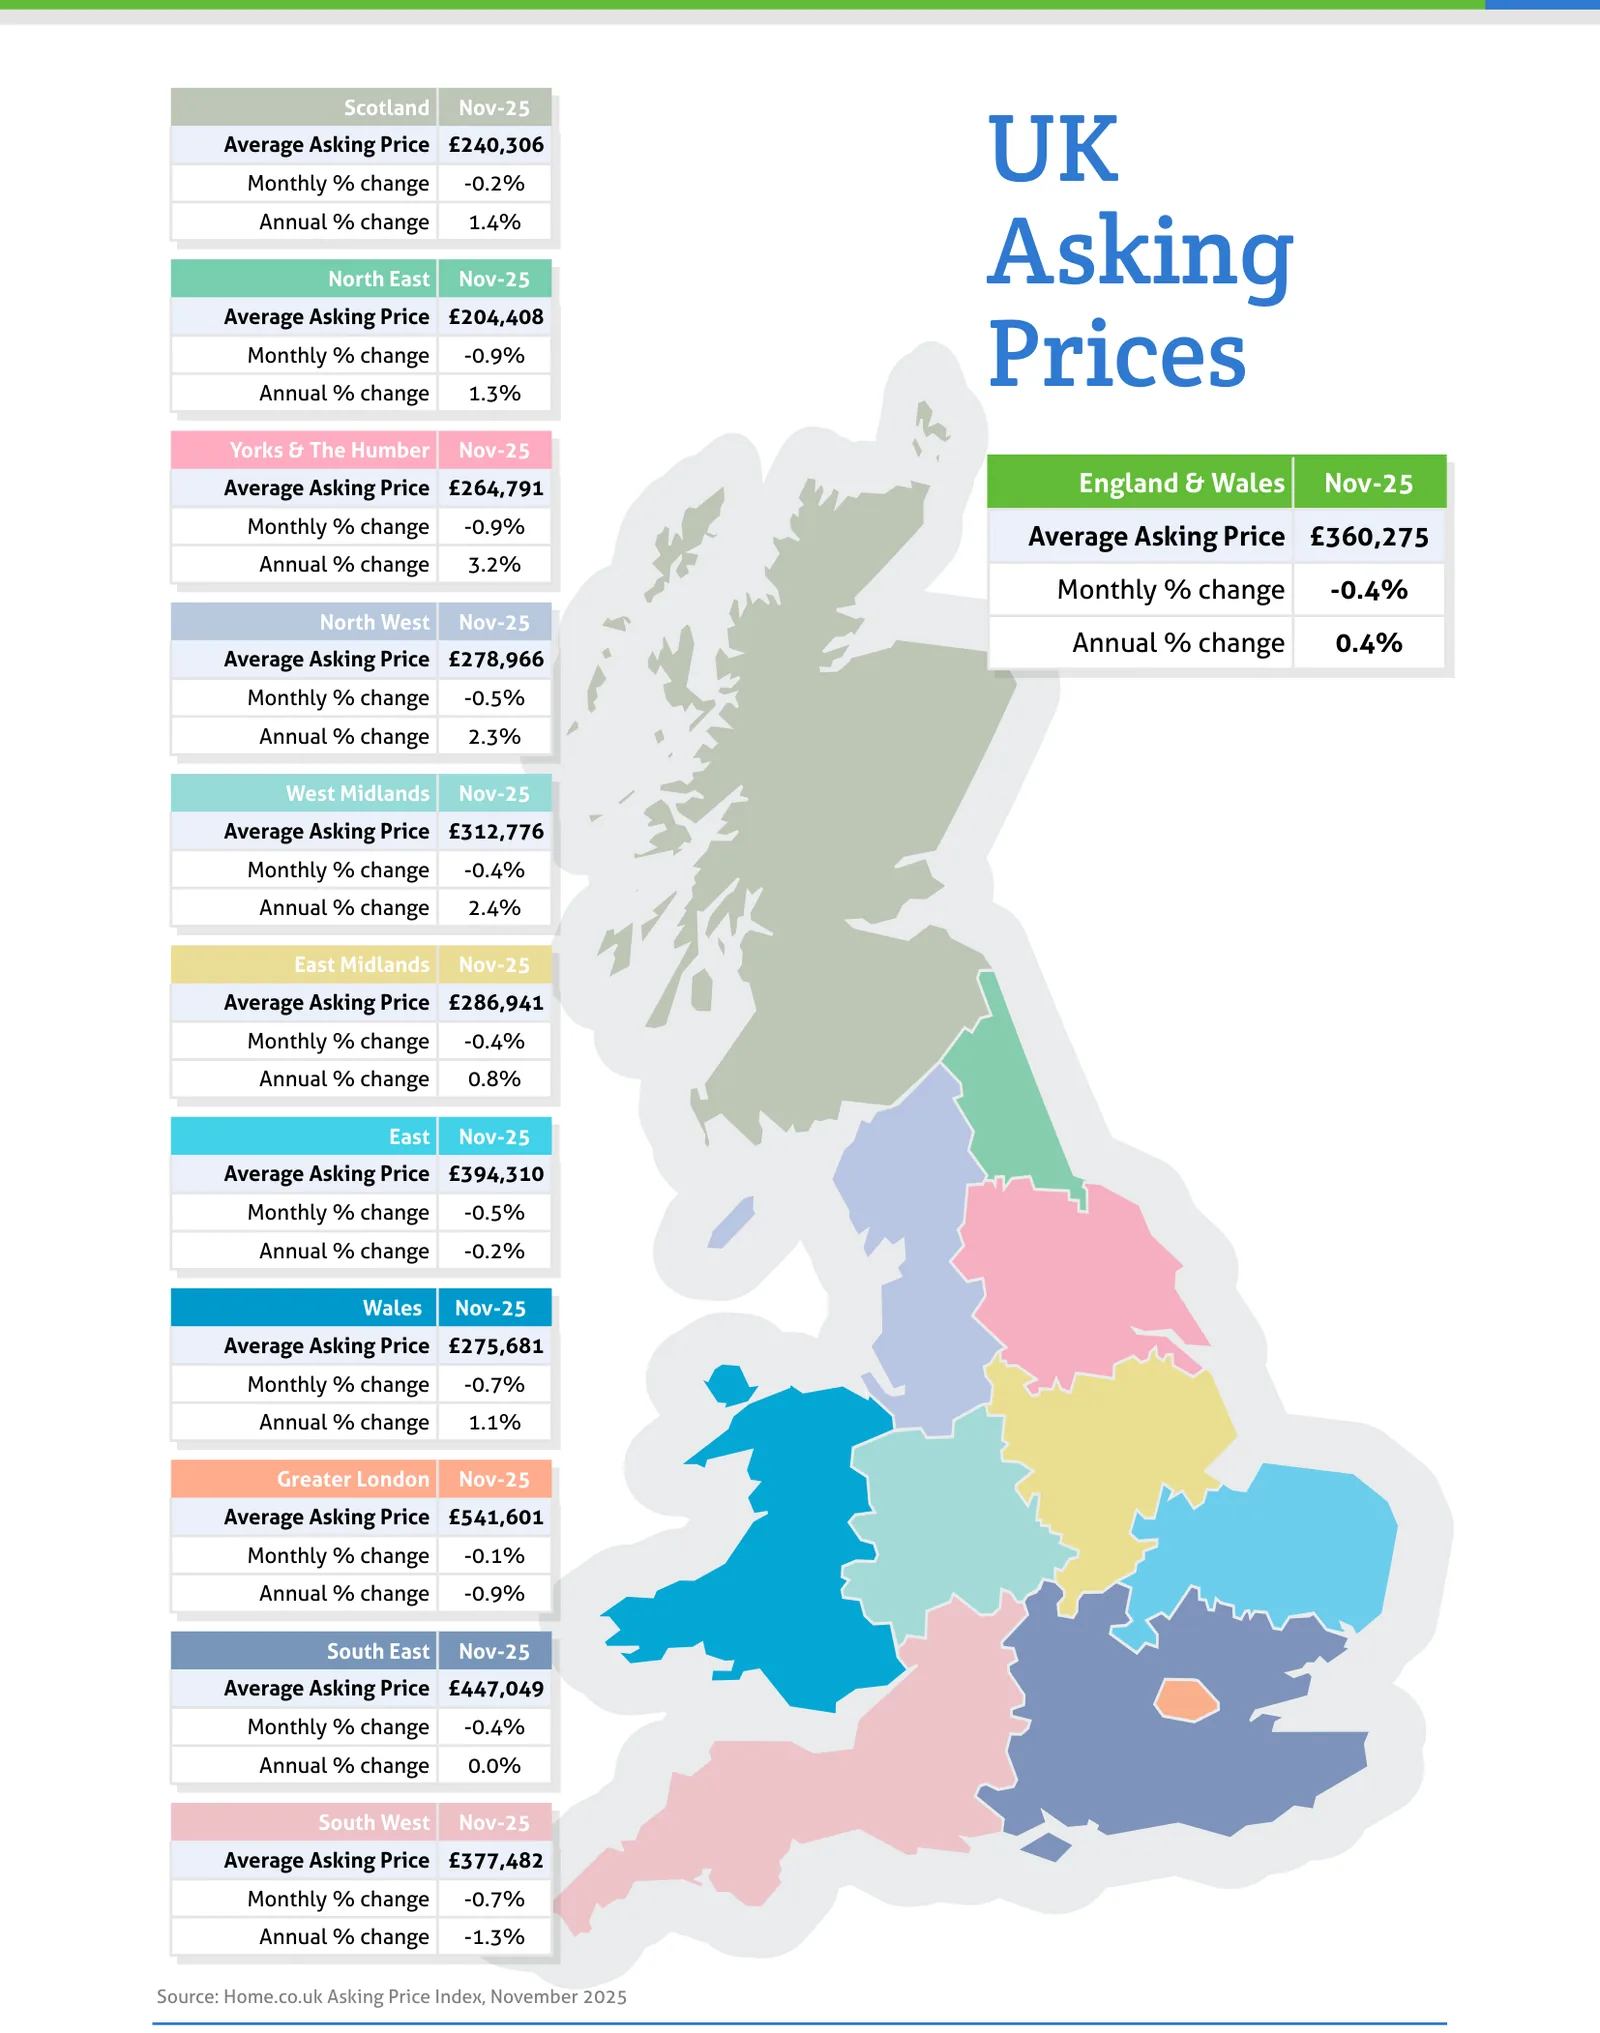
Source: Home.co.uk Asking Price Index, November 2025
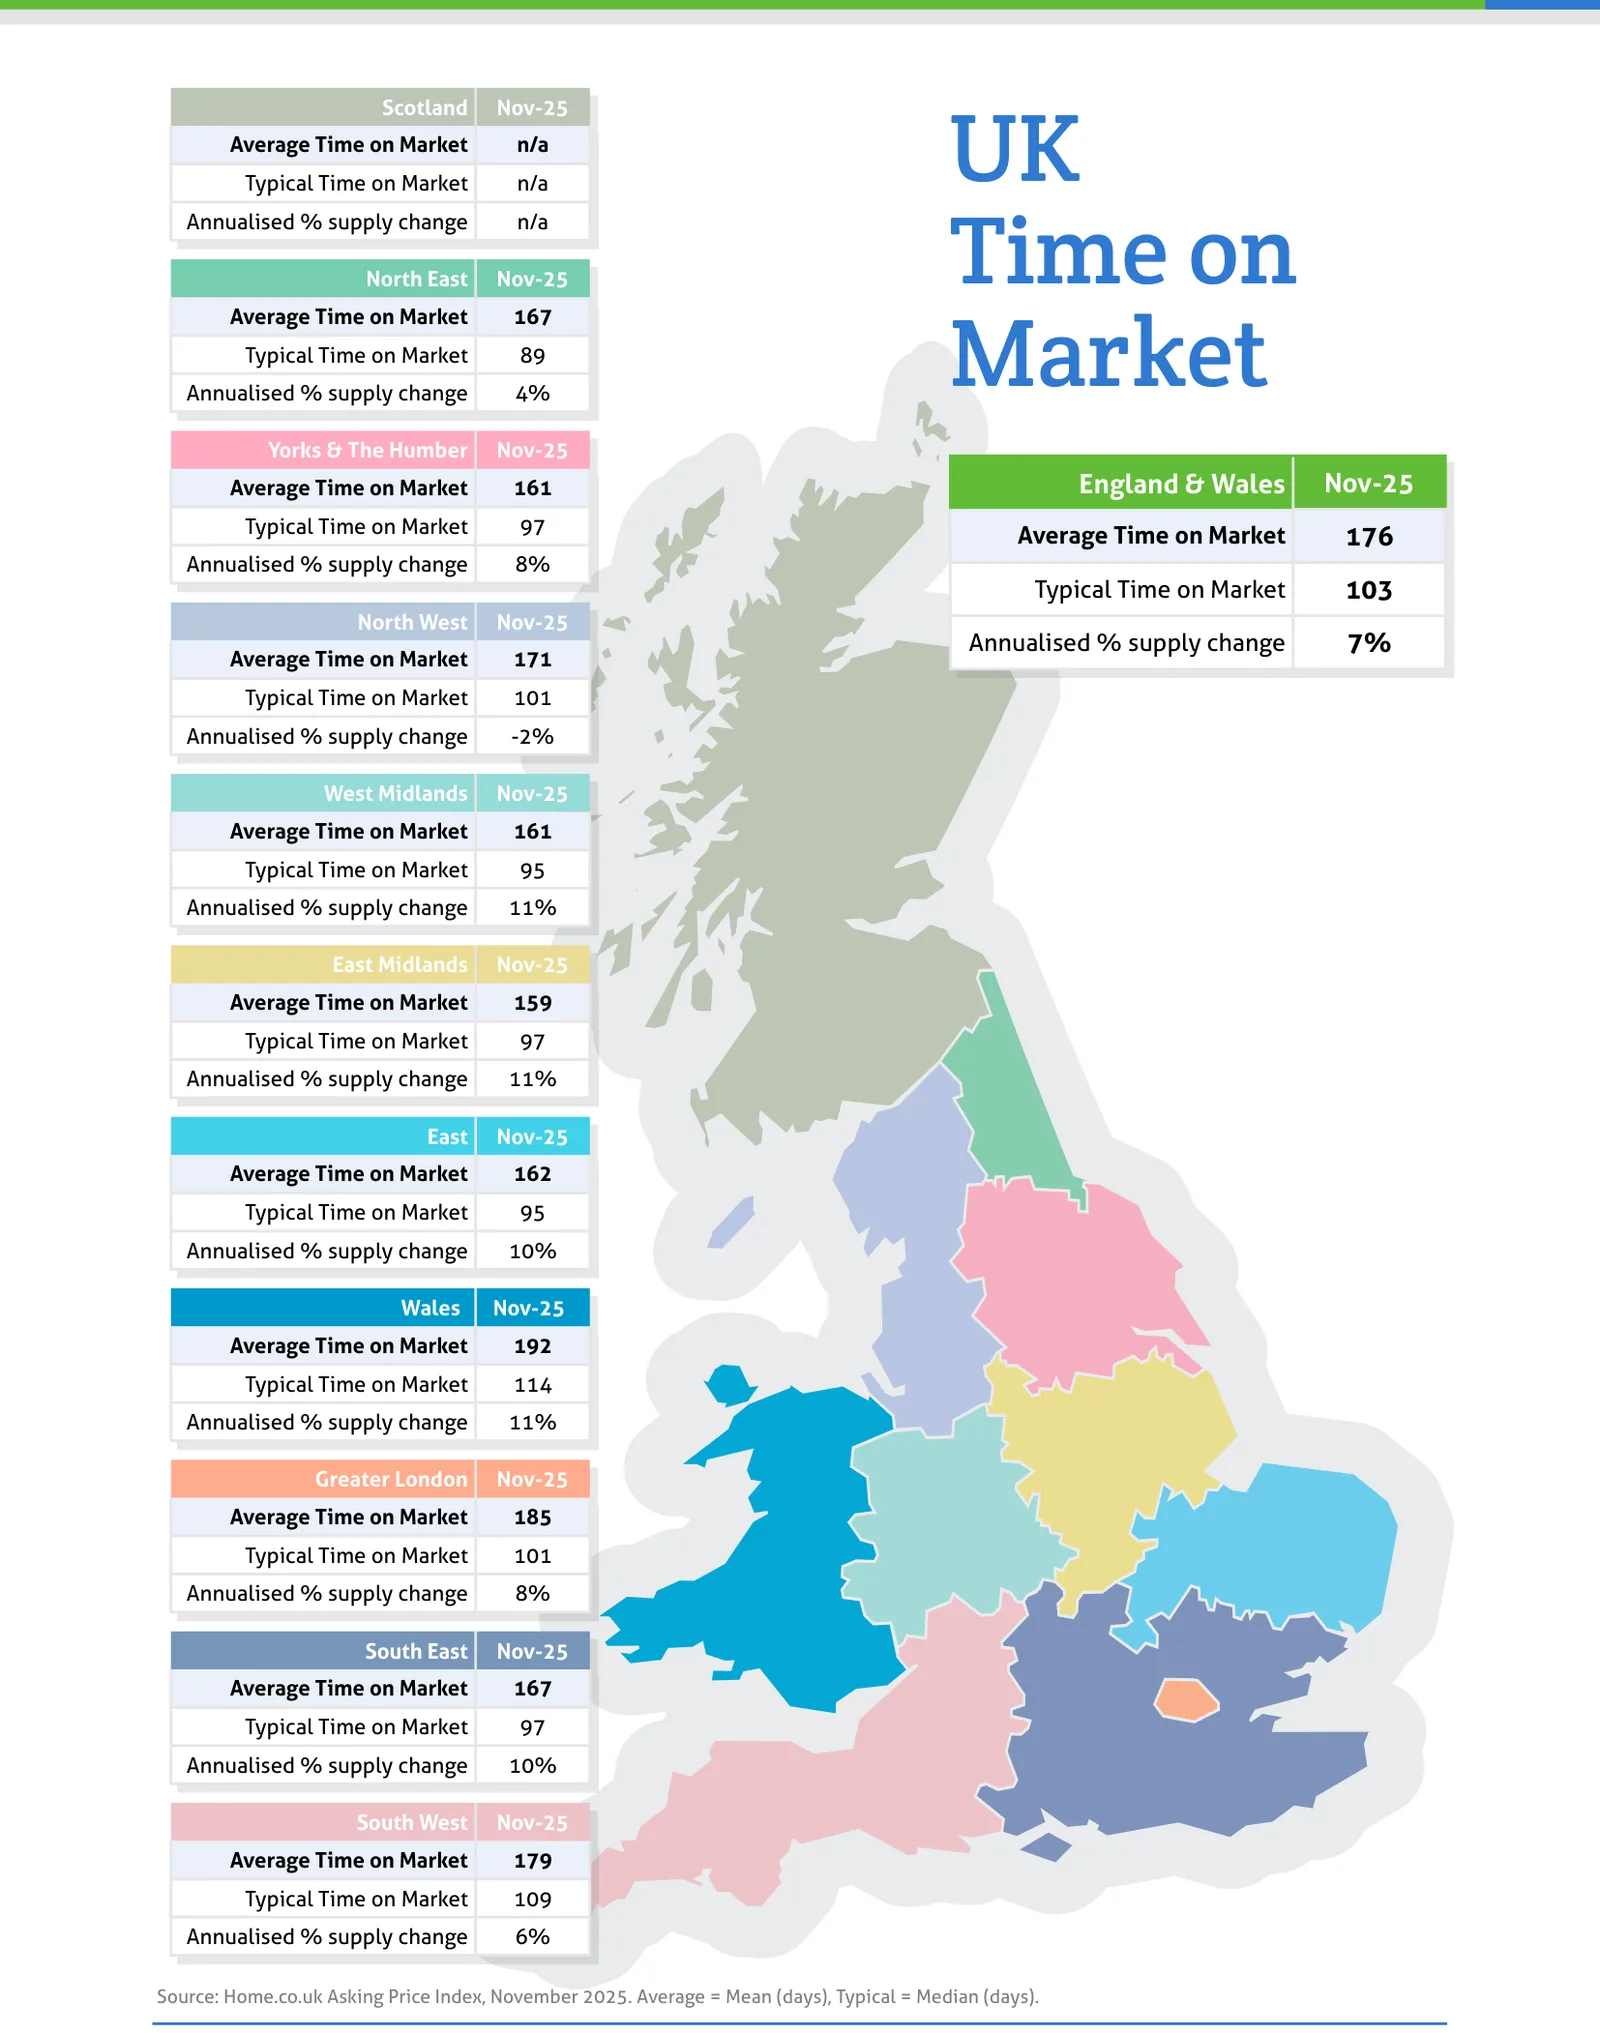
Source: Home.co.uk Asking Price Index, November 2025. Average = Mean (days), Typical = Median (days).
Regional tables
UK Asking Prices, Nov-25
| Region | Average Asking Price | Monthly % change | Annual % change |
|---|---|---|---|
| Scotland | £240,306 | -0.2% | 1.4% |
| North East | £204,408 | -0.9% | 1.3% |
| Yorks & The Humber | £264,791 | -0.9% | 3.2% |
| England & Wales | £360,275 | -0.4% | 0.4% |
| North West | £278,966 | -0.5% | 2.3% |
| West Midlands | £312,776 | -0.4% | 2.4% |
| East Midlands | £286,941 | -0.4% | 0.8% |
| East | £394,310 | -0.5% | -0.2% |
| Wales | £275,681 | -0.7% | 1.1% |
| Greater London | £541,601 | -0.1% | -0.9% |
| South East | £447,049 | -0.4% | 0.0% |
| South West | £377,482 | -0.7% | -1.3% |
UK Time on Market, Nov-25
| Region | Average Time on Market | Typical Time on Market | Annualised % supply change |
|---|---|---|---|
| Scotland | n/a | n/a | n/a |
| North East | 167 | 89 | 4% |
| Yorks & The Humber | 161 | 97 | 8% |
| England & Wales | 176 | 103 | 7% |
| North West | 171 | 101 | -2% |
| West Midlands | 161 | 95 | 11% |
| East Midlands | 159 | 97 | 11% |
| East | 162 | 95 | 10% |
| Wales | 192 | 114 | 11% |
| Greater London | 185 | 101 | 8% |
| South East | 167 | 97 | 10% |
| South West | 179 | 109 | 6% |
From the director's commentary
"Over the course of recent months, it is becoming increasingly apparent that the UK property market is suffering from oversupply and that, in turn, is creating downward pressure on prices. Even the formerly top-performing northern regions are now showing sub-inflation growth."
Read the full November 2025 edition (PDF, 7 pages)
About the Home Asking Price Index
The Home Asking Price Index measures the change in the prices sellers ask for residential property across England, Wales and Scotland. Today it is computed every month from around half a million advertised homes and is mix-adjusted, so a change in what happens to be on the market does not move the figure; earlier editions state the sample they were built from. Because an asking price is set months before a sale completes, the index runs around five months ahead of completed-sale measures such as the UK House Price Index.
Every edition in the archive, back to October 2006, is listed on the index page. How we measure the UK property market explains the listing data behind it, and today's figures by area are on house prices and rental prices.
Text and figures above are quoted from the November 2025 edition as published, with punctuation normalised for the web, and are not revised. Later editions may restate them.
More in What is happening to house prices: the Home guide
Thinking about your next move?
See what your home's worth in seconds, with the UK's longest-running property data behind it.
Get an instant valuation