

























Home Asking Price Index, November 2024: only northern markets even close to real growth
Asking prices fell slightly across England and Wales in October while annual growth reached 2.0%, driven by strong gains in the North and Wales.

This is the November 2024 edition of the Home Asking Price Index, released on 13 November 2024, under the headline:
Only Northern Markets Even Close to Real Growth
The headlines and summary below are the report's own words, with the key figures as it published them, followed by the report's charts and regional tables as printed.
Headlines
- Asking prices indicate an anticipated seasonal decline of -0.3% since last month across England and Wales, while annualised home price growth extends to 2.0%, driven mainly by capital growth in the North and Wales.
- The UK property market continues to show renewed vitality. Property turnover is currently higher than during most of the last ten years and Typical Time on Market remains significantly lower than in pre-pandemic November 2019.
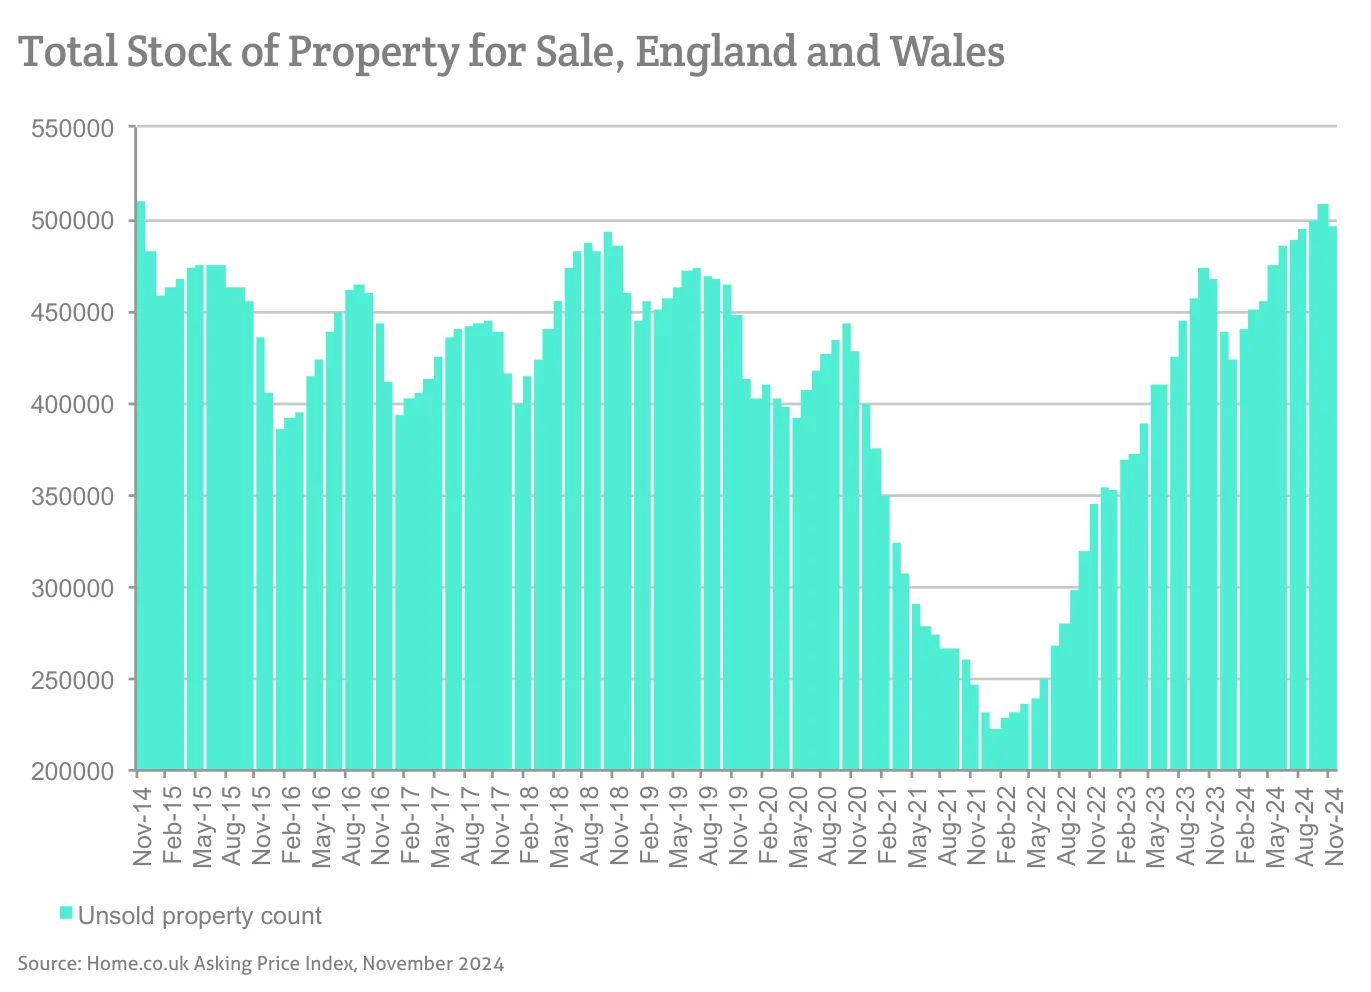
- Such is the volume of property moving through the market that, despite a large uptick in new instructions in October, the total of unsold property fell significantly over the same period.
- The total number of new instructions entering the market during October 2024 was 14% more than during October 2023. The North West saw the highest regional increase, up by 21%.
- The unsold sales stock count for England and Wales fell by just over 13,000 during the last month, making the current total 495,618.
- Seasonal price dips were observed in most English regions and Wales. However, prices continued to rise in Scotland and the North West over the last month, while in London they remained unchanged.
- The North East holds its top position in regional property market growth; the year-on-year gain increased to 6.9%. In second place is Yorkshire at 4.2%.
- The East of England is the worst performing region, indicating an increase of just 0.1% over the last twelve months.
- Comparing national home price growth to inflation over the last five years shows that gains during the COVID boom are illusionary in real terms. The real price growth for England and Wales was -17.3% (vs RPI) or -8.3% (vs CPI).
- The annualised national growth for asking rents is just 1.1%, which is dragged down by London's falls. However, Wales followed by Yorkshire continue to indicate double-digit growth of 15.2% and 14.4% respectively year-on-year. Meanwhile, the worsening year-on-year decline in Greater London rents is now -3.9%.
- The City of London shows the greatest decline in asking rents of all London boroughs with an annualised rental fall of 15.6%.
Summary
The northern regions of England, the West Midlands, Scotland and Wales have enjoyed significant home price growth over the last twelve months. These inflation-beating gains are supporting the national figures and are in stark contrast to the lacklustre performance of the southern and eastern regions including London.
Confidence abounds in the northern regions while the green shoots of recovery are increasingly evident in the south. Overall, the UK property sales market is in good shape. Current growth is driven mainly by the northern powerhouse regions and, given the latest rate cut by the Bank of England, above-inflation growth may well return to London and the southern regions next year. Most importantly, properties are moving through the market with ease as demand has increased sufficiently to match heightened supply.
Key figures
| Measure | Figure |
|---|---|
| Monthly asking price change | -0.3% |
| Annual asking price growth | 2.0% |
| Monthly fall in unsold stock | 13,000 |
| New instructions vs year ago | +14% |
| Annualised asking rent growth (UK) | 1.1% |
| Real price growth vs RPI (5-year) | -17.3% |
| Real price growth vs CPI (5-year) | -8.3% |
Figures are for England and Wales unless the report states otherwise, as published in the edition.
Charts from the report
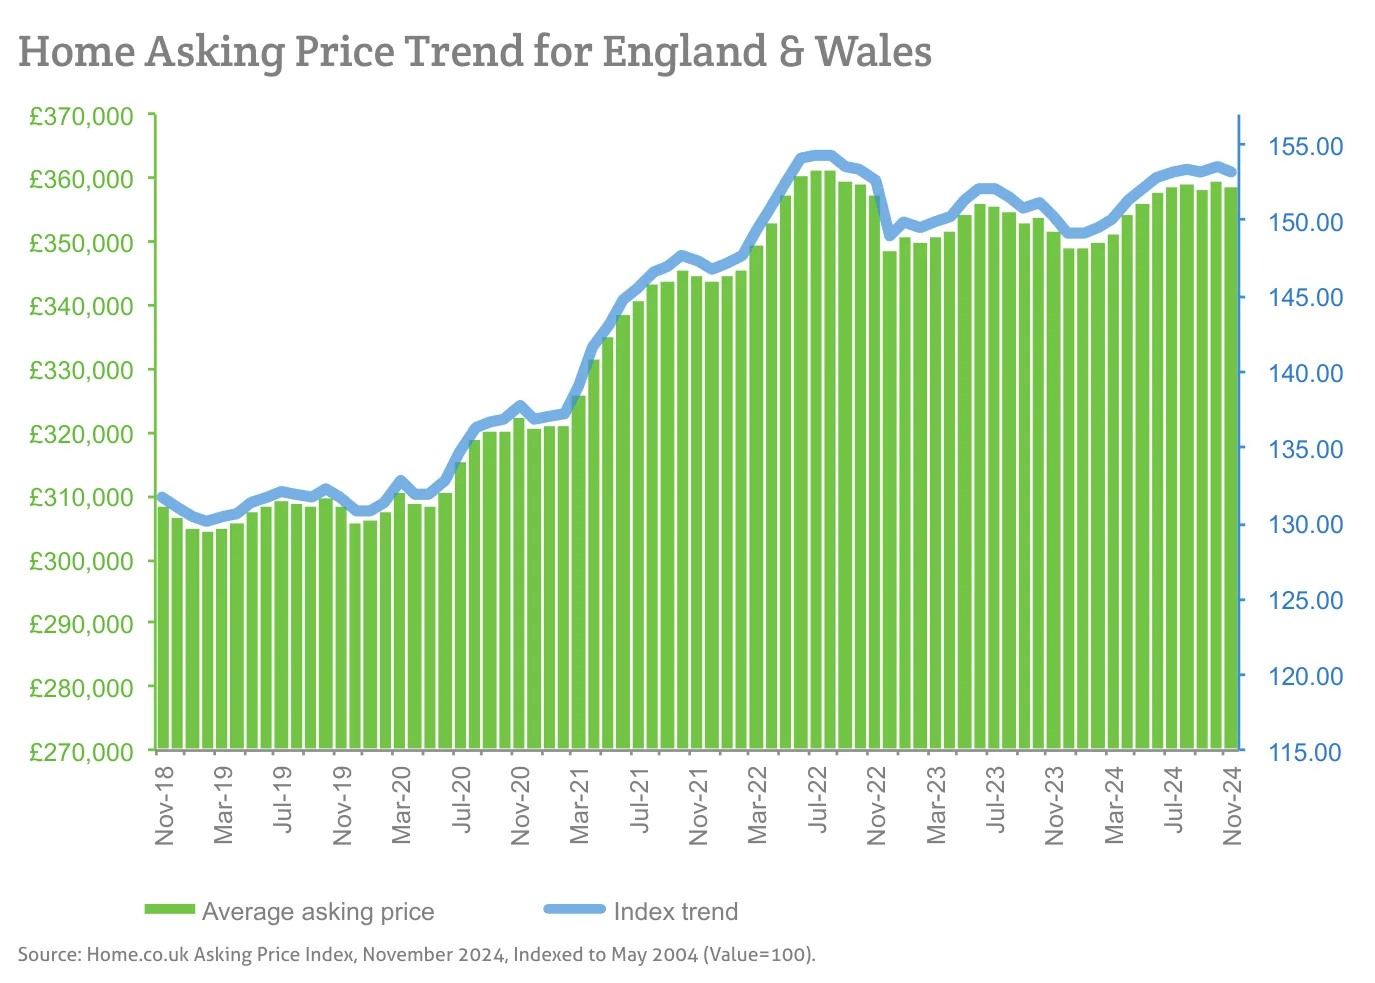
Source: Home.co.uk Asking Price Index, November 2024, Indexed to May 2004 (Value=100).
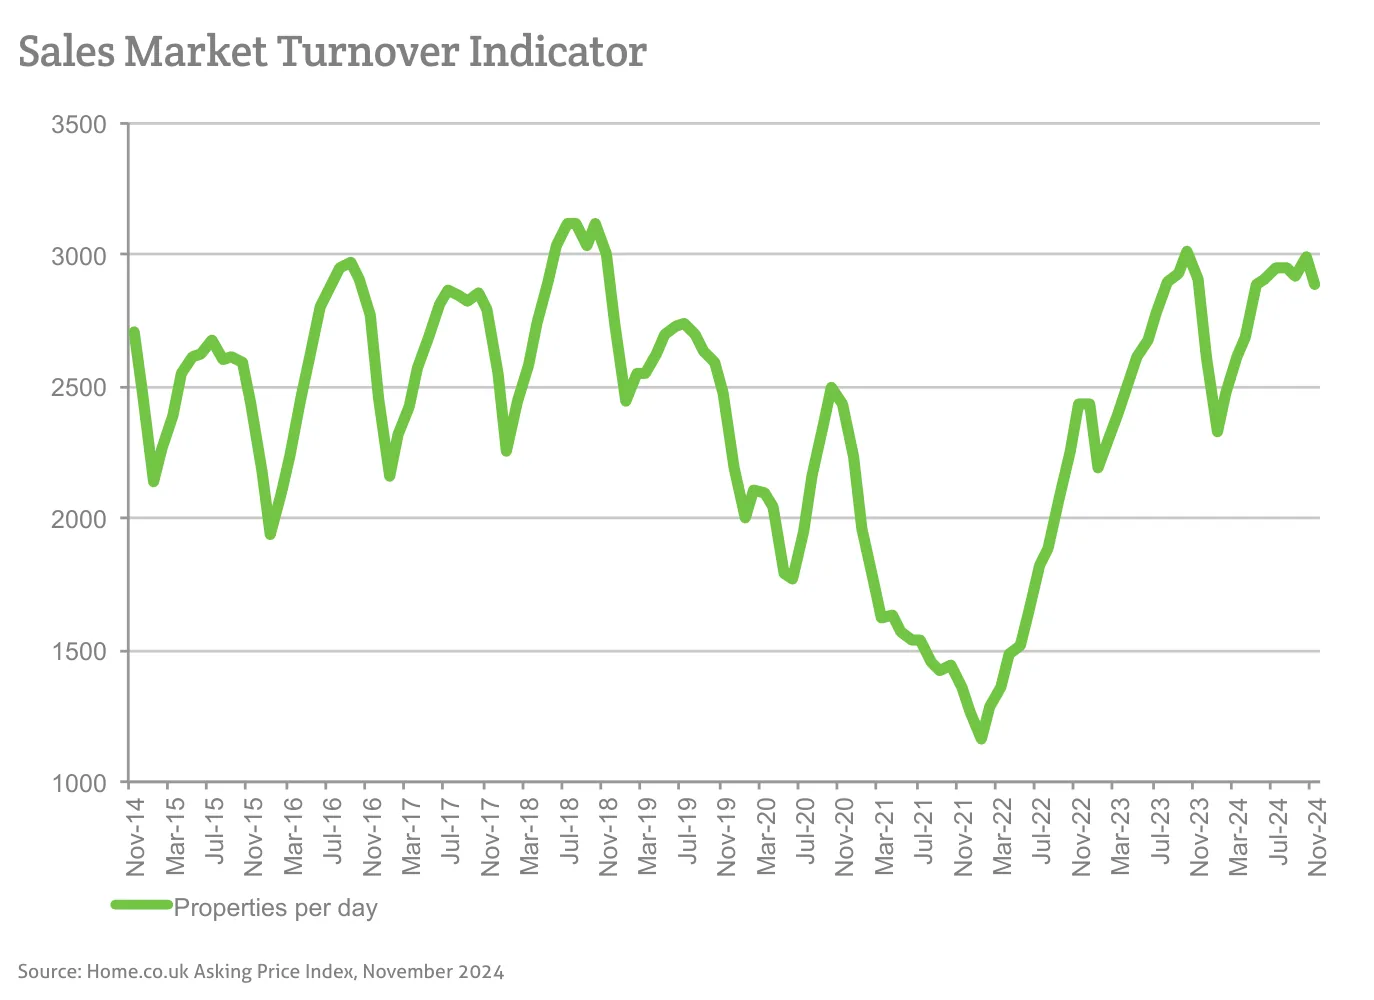
Source: Home.co.uk Asking Price Index, November 2024
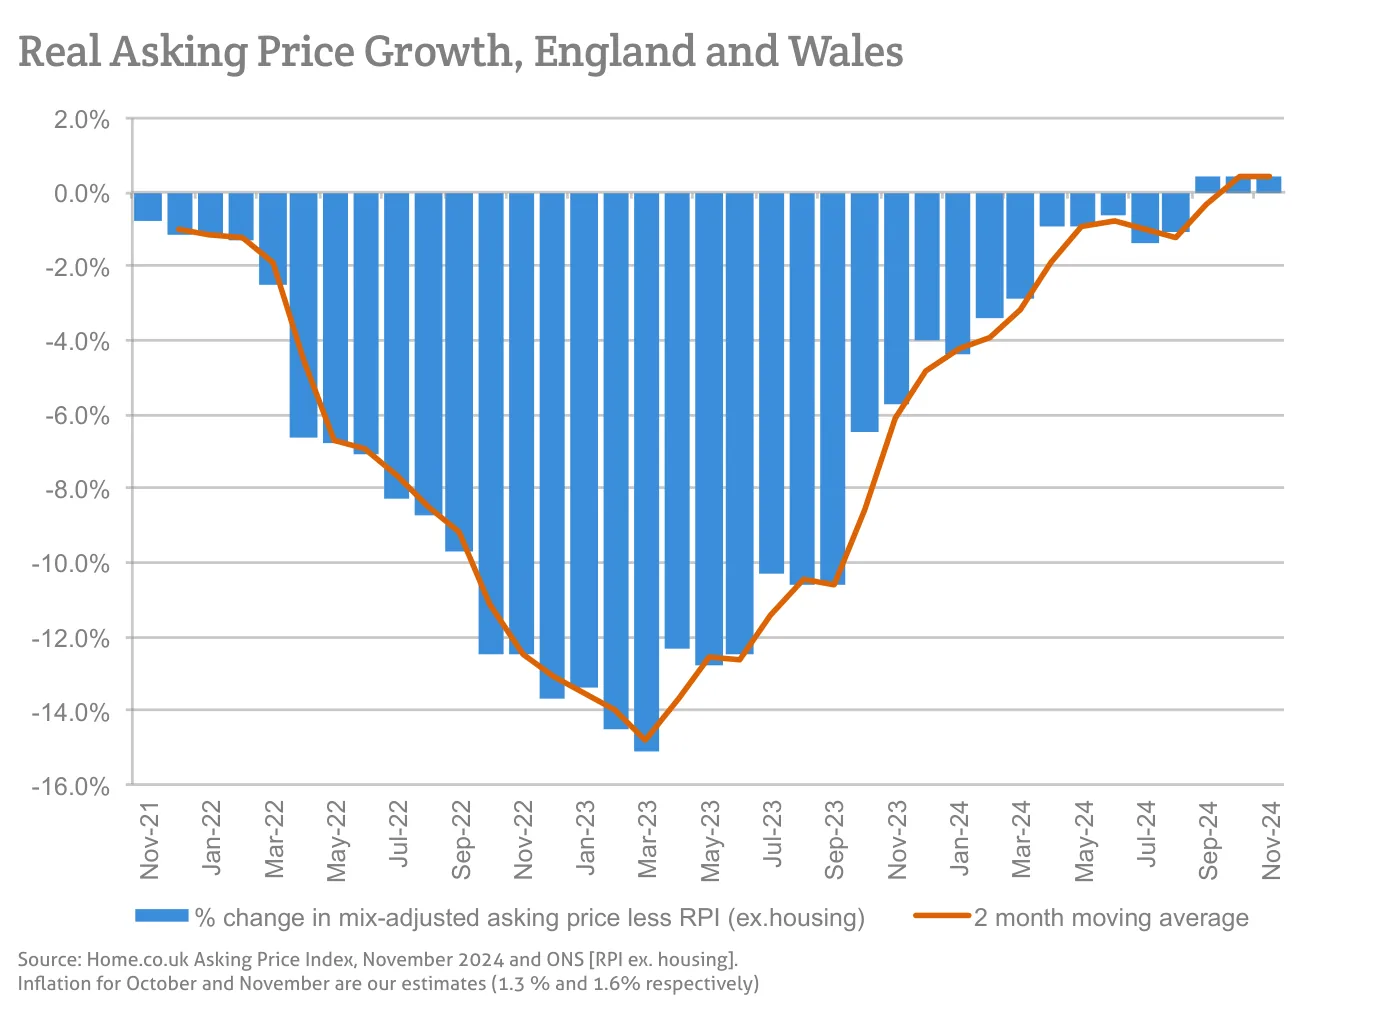
Source: Home.co.uk Asking Price Index, November 2024 and ONS [RPI ex. housing].
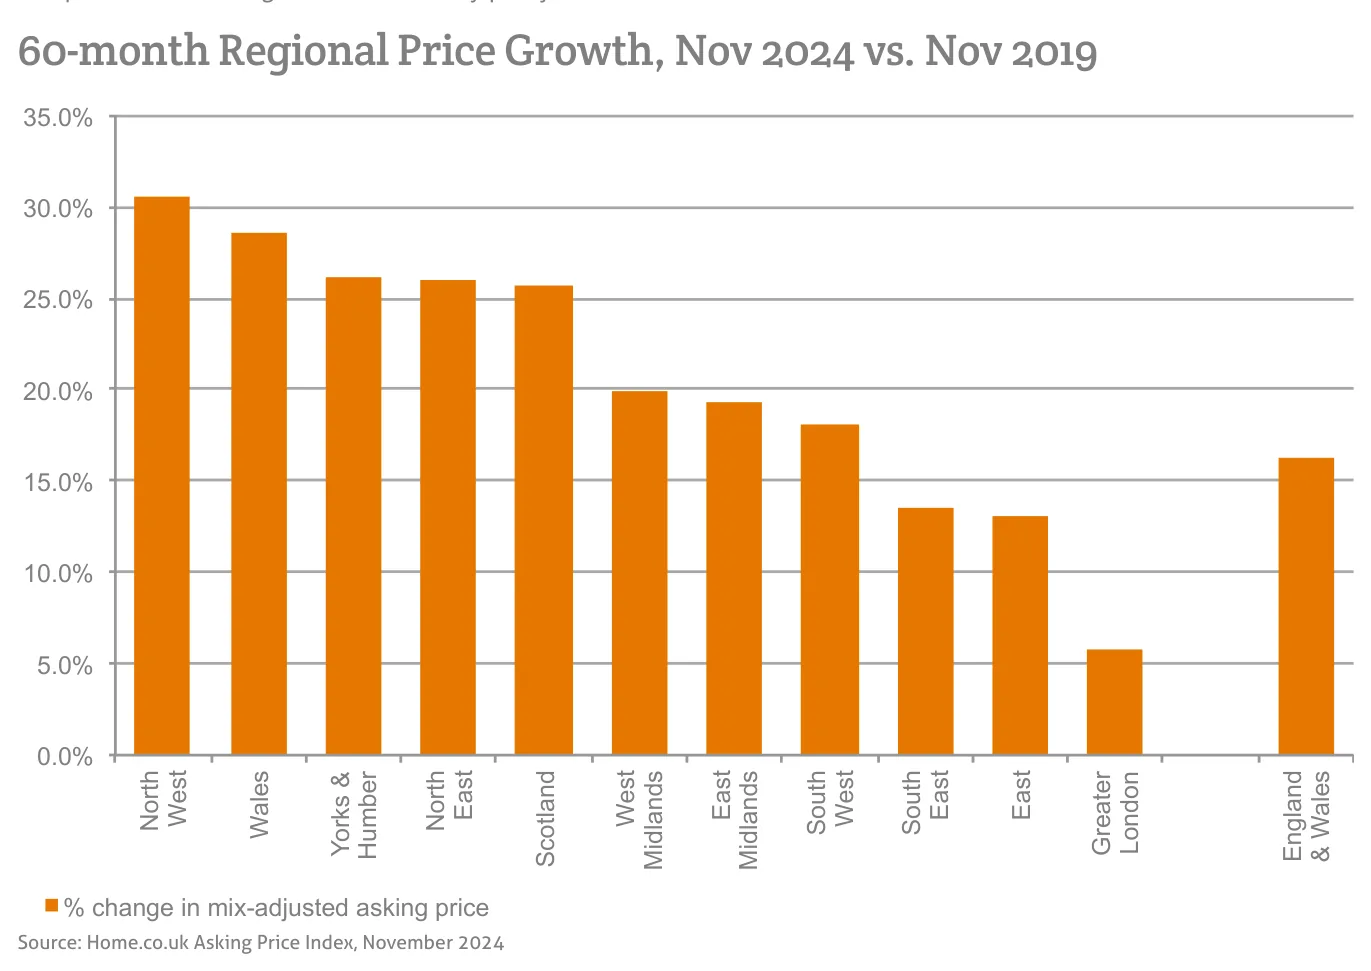
Source: Home.co.uk Asking Price Index, November 2024
Source: Home.co.uk Asking Price Index, November 2024
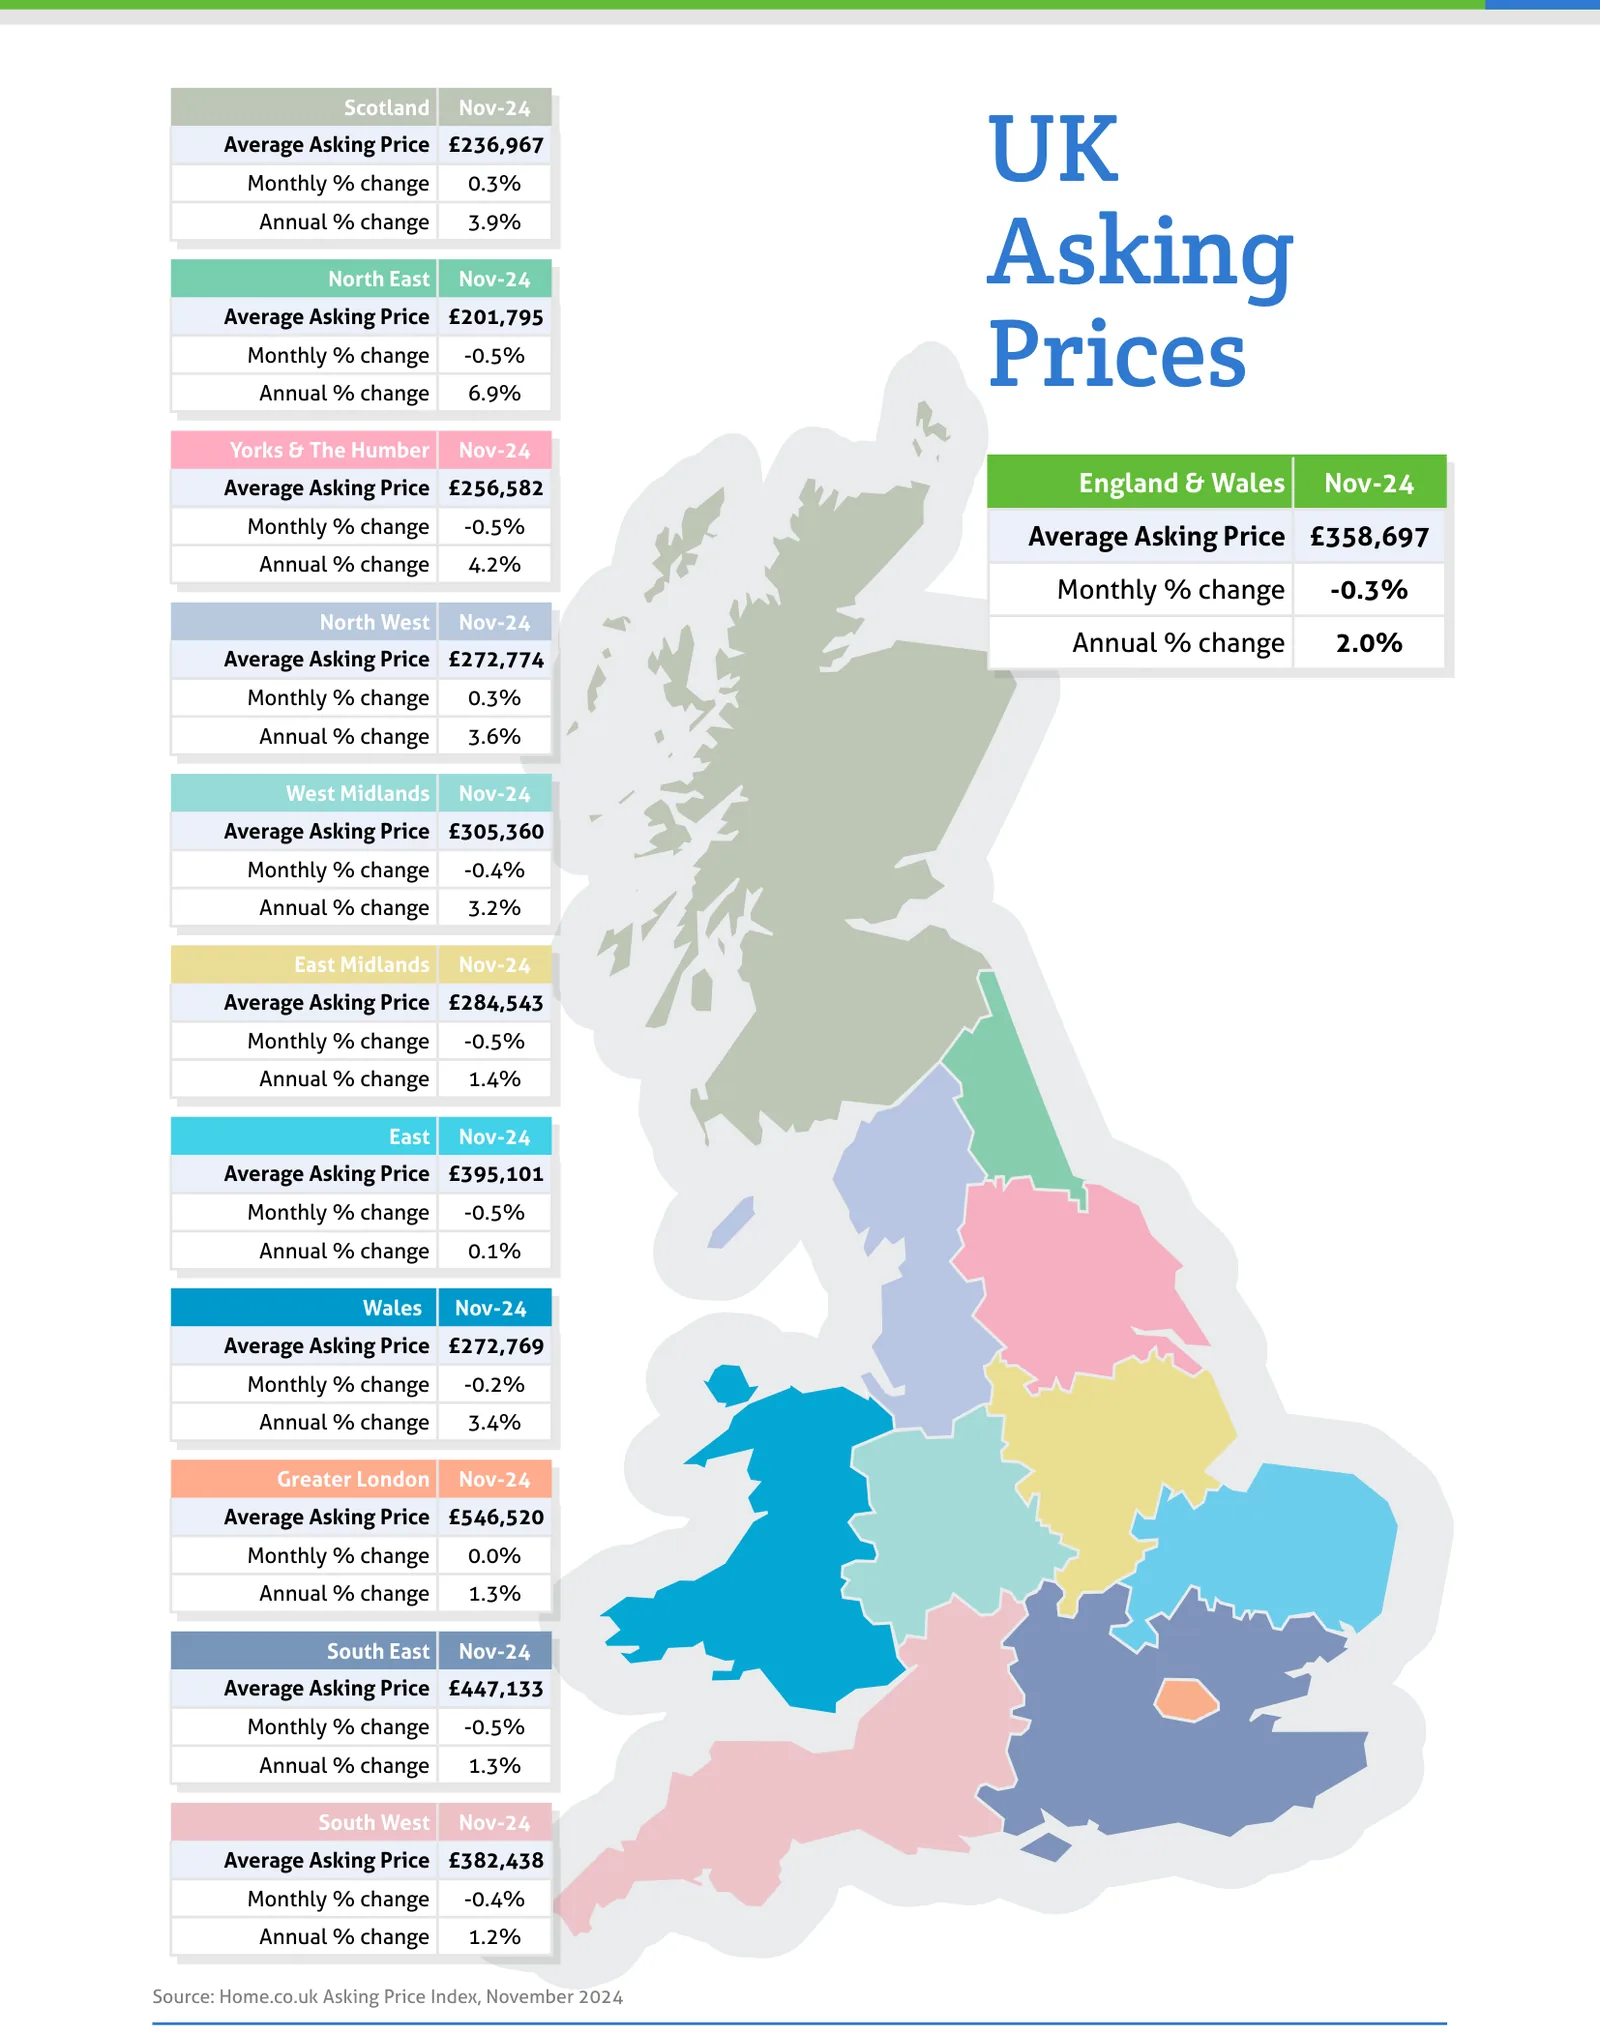
Source: Home.co.uk Asking Price Index, November 2024
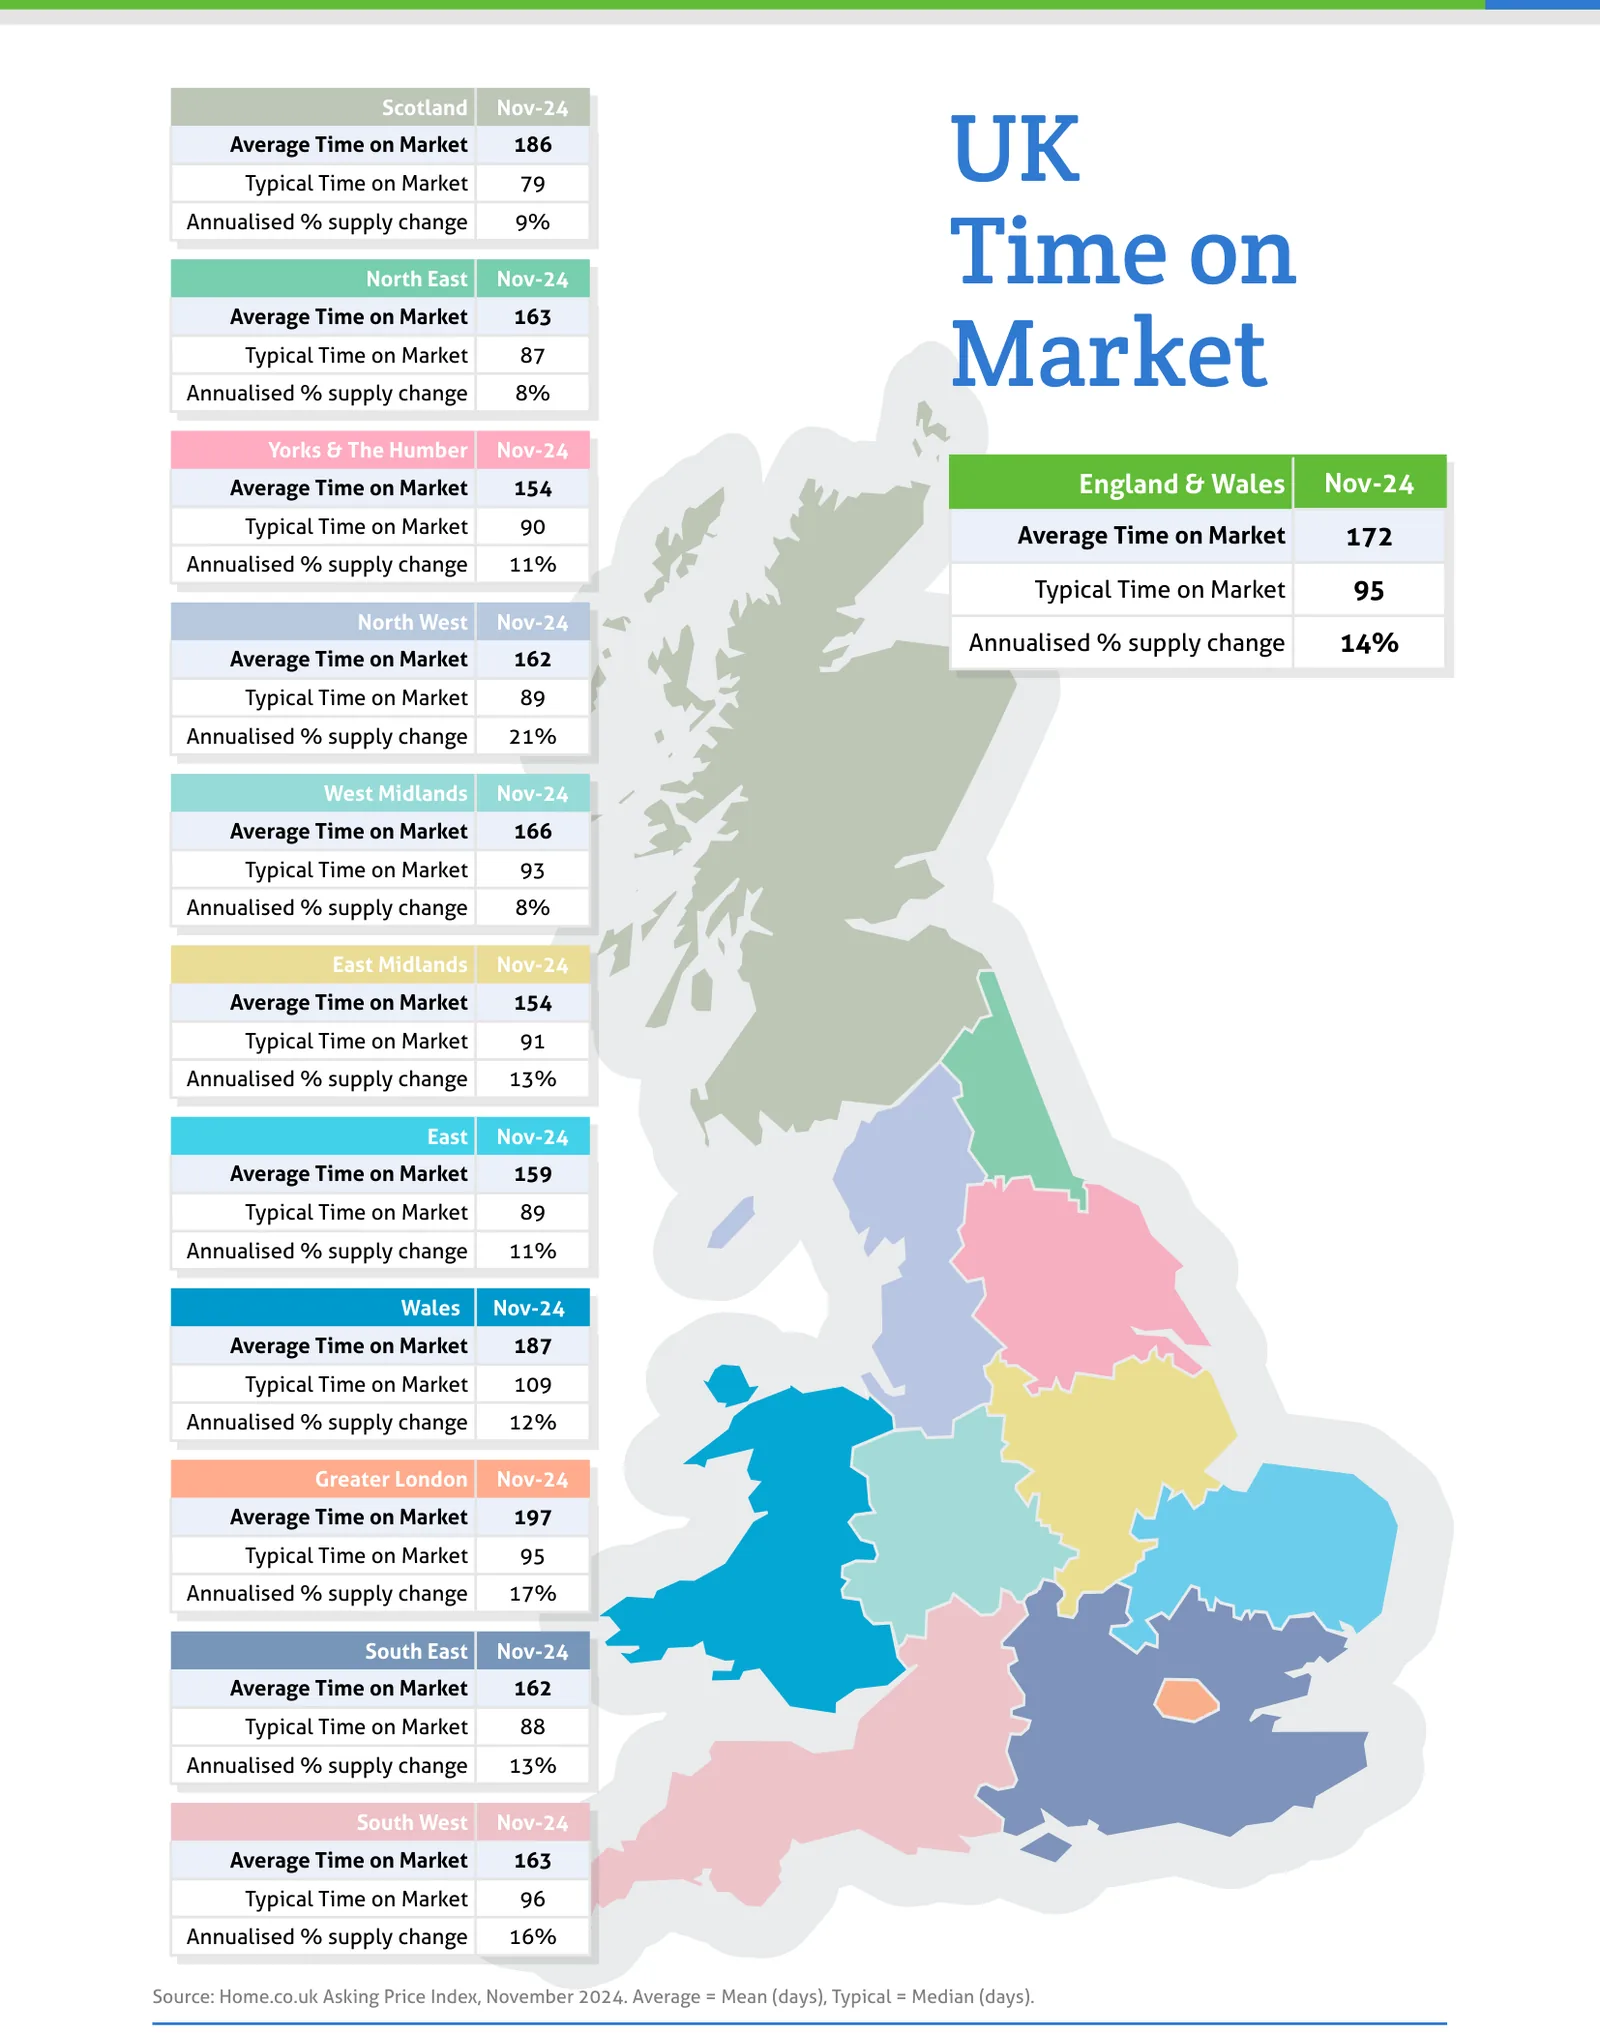
Source: Home.co.uk Asking Price Index, November 2024. Average = Mean (days), Typical = Median (days).
Regional tables
UK Asking Prices, Nov-24
| Region | Average Asking Price | Monthly % change | Annual % change |
|---|---|---|---|
| Scotland | £236,967 | 0.3% | 3.9% |
| North East | £201,795 | -0.5% | 6.9% |
| Yorks & The Humber | £256,582 | -0.5% | 4.2% |
| England & Wales | £358,697 | -0.3% | 2.0% |
| North West | £272,774 | 0.3% | 3.6% |
| West Midlands | £305,360 | -0.4% | 3.2% |
| East Midlands | £284,543 | -0.5% | 1.4% |
| East | £395,101 | -0.5% | 0.1% |
| Wales | £272,769 | -0.2% | 3.4% |
| Greater London | £546,520 | 0.0% | 1.3% |
| South East | £447,133 | -0.5% | 1.3% |
| South West | £382,438 | -0.4% | 1.2% |
UK Time on Market, Nov-24
| Region | Average Time on Market | Typical Time on Market | Annualised % supply change |
|---|---|---|---|
| Scotland | 186 | 79 | 9% |
| North East | 163 | 87 | 8% |
| Yorks & The Humber | 154 | 90 | 11% |
| England & Wales | 172 | 95 | 14% |
| North West | 162 | 89 | 21% |
| West Midlands | 166 | 93 | 8% |
| East Midlands | 154 | 91 | 13% |
| East | 159 | 89 | 11% |
| Wales | 187 | 109 | 12% |
| Greater London | 197 | 95 | 17% |
| South East | 162 | 88 | 13% |
| South West | 163 | 96 | 16% |
From the director's commentary
"While much of the press seem to be eulogising our first female chancellor's budget, I remain in shock and despair at the simultaneous attacks on the Private Rented Sector and the poorest tenants in the UK. Rachel Reeves' budget hit new private investment in much-needed new rental stock by hiking stamp duty and concomitantly continued the freeze on Local Housing Allowance."
Doug Shephard, Director at Home.co.uk
Read the full November 2024 edition (PDF, 10 pages)
About the Home Asking Price Index
The Home Asking Price Index measures the change in the prices sellers ask for residential property across England, Wales and Scotland. Today it is computed every month from around half a million advertised homes and is mix-adjusted, so a change in what happens to be on the market does not move the figure; earlier editions state the sample they were built from. Because an asking price is set months before a sale completes, the index runs around five months ahead of completed-sale measures such as the UK House Price Index.
Every edition in the archive, back to October 2006, is listed on the index page. How we measure the UK property market explains the listing data behind it, and today's figures by area are on house prices and rental prices.
Text and figures above are quoted from the November 2024 edition as published, with punctuation normalised for the web, and are not revised. Later editions may restate them.
More in What is happening to house prices: the Home guide
Thinking about your next move?
See what your home's worth in seconds, with the UK's longest-running property data behind it.
Get an instant valuation