

























Home Asking Price Index, November 2023: stock levels and prices in seasonal decline
England and Wales asking prices fell 0.6% during October, taking the annual change to -1.6%, while unsold stock dropped to 468,220.

This is the November 2023 edition of the Home Asking Price Index, released on 16 November 2023, under the headline:
Stock Levels and Prices in Seasonal Decline
The headlines and summary below are the report's own words, with the key figures as it published them, followed by the report's charts and regional tables as printed.
Headlines
- In line with seasonal expectations, the total sales stock count for England and Wales has dropped significantly since the October reading. The current total of unsold property is 468,220, around 5,000 lower than last month.
- Asking prices across England and Wales dropped by 0.6% during October, making the year-on-year fall in asking prices just -1.6%.
- The supply rate of new instructions entering the market is remarkably restrained overall: down 3% year-on-year and down 8% vs. October 2018. The largest increase at the regional level was observed in the North East (+7%), while the largest year-on-year fall in supply was in Greater London (-8%).
- The Typical Time on Market for unsold property in England and Wales increased by three days during October in line with seasonal expectations. The current median is 93 days; in pre-COVID October 2019, the same measure was 101 days.
- Prices have fallen in all English regions, Scotland and Wales since last month; the largest fall was in the South West where prices plunged 1.2%.
- The Scottish property market remains the leader in terms of annualised price growth (+5.1%), while the East Midlands is now the worst performer at -3.6%.
- Rents across the UK continue to rise overall (6.1% annualised) but more slowly than before and are now led by Scotland (up 18.0%). Greater London is now one of the worst-performing regions at just +1.8% due to a large increase in supply year-on-year.
- The current growth leaders in London asking rents are now the boroughs of Bexley and Hackney (+20.4% and +16.1% annualised respectively). Rent growth in the capital has dropped further over the last month and eight prime boroughs now show year-on-year falls.
Summary
Prices fell by 0.6% during October in line with seasonal expectations. The total stock of unsold properties on the market also fell, as is normal towards the end of the year. Overall, despite higher borrowing costs, the current market continues to indicate clear similarities to that of pre-COVID years 2018 and 2019 in terms of price movements and stock levels, although lower Typical Time on Market for unsold property and tighter supply suggest a somewhat more robust marketplace and therefore greater price support.
The strength of the rental market remains a key factor in supporting the sales market. High demand has meant letting is both a profitable and speedy alternative to selling, while the high cost of renting supports demand from homebuyers and investors alike. Across the UK, rents are 49% higher than they were five years ago and supply remains tight in most regions. However, the current surge in supply (up by 46% vs. October 2022) in the Greater London region is the first significant sign of weakness. Indeed, asking rents are now falling in the more central boroughs. This market correction is occurring in the wake of the massive hikes observed in the latter half of 2022.
Key figures
| Measure | Figure |
|---|---|
| Total unsold stock | 468,220 |
| Monthly change in asking prices | -0.6% |
| Annual change in asking prices | -1.6% |
| Change in new instructions vs year-on-year | -3% |
| Change in new instructions vs 2018 | -8% |
| Typical Time on Market | 93 days |
| Typical Time on Market, October 2019 | 101 days |
| UK average asking rent annual change | 6.1% |
Figures are for England and Wales unless the report states otherwise, as published in the edition.
Charts from the report
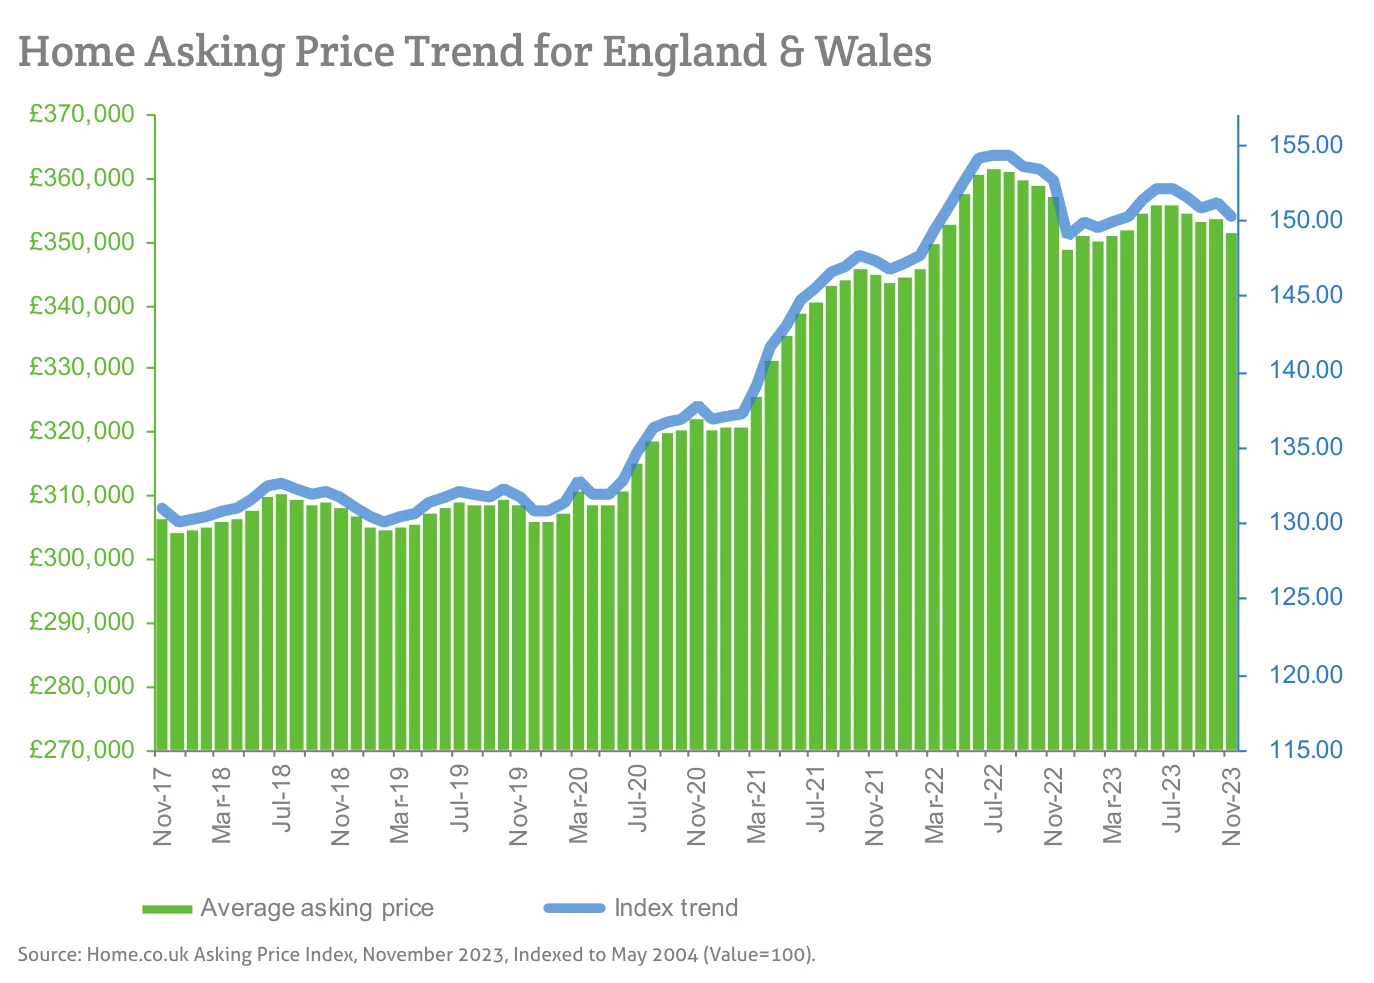
Source: Home.co.uk Asking Price Index, November 2023, Indexed to May 2004 (Value=100).
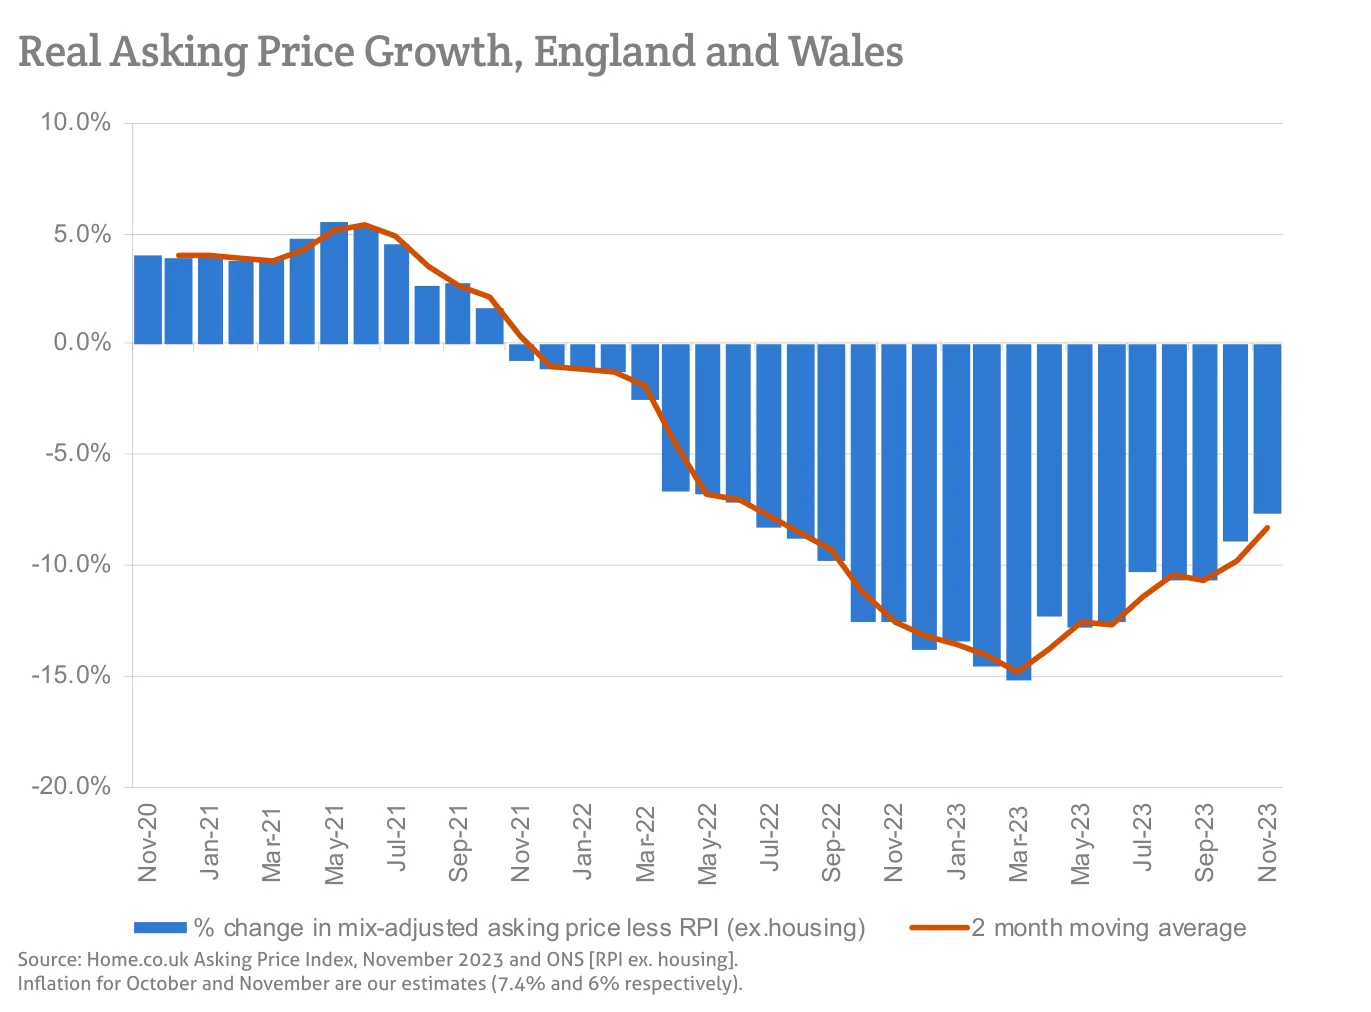
Source: Home.co.uk Asking Price Index, November 2023 and ONS [RPI ex. housing].
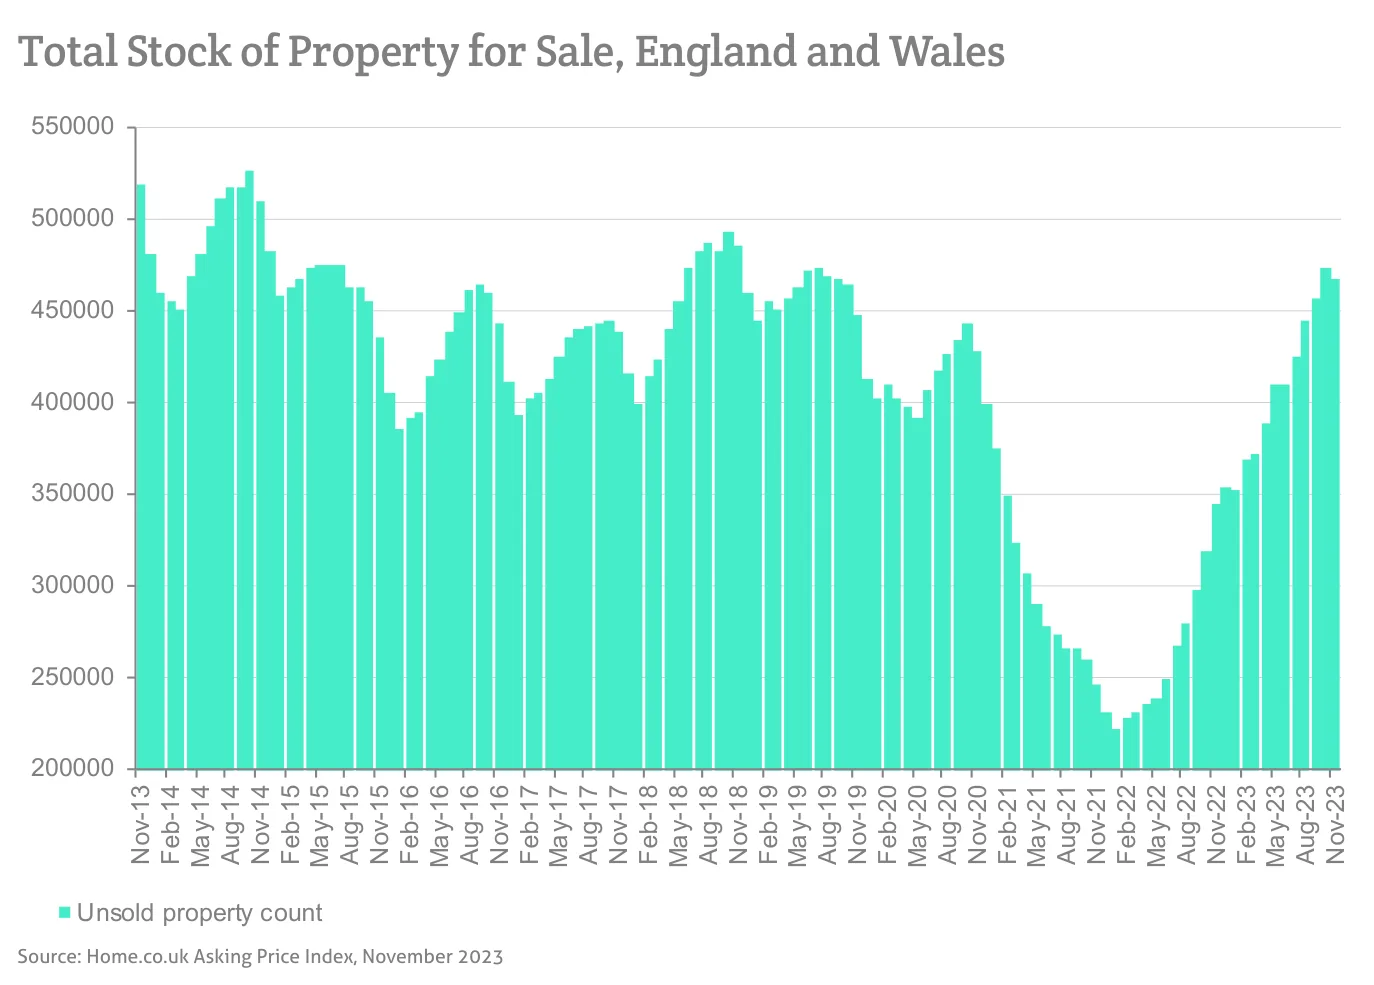
Source: Home.co.uk Asking Price Index, November 2023
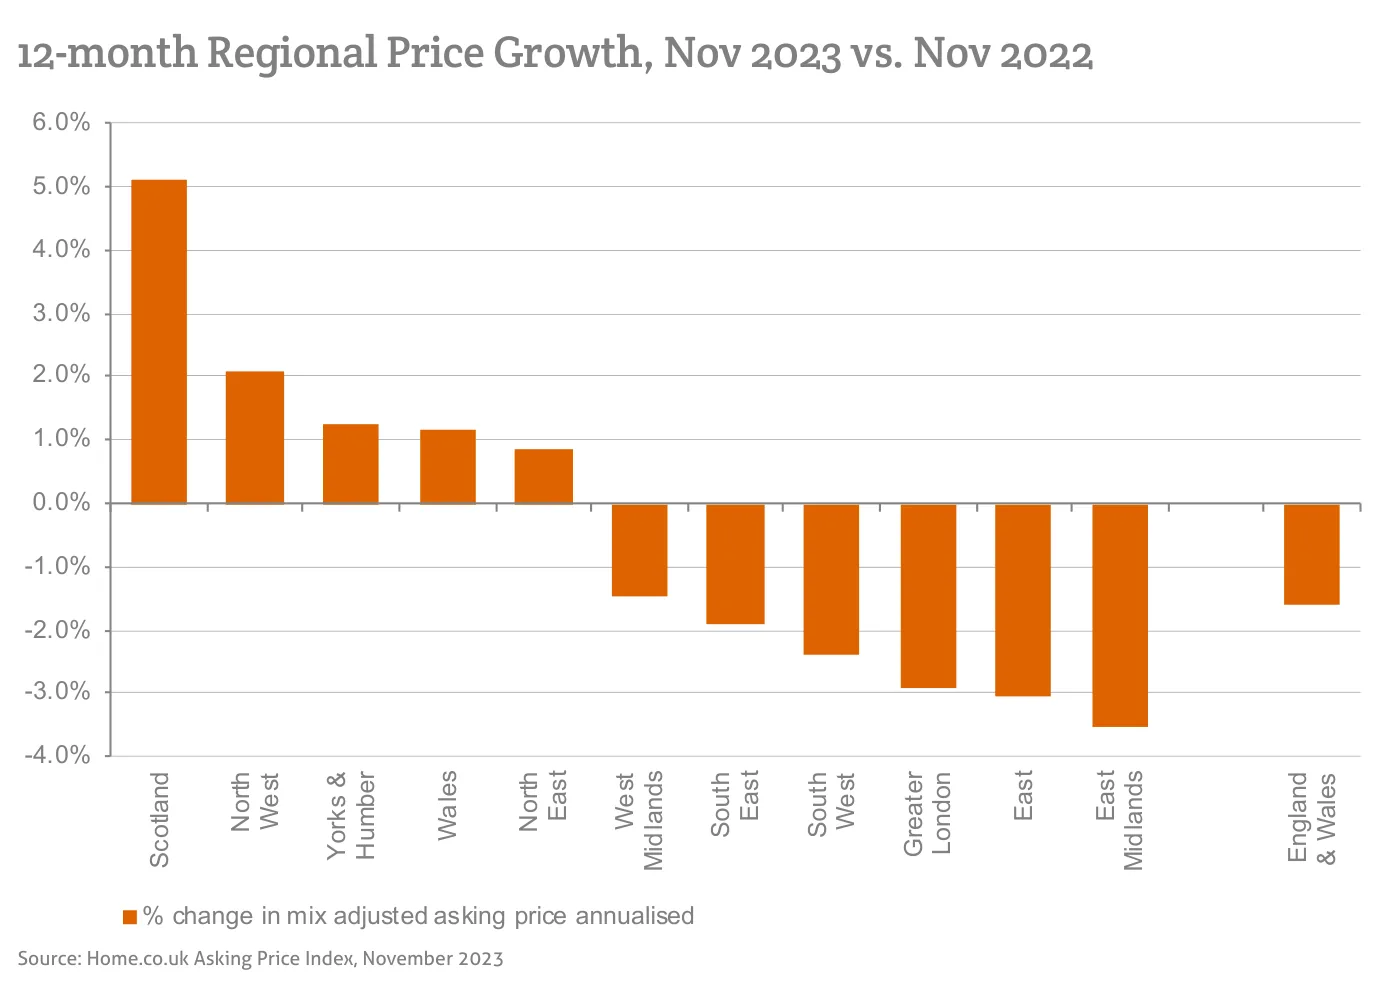
Source: Home.co.uk Asking Price Index, November 2023
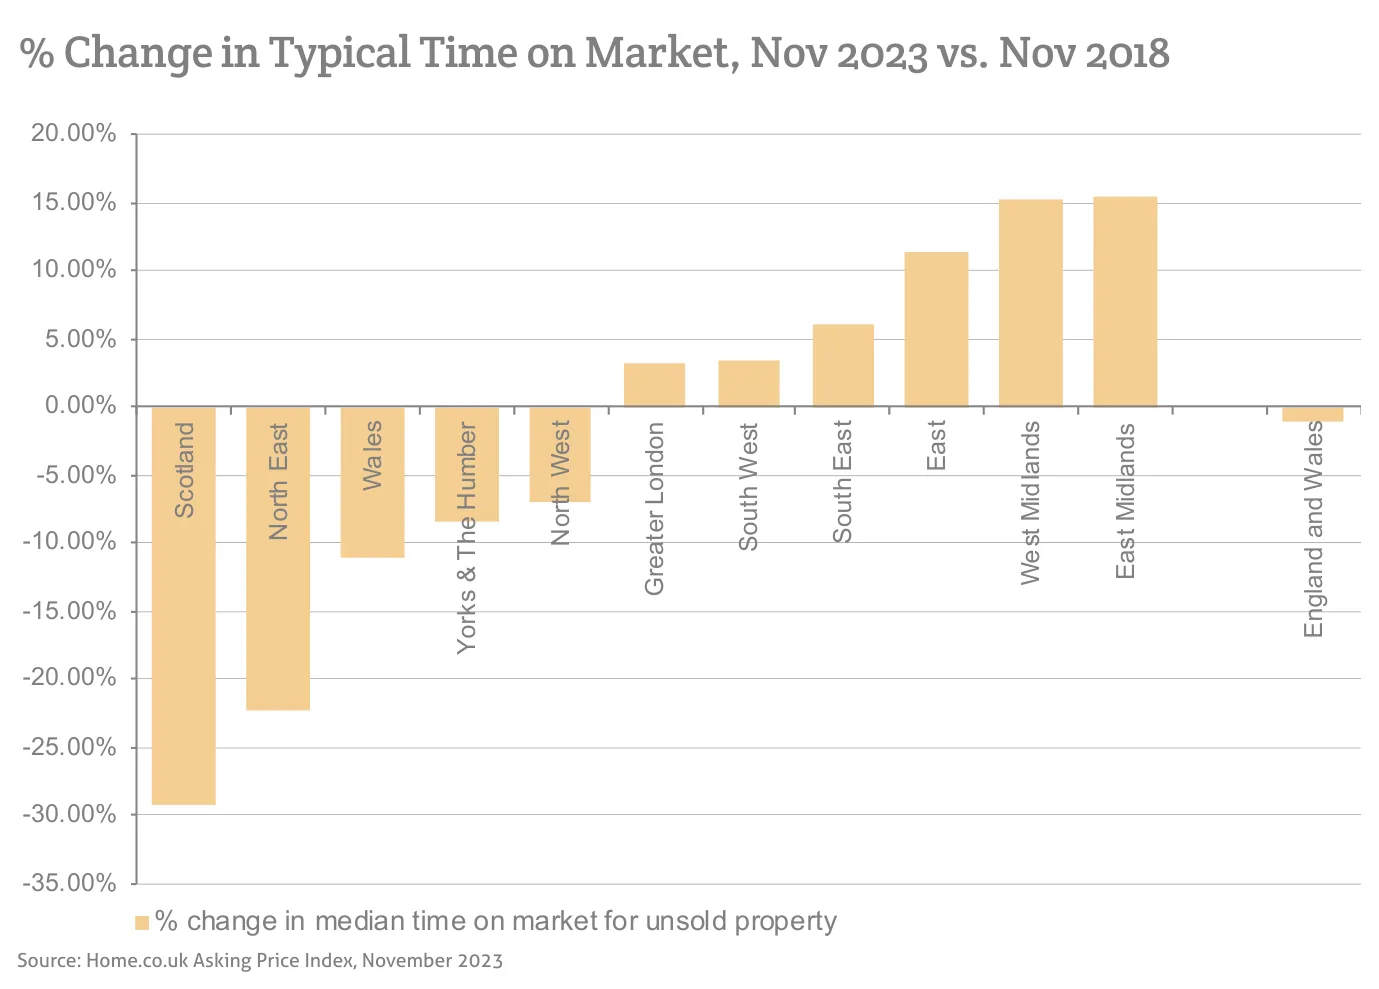
Source: Home.co.uk Asking Price Index, November 2023
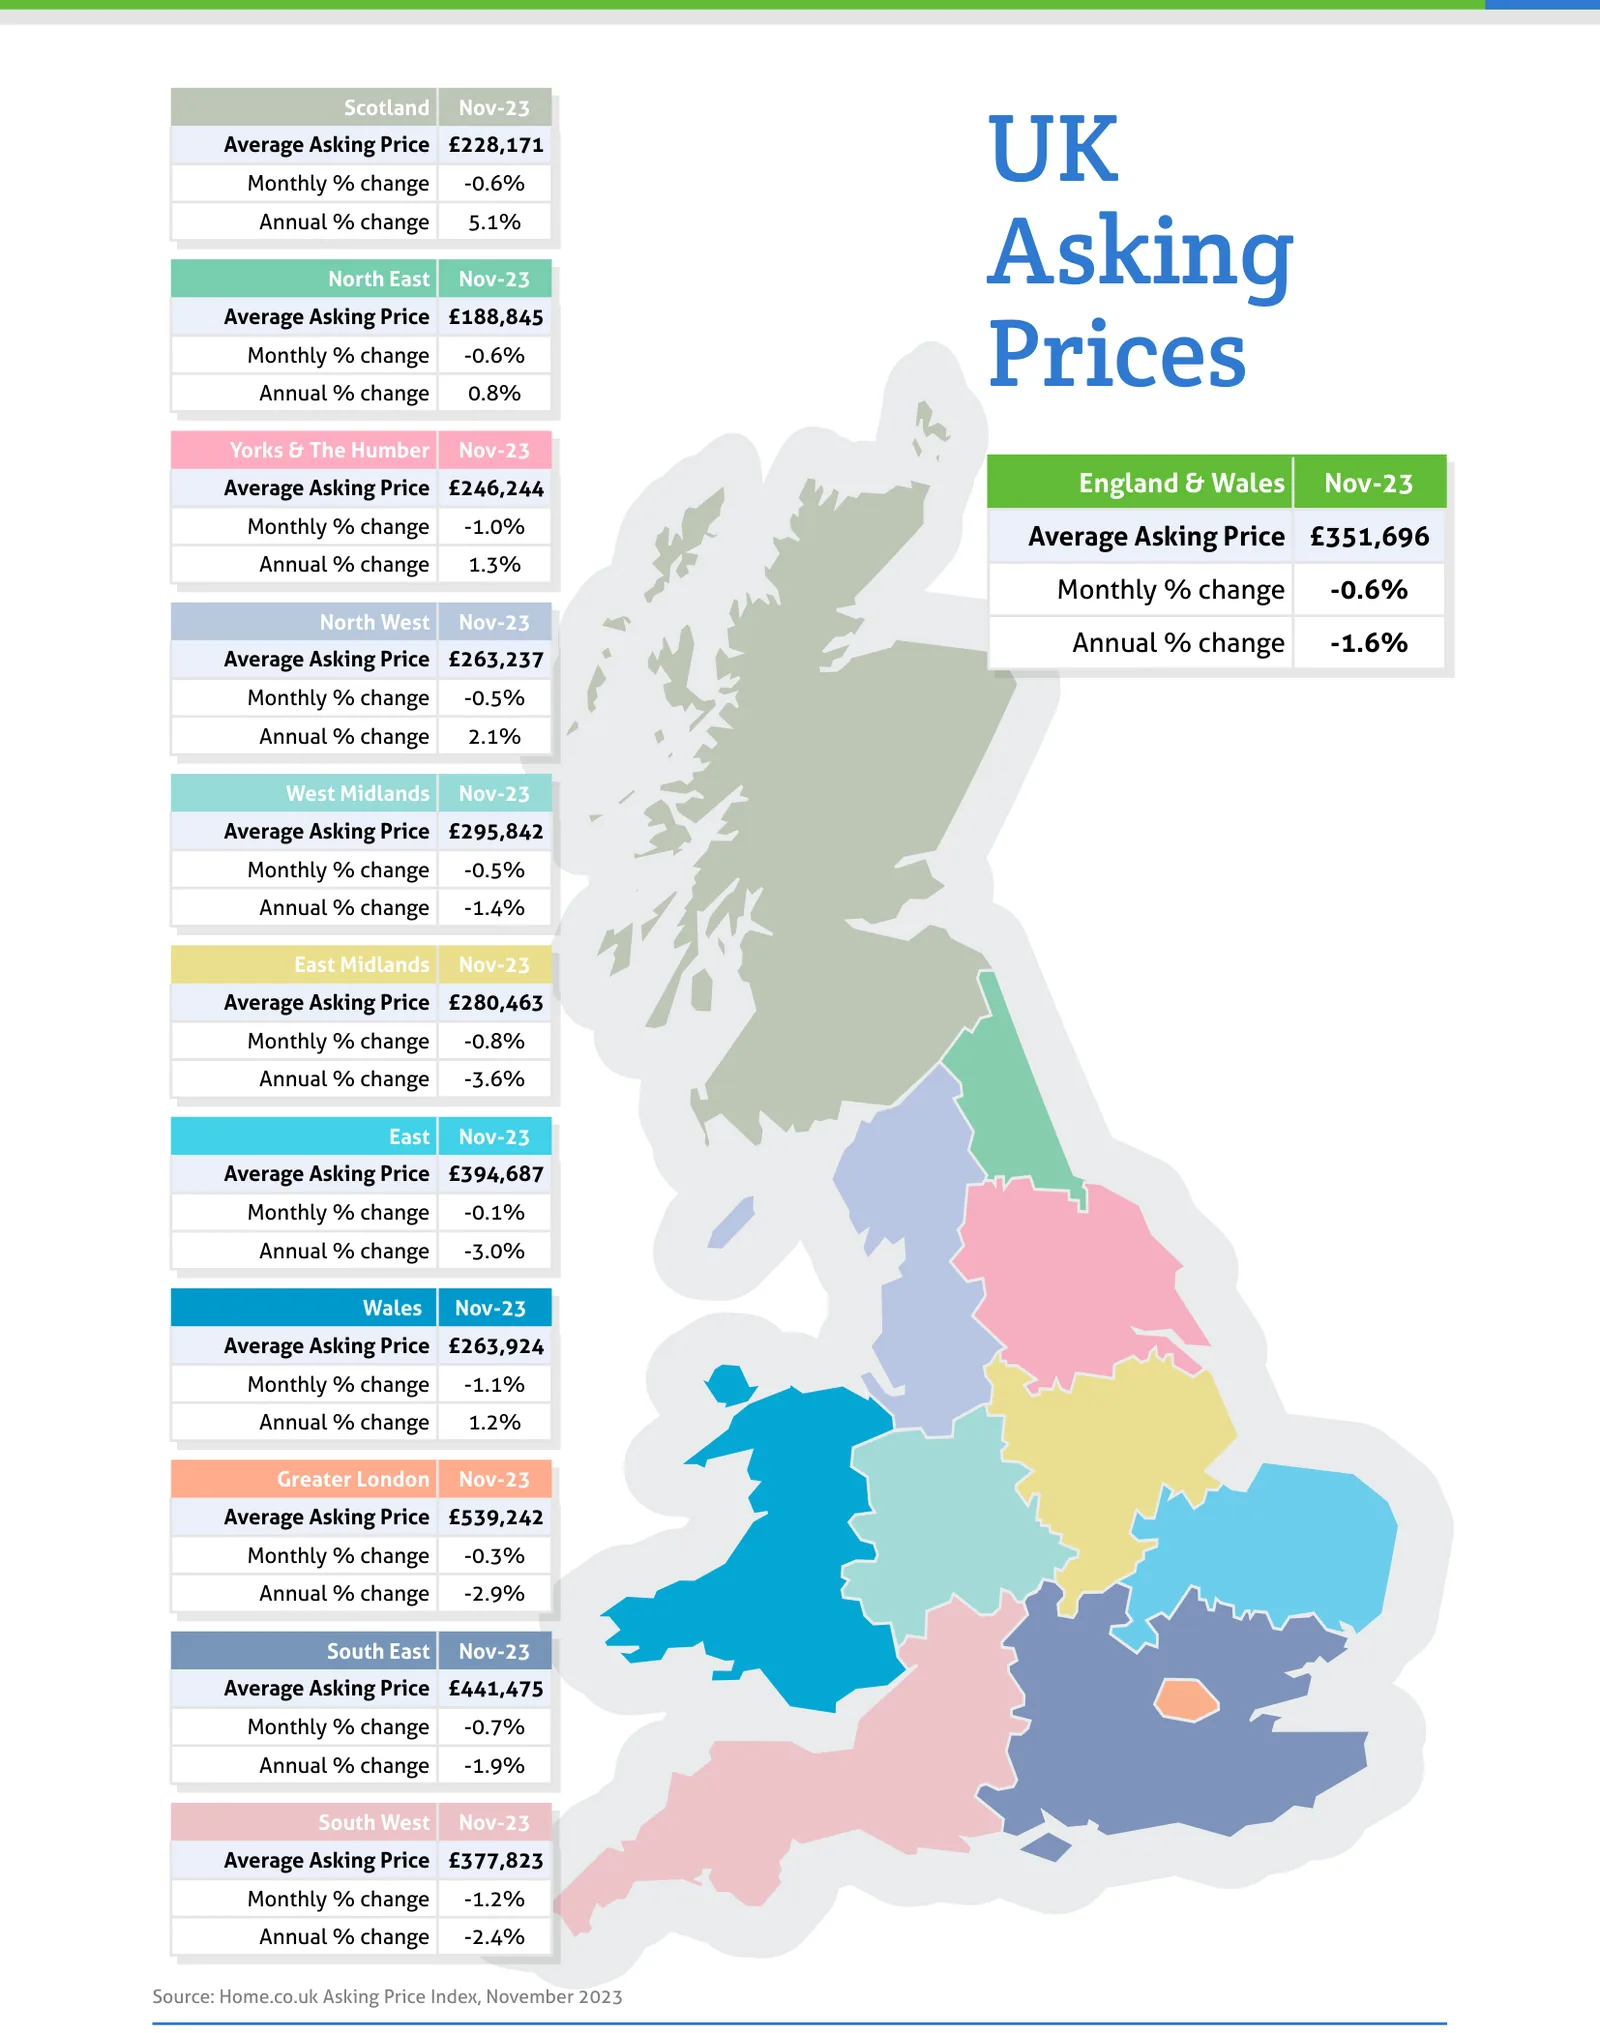
Source: Home.co.uk Asking Price Index, November 2023
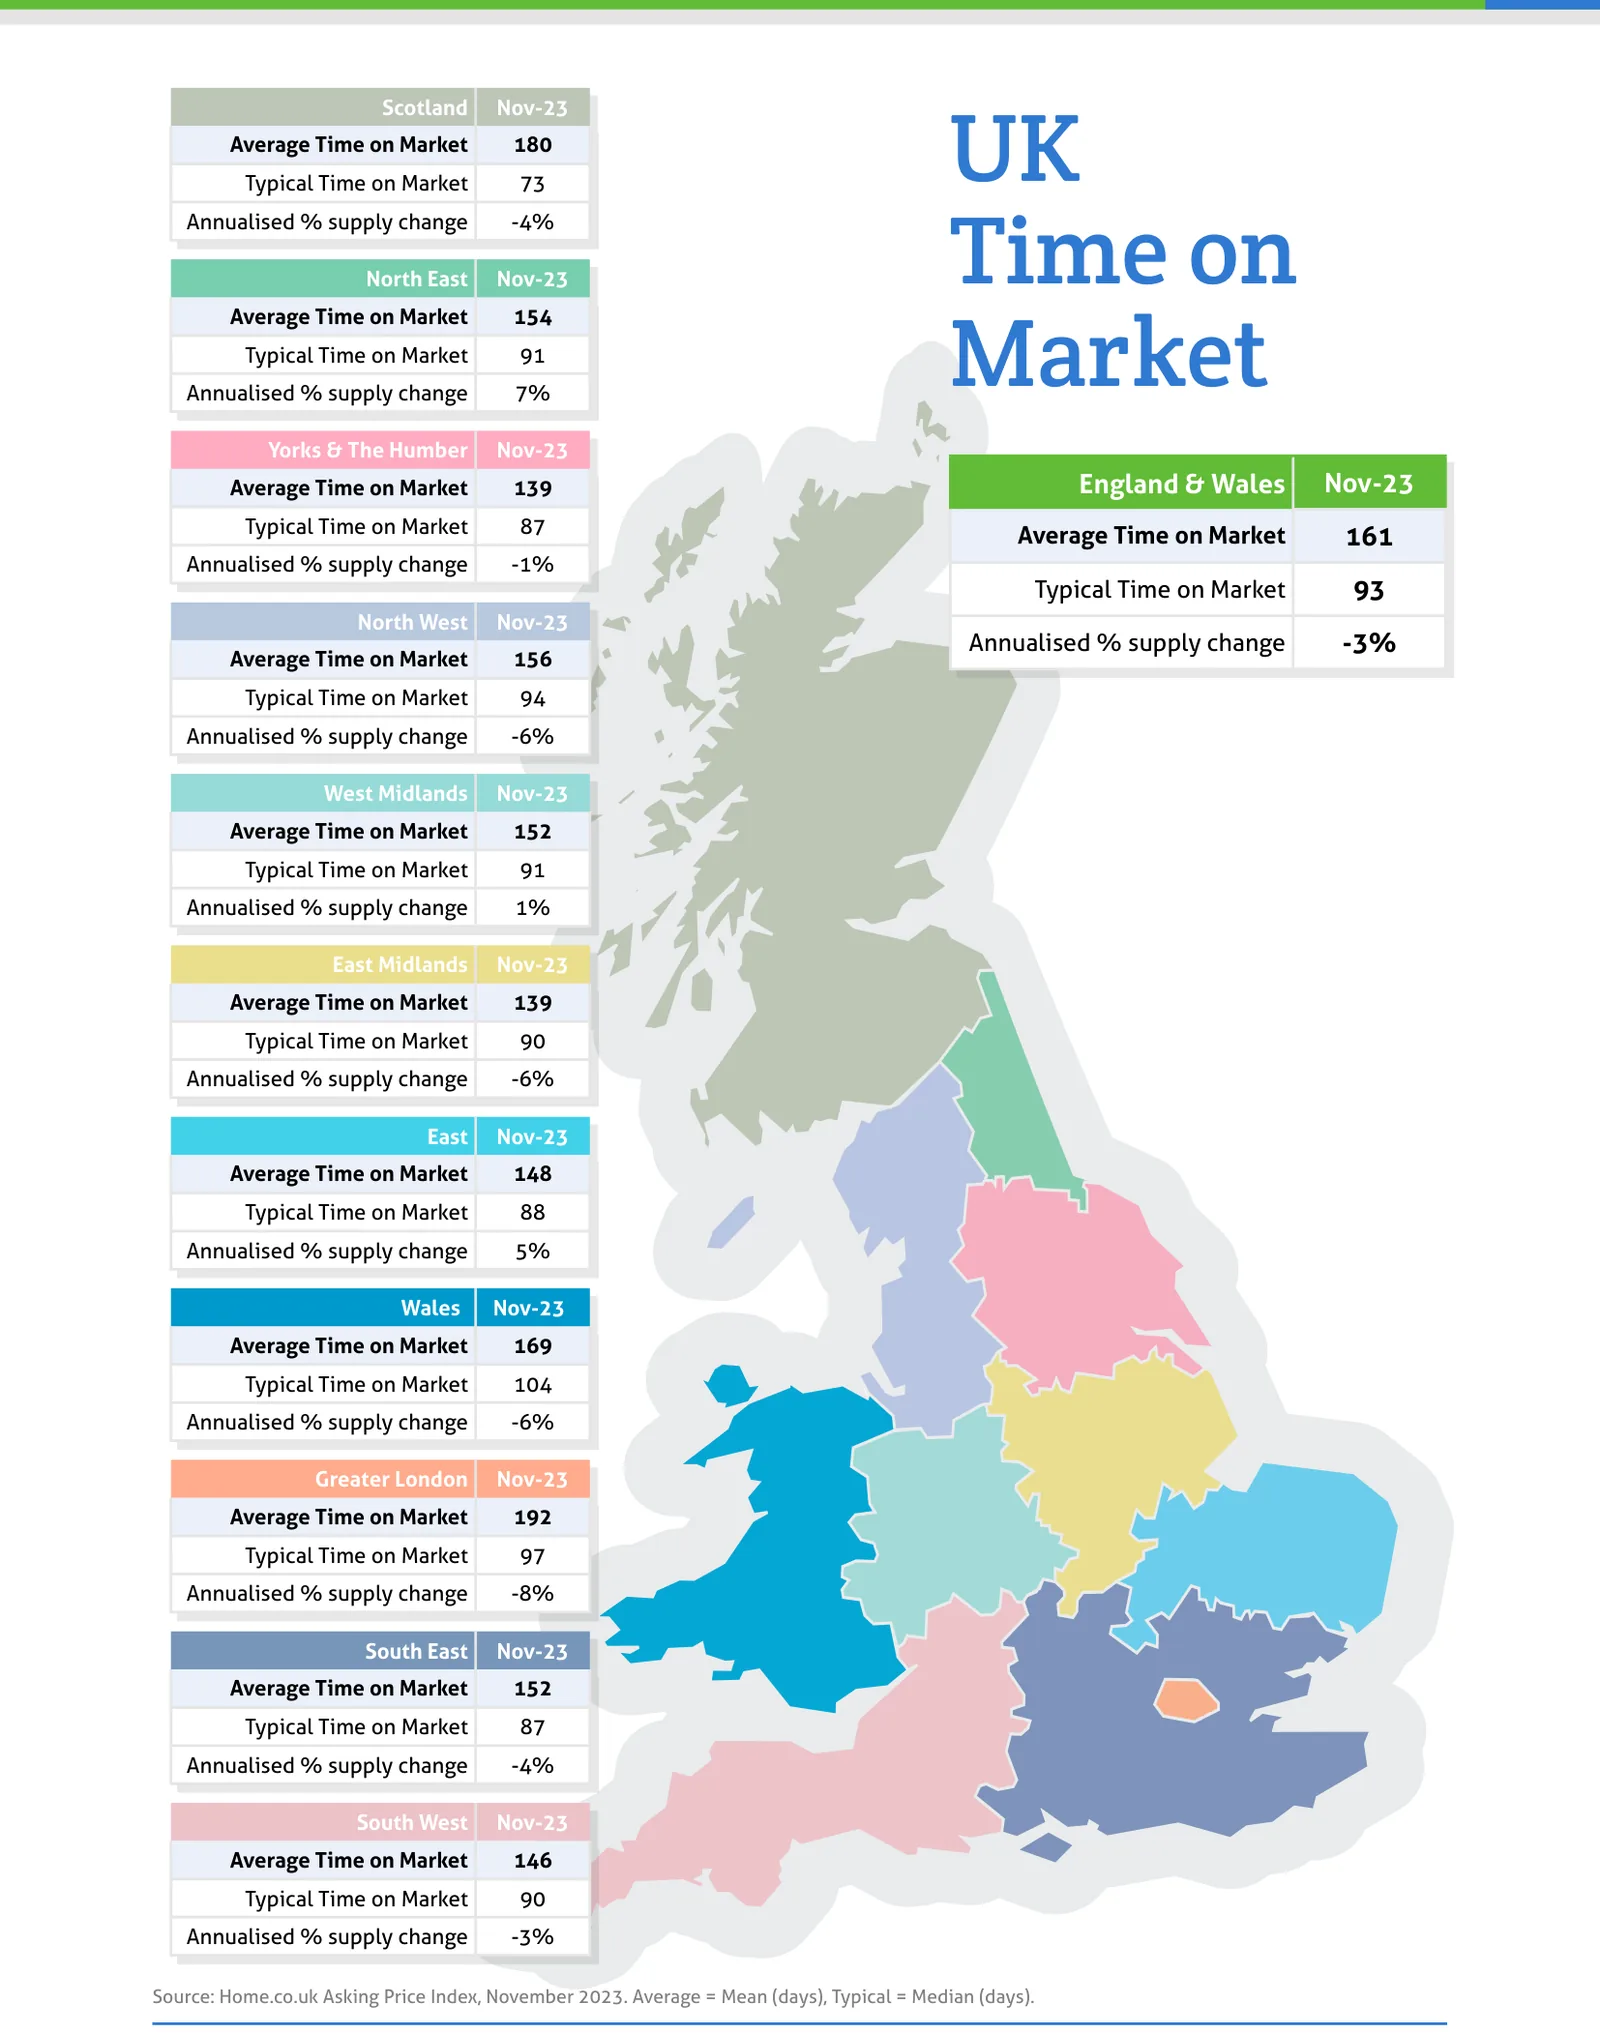
Source: Home.co.uk Asking Price Index, November 2023. Average = Mean (days), Typical = Median (days).
Regional tables
UK Asking Prices, Nov-23
| Region | Average Asking Price | Monthly % change | Annual % change |
|---|---|---|---|
| Scotland | £228,171 | -0.6% | 5.1% |
| North East | £188,845 | -0.6% | 0.8% |
| Yorks & The Humber | £246,244 | -1.0% | 1.3% |
| England & Wales | £351,696 | -0.6% | -1.6% |
| North West | £263,237 | -0.5% | 2.1% |
| West Midlands | £295,842 | -0.5% | -1.4% |
| East Midlands | £280,463 | -0.8% | -3.6% |
| East | £394,687 | -0.1% | -3.0% |
| Wales | £263,924 | -1.1% | 1.2% |
| Greater London | £539,242 | -0.3% | -2.9% |
| South East | £441,475 | -0.7% | -1.9% |
| South West | £377,823 | -1.2% | -2.4% |
UK Time on Market, Nov-23
| Region | Average Time on Market | Typical Time on Market | Annualised % supply change |
|---|---|---|---|
| Scotland | 180 | 73 | -4% |
| North East | 154 | 91 | 7% |
| Yorks & The Humber | 139 | 87 | -1% |
| England & Wales | 161 | 93 | -3% |
| North West | 156 | 94 | -6% |
| West Midlands | 152 | 91 | 1% |
| East Midlands | 139 | 90 | -6% |
| East | 148 | 88 | 5% |
| Wales | 169 | 104 | -6% |
| Greater London | 192 | 97 | -8% |
| South East | 152 | 87 | -4% |
| South West | 146 | 90 | -3% |
From the director's commentary
"Meanwhile, the Bank of England is having trouble putting the inflation genie back in the bottle (a result of their coordinated and irresponsible use of QE unleashed on the western world). It's not Putin's fault or that of COVID; it's the huge money supply (see M4) increase of 24% between early 2020 and the record high in October 2022."
Doug Shephard, Director at Home.co.uk
Read the full November 2023 edition (PDF, 10 pages)
About the Home Asking Price Index
The Home Asking Price Index measures the change in the prices sellers ask for residential property across England, Wales and Scotland. Today it is computed every month from around half a million advertised homes and is mix-adjusted, so a change in what happens to be on the market does not move the figure; earlier editions state the sample they were built from. Because an asking price is set months before a sale completes, the index runs around five months ahead of completed-sale measures such as the UK House Price Index.
Every edition in the archive, back to October 2006, is listed on the index page. How we measure the UK property market explains the listing data behind it, and today's figures by area are on house prices and rental prices.
Text and figures above are quoted from the November 2023 edition as published, with punctuation normalised for the web, and are not revised. Later editions may restate them.
More in What is happening to house prices: the Home guide
Thinking about your next move?
See what your home's worth in seconds, with the UK's longest-running property data behind it.
Get an instant valuation