

























Home Asking Price Index, November 2022: stock levels recover as home prices take a seasonal dip
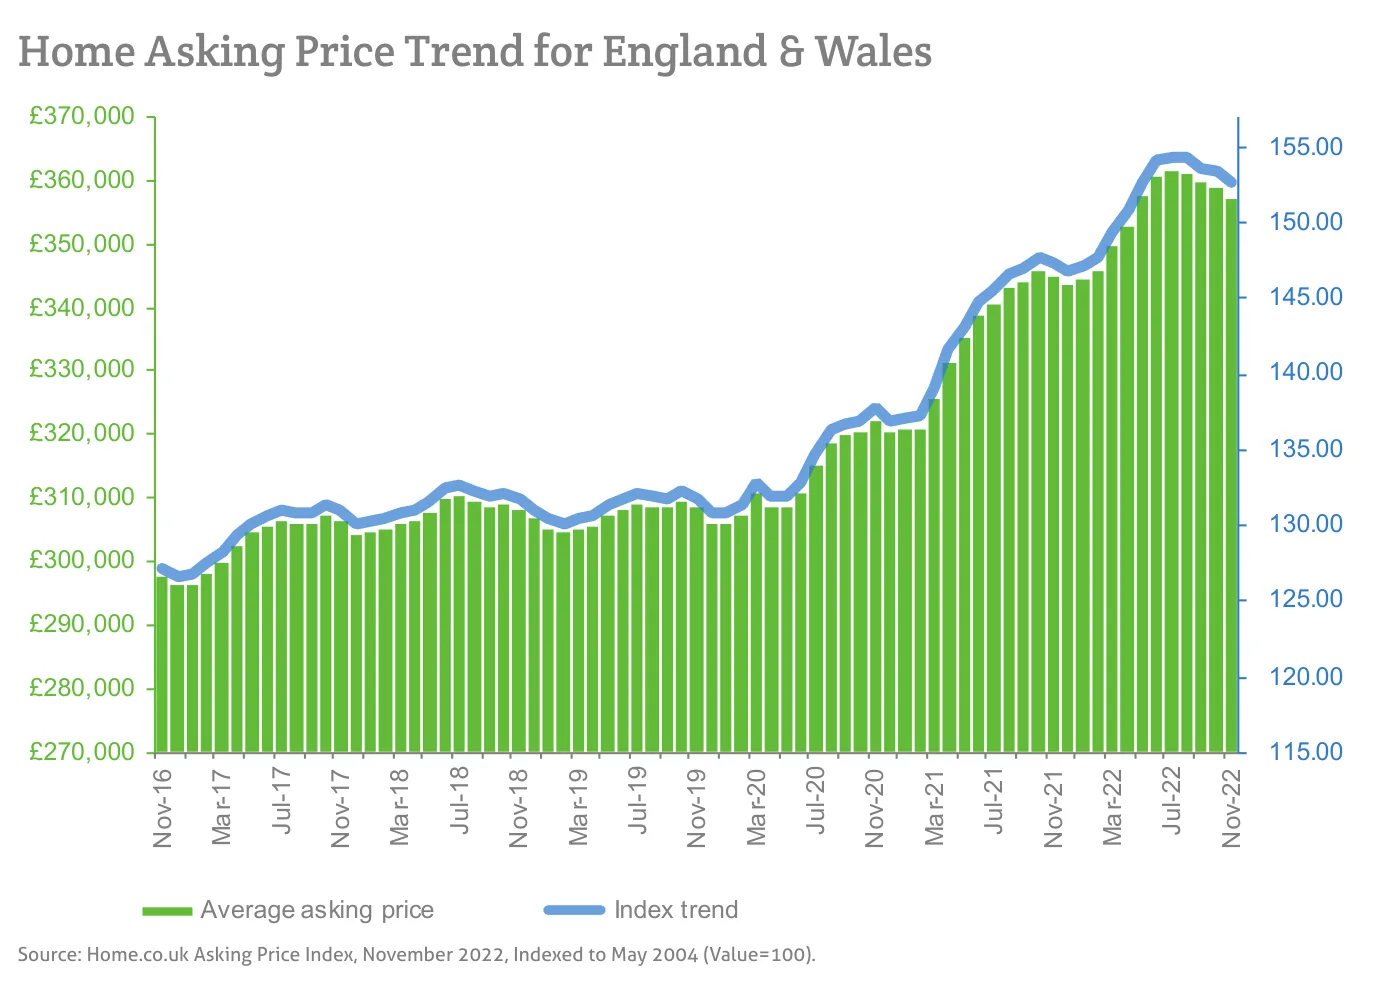
Asking prices in England and Wales fell 0.5% for a third straight month while unsold stock rose 39.3% year-on-year.

This is the November 2022 edition of the Home Asking Price Index, released on 16 November 2022, under the headline:
Stock Levels Recover as Home Prices Take a Seasonal Dip
The headlines and summary below are the report's own words, with the key figures as it published them, followed by the report's charts and regional tables as printed.
Headlines
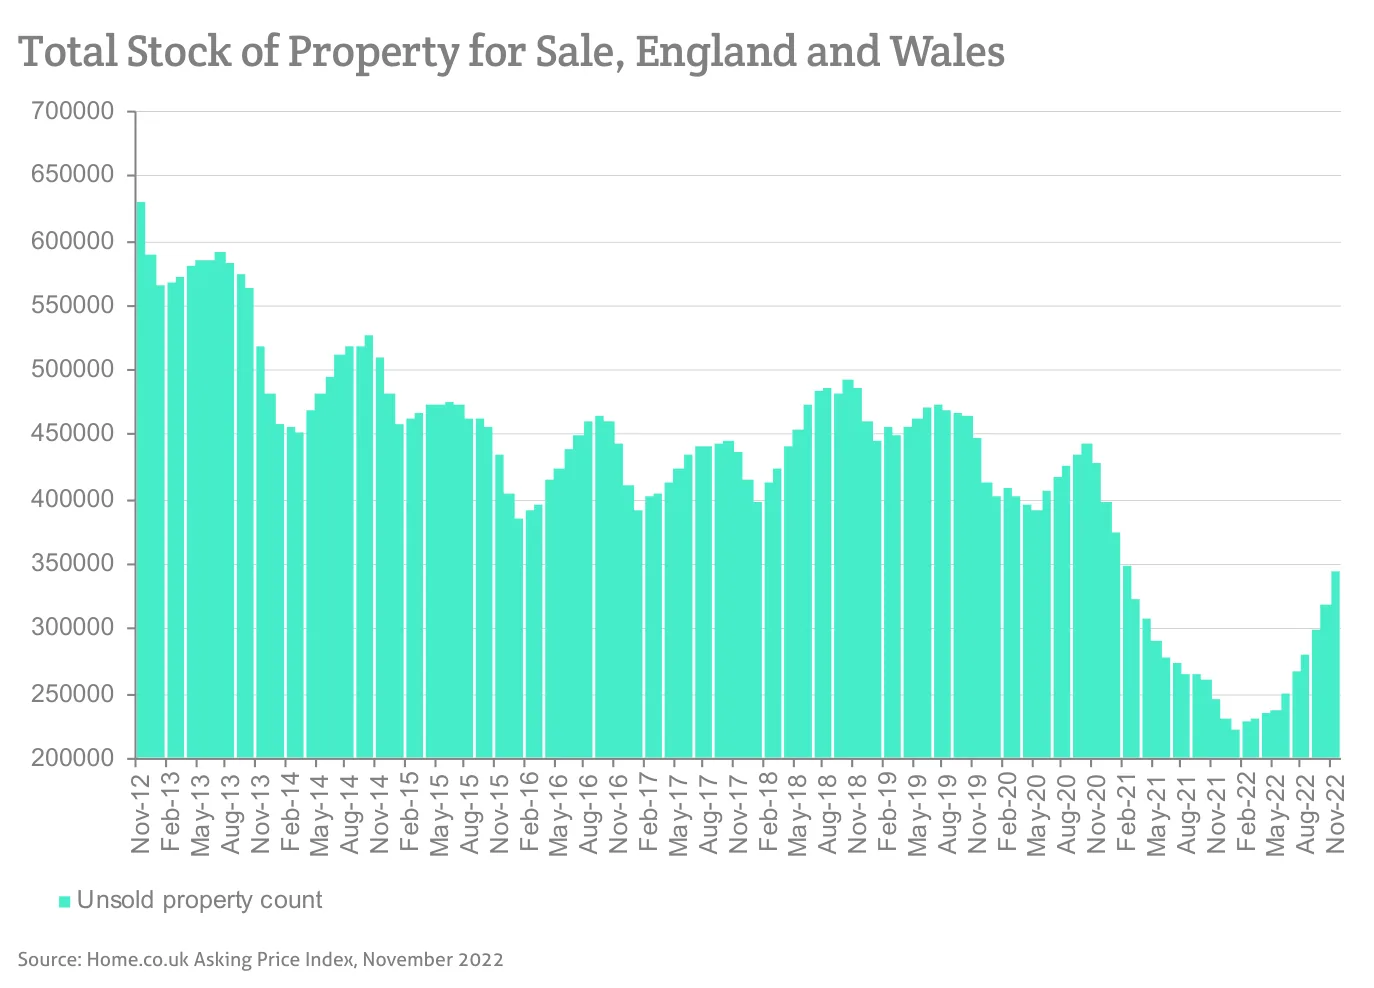
- Total sales stock in England and Wales increased again for a ninth consecutive month since the all-time low set in February, although the current total remains around 100,000 short of the 10-year average.
- Asking prices across England and Wales slid for a third consecutive month (by 0.5%), bringing the year-on-year rise to 3.6%, consistent with seasonal expectations.
- Stock of unsold property has increased by 39.3% over the last twelve months.
- By contrast, the stock of unsold property in Greater London has only increased by 3.5%.
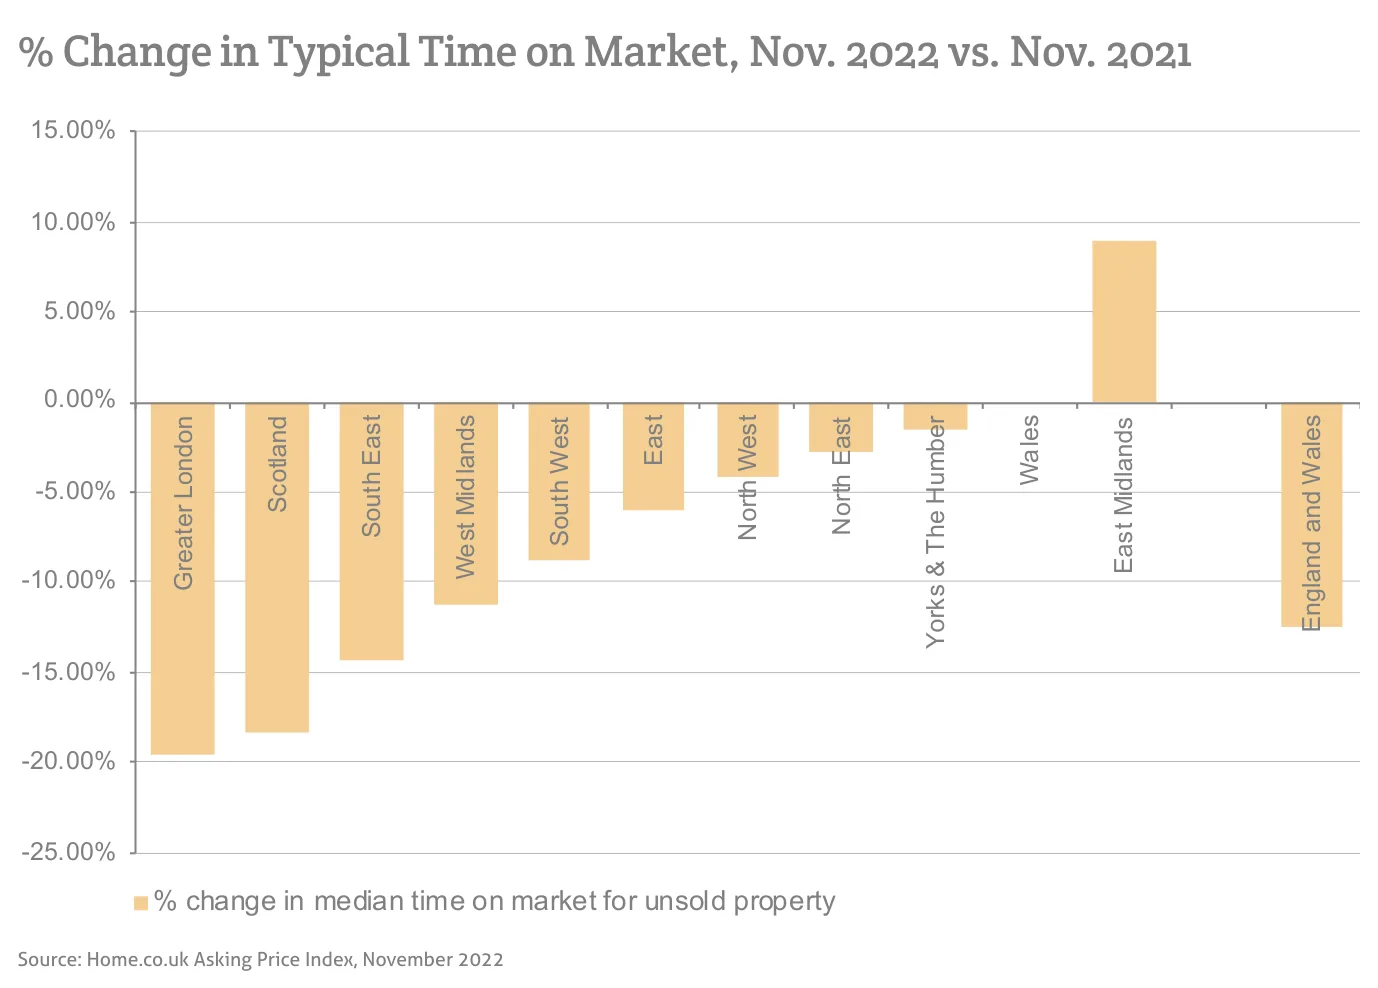
- The Typical Time on Market (median) for unsold property in England and Wales rose a seasonal three days to 70 days since last month, but is 10 days less than in November 2021, despite pricier mortgages.
- The East Midlands is the first region to indicate a year-on-year increase in Typical Time on Market (five days), heralding a return to more normal market conditions in the wake of the buying frenzy post-lockdown.
- The supply of new instructions was just 6% higher last month compared to October 2021 and 22% less than in October 2020, despite a rise in repossessions.
- North West and Welsh property markets now lead in annualised regional price growth (equal at 7.1%).
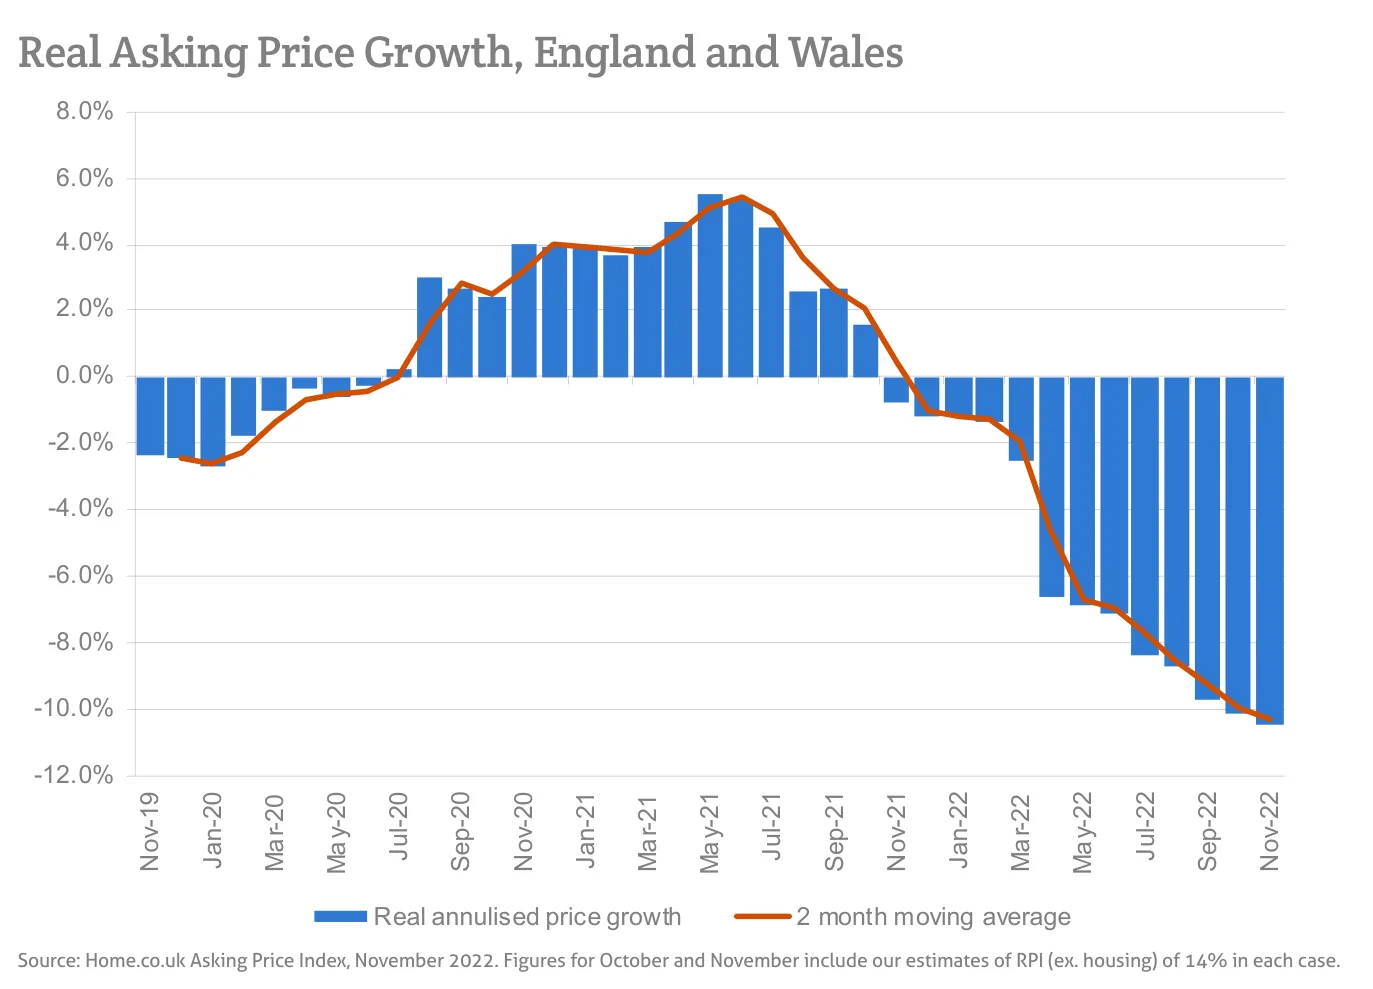
- Monetary inflation continues to remain very high at 14.3% (RPI ex. housing), making current real growth around -10% year-on-year. Moreover, despite rising mortgage costs, the real mortgage interest rate remains negative (around -8%).
- London rents continue to defy gravity. Renewed demand has decimated supply and this is driving annualised rental growth to a breathtaking rate of 26%.
- The current new growth leaders in asking rents are the boroughs of Newham, Hounslow and Merton (+47.5%, +43.7% and +35.4% annualised respectively).
Summary
The market still retains much momentum despite the headwinds of higher mortgage rates and economic turmoil. Both the median and mean time on market for unsold property in England and Wales are less than they were a year ago. Of course, some slowing is inevitable over the winter months and we can expect next year's market to proceed at a more leisurely pace. However, we expect demand to remain significant, especially given the new nil-rate stamp duty rate for properties under £250K.
The UK stock of unsold property on the market is well on the way to recovery following the unprecedented buying frenzy that depleted agents' portfolios by around 50% in the wake of the COVID lockdowns. While there is still some way to go before stock levels return to the 10-year average, buyers can benefit from a growing choice of property for sale and be reassured that vendors now have less bargaining power than they did. Moreover, higher stock levels naturally put downward pressure on price growth which is vital for a resumption of more normal market conditions.
UK property is still very attractively priced in US dollar terms and yield-hungry international investors will be drawn to the extremely buoyant rental market. London will be of particular interest due to soaring rents and the opportunity for significant capital gains. The fact that the median price of a two-bedroom flat in London is currently 10% less than it was in 2015 indicates that there is considerable room for growth.
Key figures
| Measure | Figure |
|---|---|
| Monthly asking price change | -0.5% |
| Annual asking price change | 3.6% |
| Typical Time on Market | 70 days |
| Annual change in unsold stock | +39.3% |
| Increase in new instructions vs prior year | 6% |
| Home price rise since Feb 2020 | 16.2% |
| Monetary inflation (RPI ex. housing) | 14.3% |
| London rental growth | 26% |
Figures are for England and Wales unless the report states otherwise, as published in the edition.
Charts from the report
Source: Home.co.uk Asking Price Index, November 2022, Indexed to May 2004 (Value=100).
Source: Home.co.uk Asking Price Index, November 2022
Source: Home.co.uk Asking Price Index, November 2022
Source: Home.co.uk Asking Price Index, November 2022. Figures for October and November include our estimates of RPI (ex. housing) of 14% in each case.
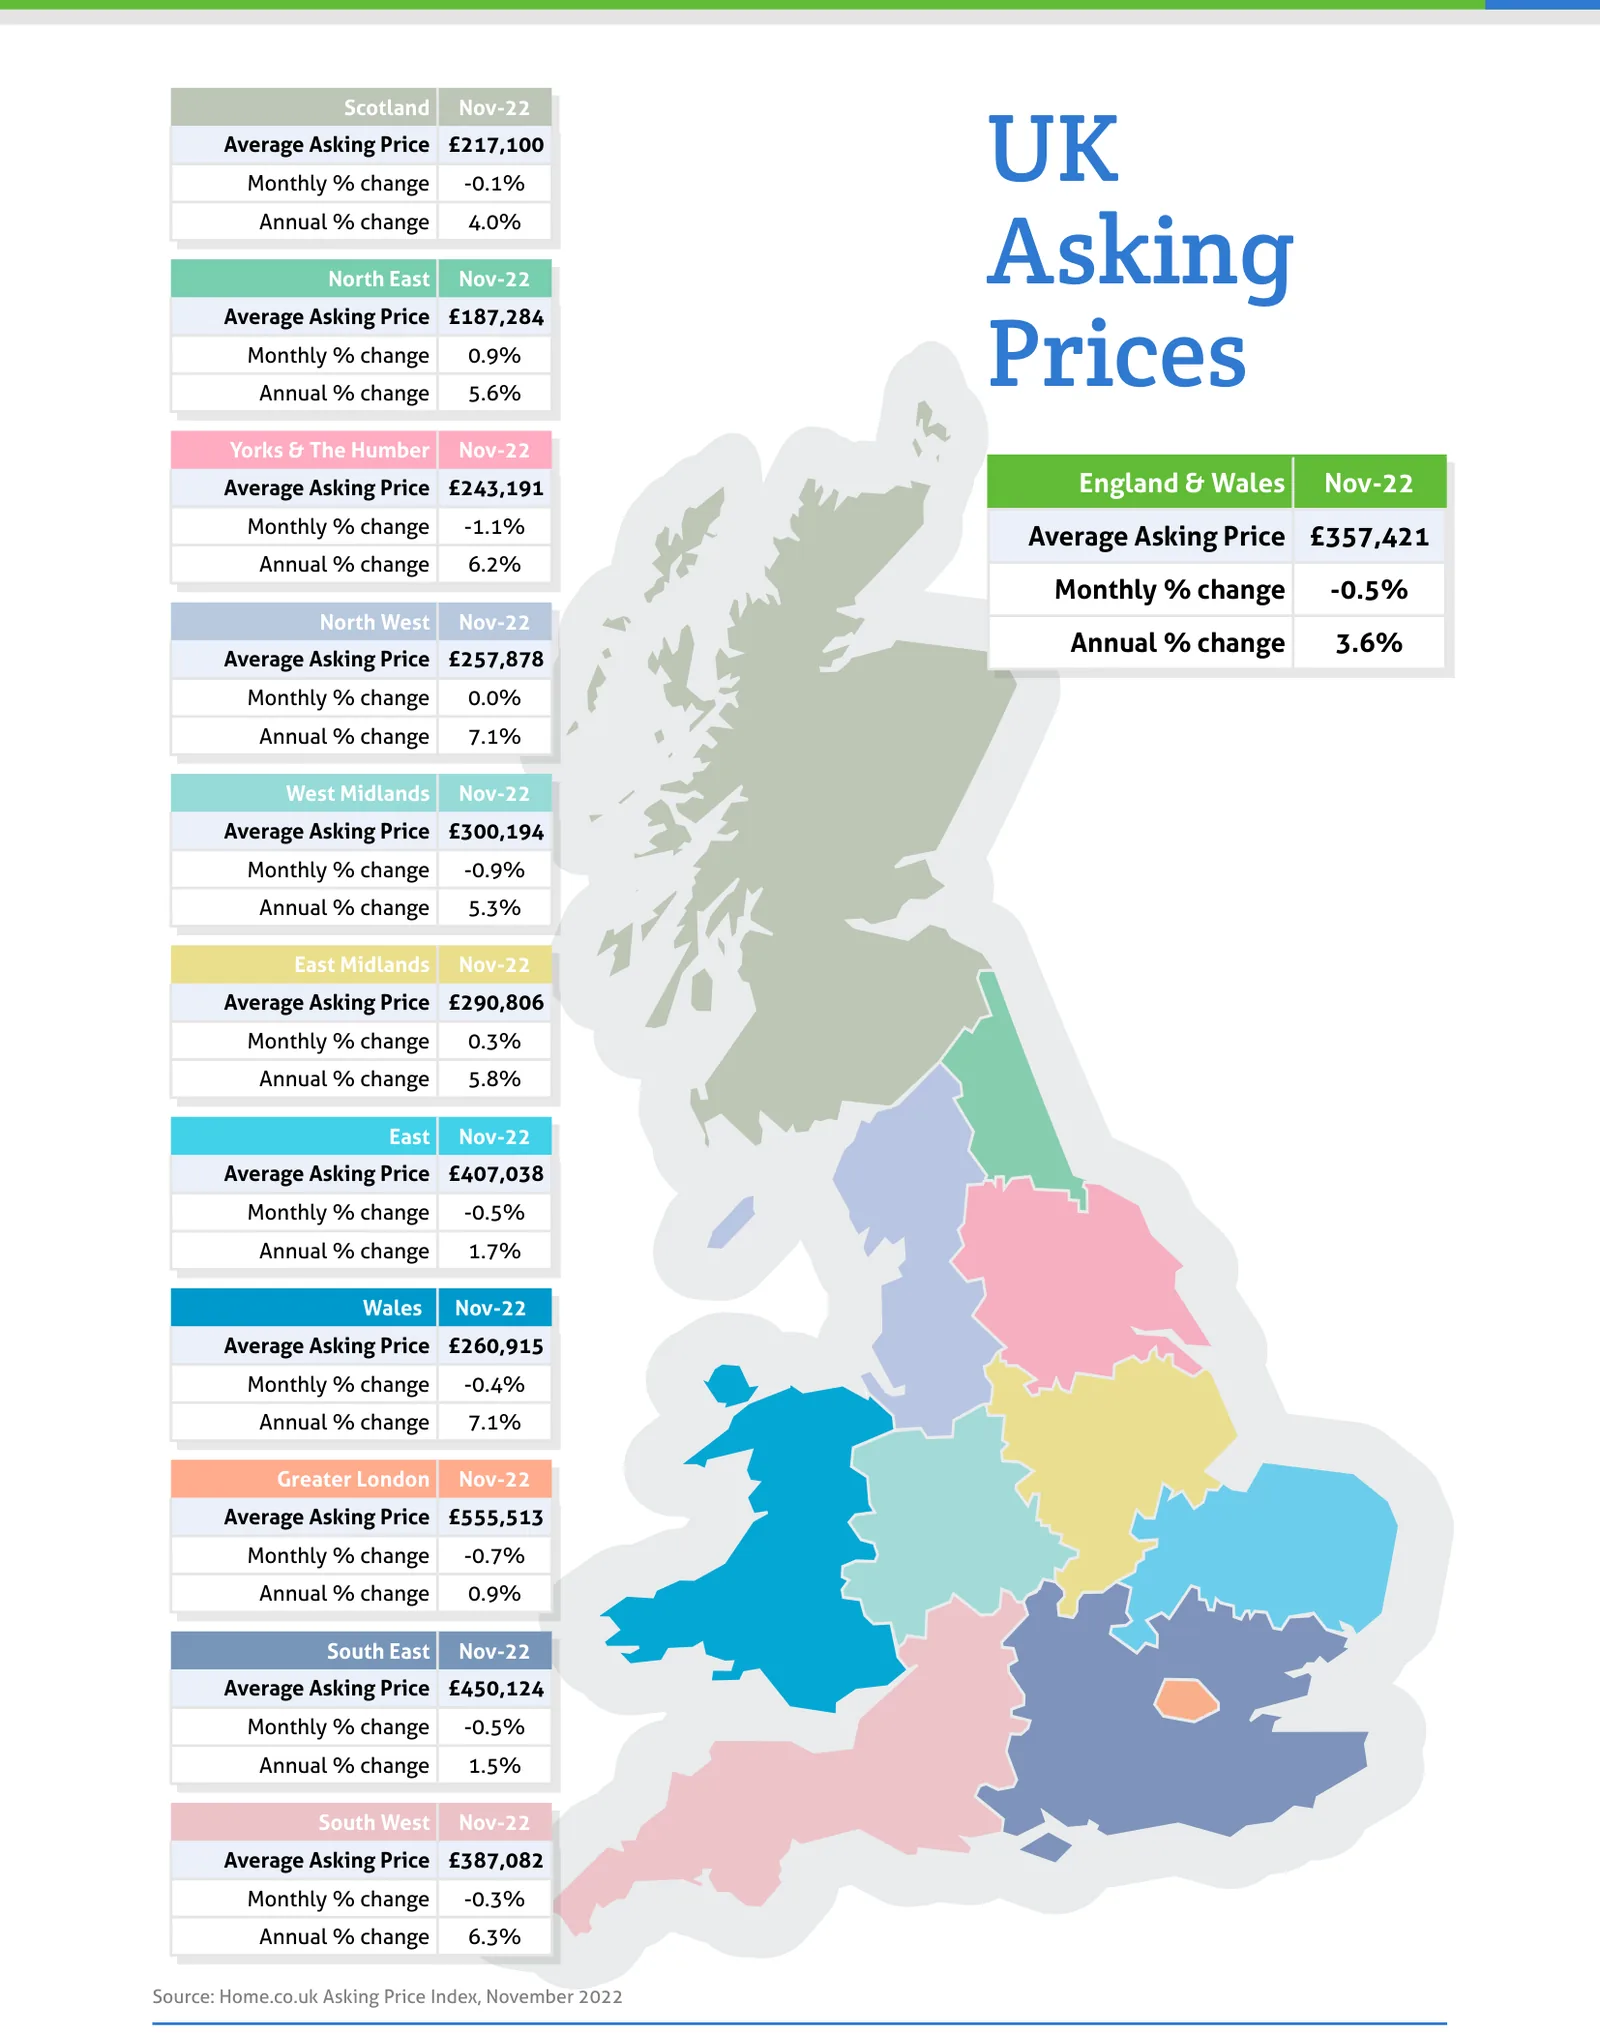
Source: Home.co.uk Asking Price Index, November 2022
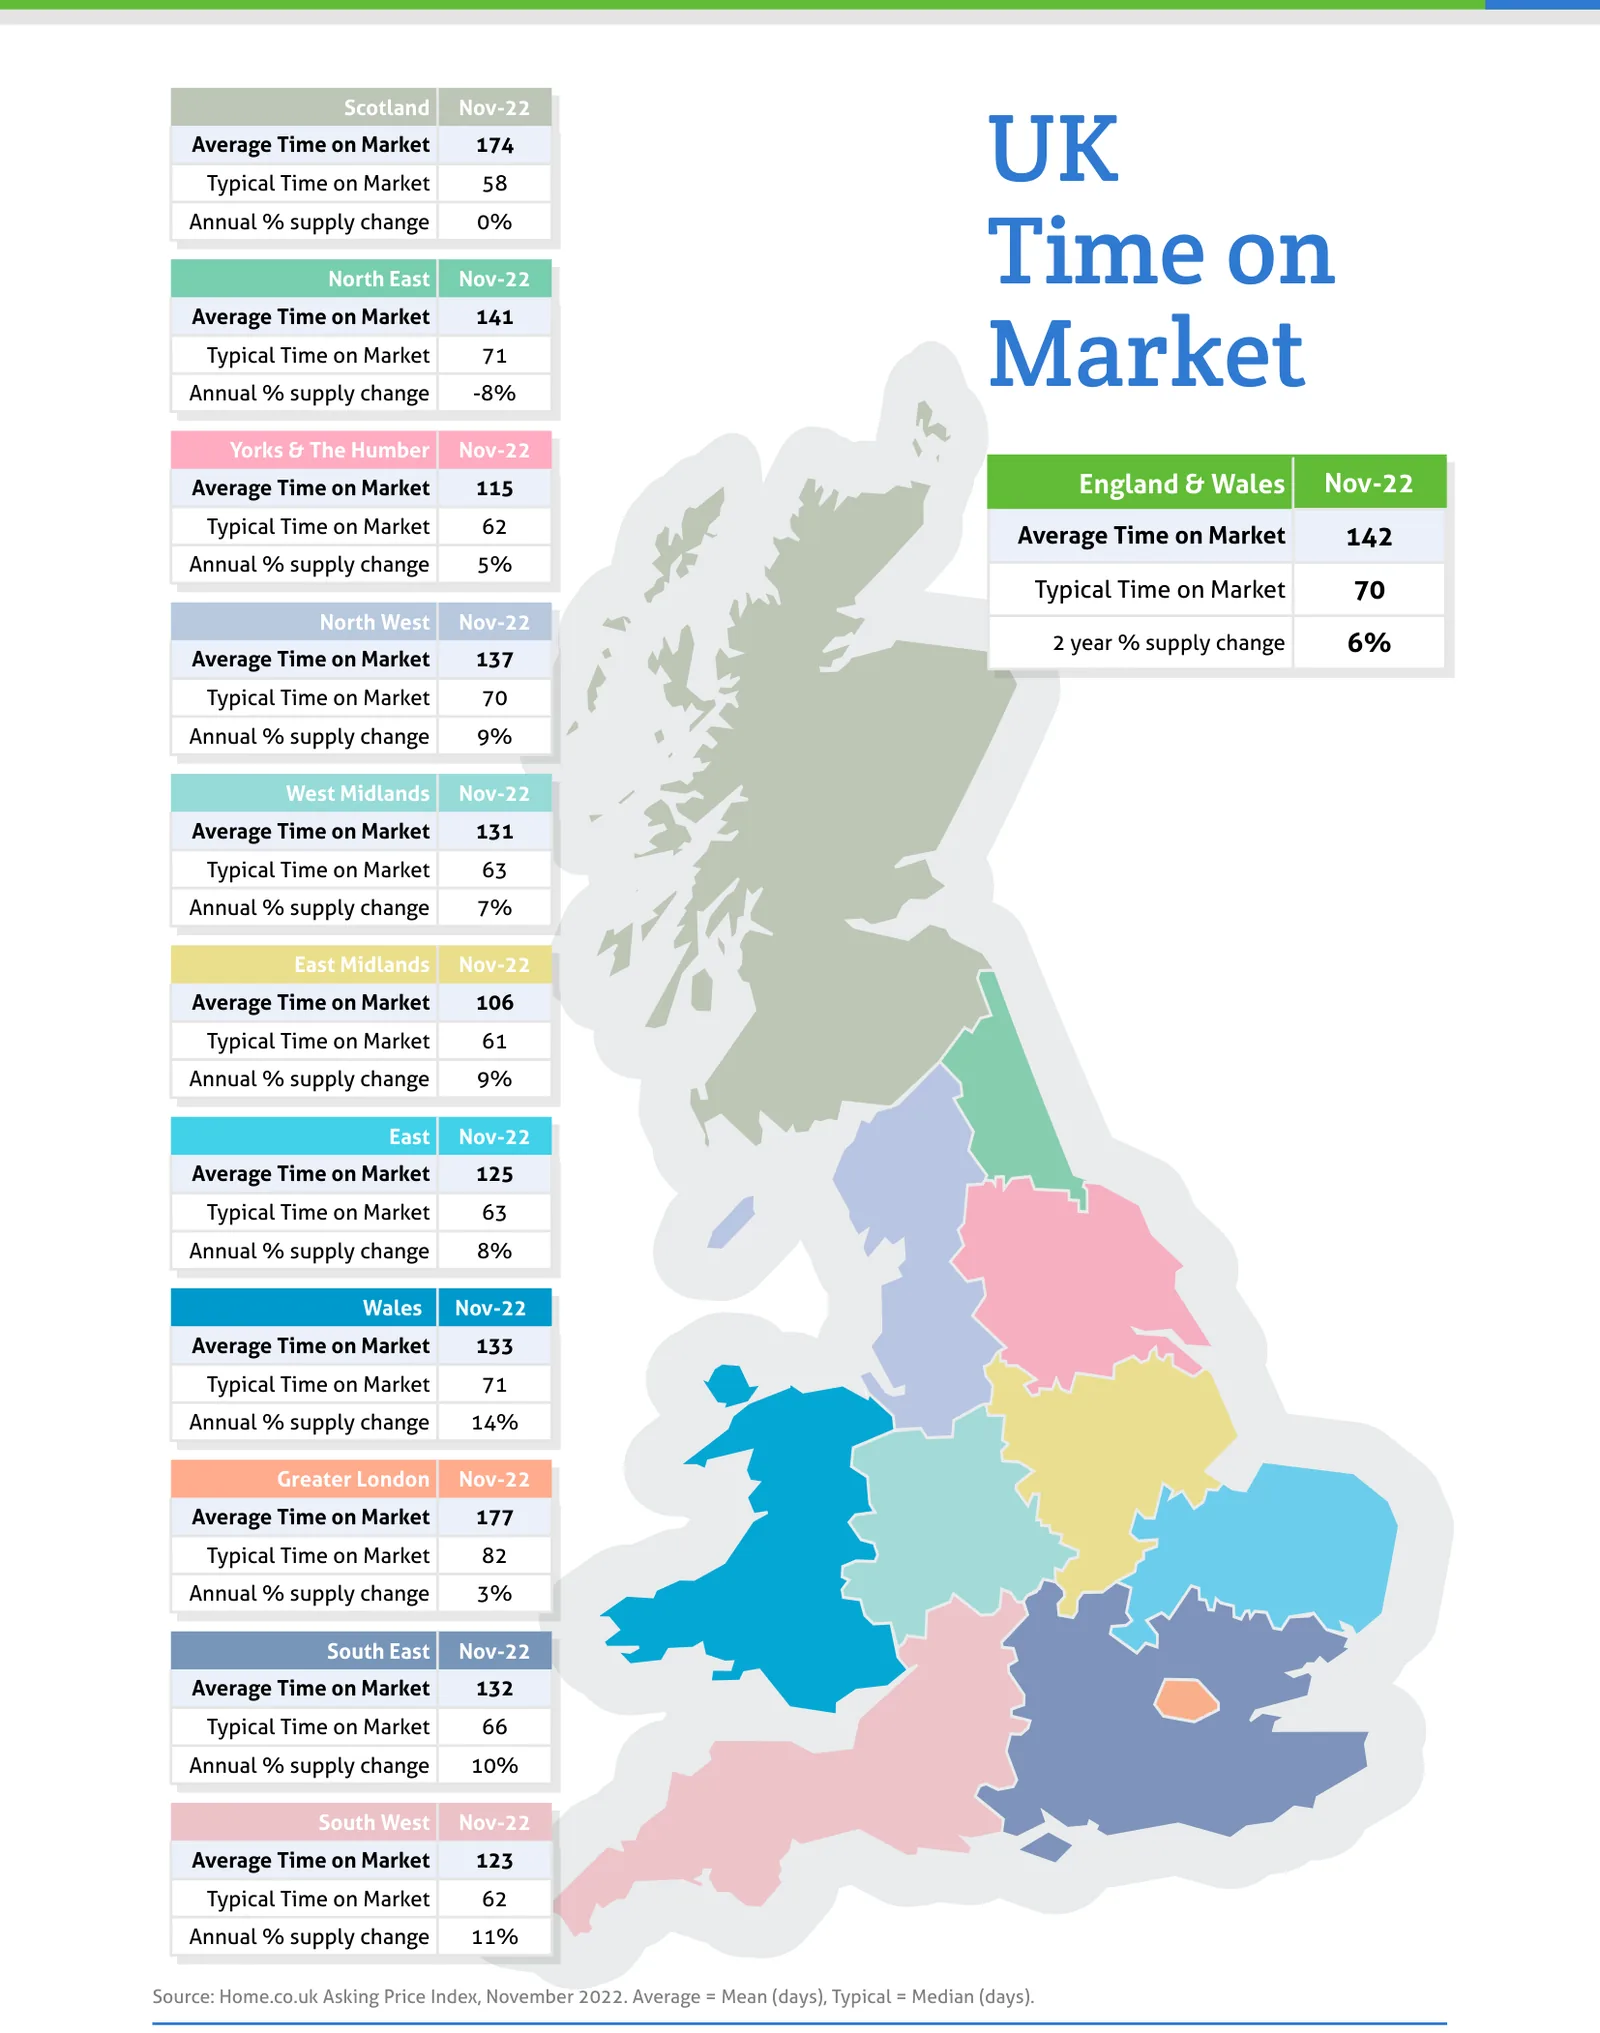
Source: Home.co.uk Asking Price Index, November 2022. Average = Mean (days), Typical = Median (days).
Regional tables
UK Asking Prices, Nov-22
| Region | Average Asking Price | Monthly % change | Annual % change |
|---|---|---|---|
| Scotland | £217,100 | -0.1% | 4.0% |
| North East | £187,284 | 0.9% | 5.6% |
| Yorks & The Humber | £243,191 | -1.1% | 6.2% |
| England & Wales | £357,421 | -0.5% | 3.6% |
| North West | £257,878 | 0.0% | 7.1% |
| West Midlands | £300,194 | -0.9% | 5.3% |
| East Midlands | £290,806 | 0.3% | 5.8% |
| East | £407,038 | -0.5% | 1.7% |
| Wales | £260,915 | -0.4% | 7.1% |
| Greater London | £555,513 | -0.7% | 0.9% |
| South East | £450,124 | -0.5% | 1.5% |
| South West | £387,082 | -0.3% | 6.3% |
UK Time on Market, Nov-22
| Region | Average Time on Market | Typical Time on Market | Annual % supply change |
|---|---|---|---|
| Scotland | 174 | 58 | 0% |
| North East | 141 | 71 | -8% |
| Yorks & The Humber | 115 | 62 | 5% |
| England & Wales | 142 | 70 | |
| North West | 137 | 70 | 9% |
| West Midlands | 131 | 63 | 7% |
| East Midlands | 106 | 61 | 9% |
| East | 125 | 63 | 8% |
| Wales | 133 | 71 | 14% |
| Greater London | 177 | 82 | 3% |
| South East | 132 | 66 | 10% |
| South West | 123 | 62 | 11% |
The report also prints '2 year % supply change' in 1 of its 12 region boxes (England & Wales 6%), so it is not a column of this table.
From the director's commentary
"Now the geniuses at the BoE want to sell off their £837 billion quantitative easing stockpile (and their recent purchase of nearly £20 billion of gilts due to the so-called mini-budget fiasco). However, surprise, surprise, there's not much demand."
Doug Shephard, Director at Home.co.uk
Read the full November 2022 edition (PDF, 11 pages)
About the Home Asking Price Index
The Home Asking Price Index measures the change in the prices sellers ask for residential property across England, Wales and Scotland. Today it is computed every month from around half a million advertised homes and is mix-adjusted, so a change in what happens to be on the market does not move the figure; earlier editions state the sample they were built from. Because an asking price is set months before a sale completes, the index runs around five months ahead of completed-sale measures such as the UK House Price Index.
Every edition in the archive, back to October 2006, is listed on the index page. How we measure the UK property market explains the listing data behind it, and today's figures by area are on house prices and rental prices.
Text and figures above are quoted from the November 2022 edition as published, with punctuation normalised for the web, and are not revised. Later editions may restate them.
More in What is happening to house prices: the Home guide
Thinking about your next move?
See what your home's worth in seconds, with the UK's longest-running property data behind it.
Get an instant valuation