

























Home Asking Price Index, November 2020: prices rise in market frenzy but Central London's woes worsen
Asking prices for England and Wales rose 0.6% in October, taking annual growth to 4.5%, while unsold stock fell by around 15,000 since last month.

This is the November 2020 edition of the Home Asking Price Index, released on 12 November 2020, under the headline:
Prices Rise in Market Frenzy but Central London's Woes Worsen
The headlines and summary below are the report's own words, with the key figures as it published them, followed by the report's charts and regional tables as printed.
Headlines
- Asking prices strengthen as buyer demand eats into stock levels. Correspondingly, the current unsold property count for England and Wales has fallen by around 15,000 since last month to 427,980.
- The mix-adjusted average asking price for England and Wales posts a 0.6% rise since the October reading while the year-on-year change rises to 4.5%.
- The post-lockdown supply surge of new sales instructions seen across the UK appears to be waning in all regions except London.
- Excessive supply in Greater London persists, further risking a severe market correction (new listings up 86% in October compared to October 2019) as unsold stock levels continue to grow (up 58% since May this year).
- The northern property markets are in much better shape, with Yorkshire showing the greatest year-on-year price growth of 9.0%, closely followed by the North West with an annualised gain of 8.9%.
- Prices also rose significantly in the South East (+1.3%) and North West (+1.3%) since last month.
- Scottish prices are the only regional faller this month, as vendors moderated their expectations since last month's massive hike of 1.8%, shaving 0.9% off the average price.
- The market continues to show exceptional momentum with the Typical Time on Market at a mere 75 days for unsold property, 26 days less than in November 2019.
- Overall supply in the UK rental sector is 7.0% down year-on-year. However, more severe shortages, driving up rents, are to be found in most English regions and in Wales. Meanwhile, the Greater London area shows vast and worsening oversupply in properties available to rent (+68% year-on-year) and this is having negative consequences for the sales market.
Summary
The 13-year record level of mortgages approved during September, according to the Bank of England, kept pace with supply in most parts of the UK but not where oversupply is greatest. London's sales stock levels have been inflated by 58% since May and, owing to a further record number of new listings in October (also a 13-year record total), the capital's woes look set to worsen. Moreover, concomitant oversupply in the London rental market (which has led to rapidly falling rents) may have created the conditions for the perfect storm.
The annualised mix-adjusted average price growth across England and Wales is currently +4.5%; in November 2019, the annualised rate of increase of home prices was 0.0%.
Key figures
| Measure | Figure |
|---|---|
| Unsold stock decrease (England & Wales) | 15,000 |
| Monthly change in asking price | +0.6% |
| Annual change in asking price | +4.5% |
| Typical Time on Market | 75 days |
| Typical Time on Market change (vs November 2019) | 26 days |
| UK rental sector supply change (year-on-year) | -7.0% |
Figures are for England and Wales unless the report states otherwise, as published in the edition.
Charts from the report
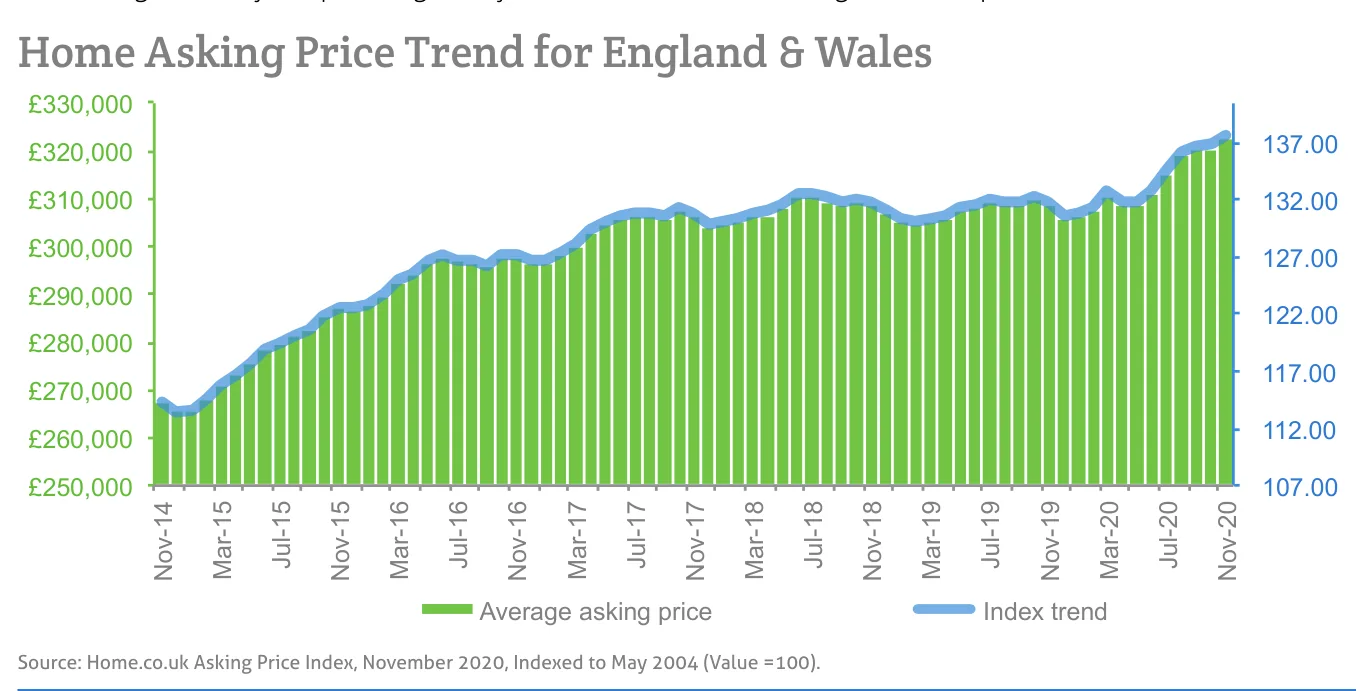
Source: Home.co.uk Asking Price Index, November 2020, Indexed to May 2004 (Value =100).
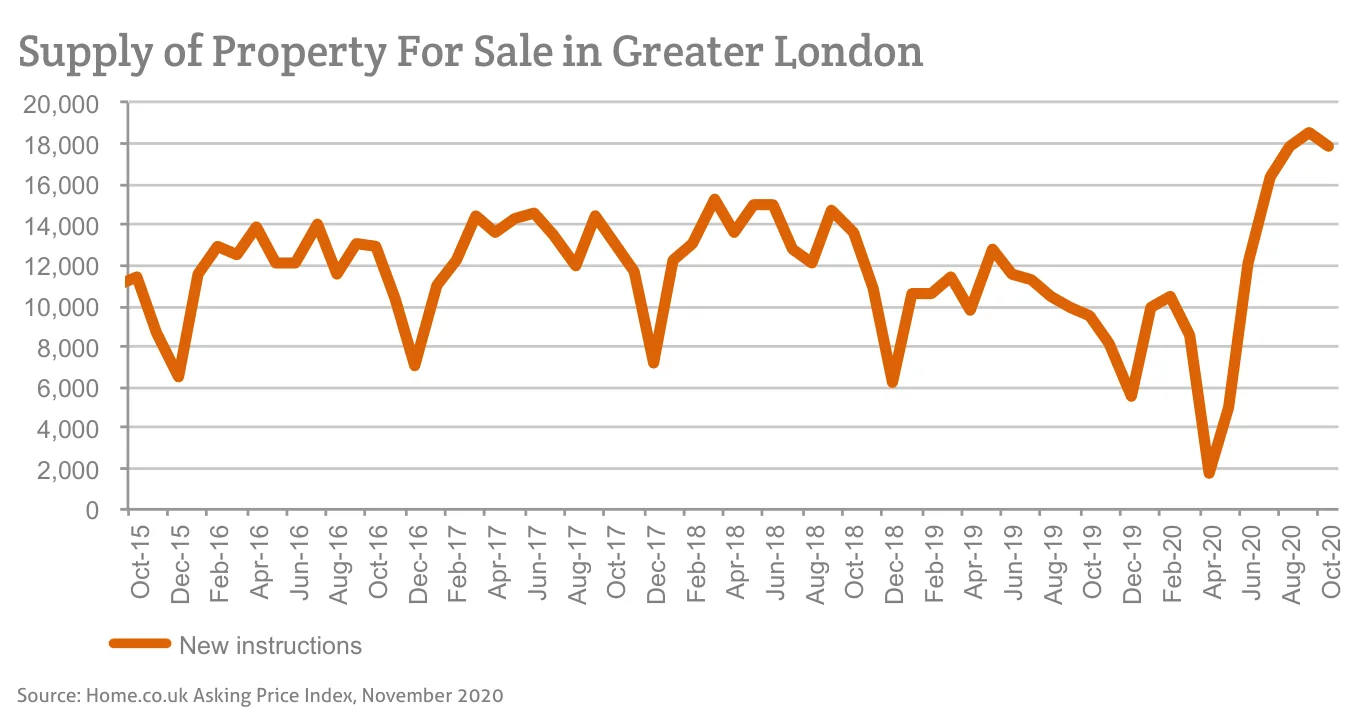
Source: Home.co.uk Asking Price Index, November 2020
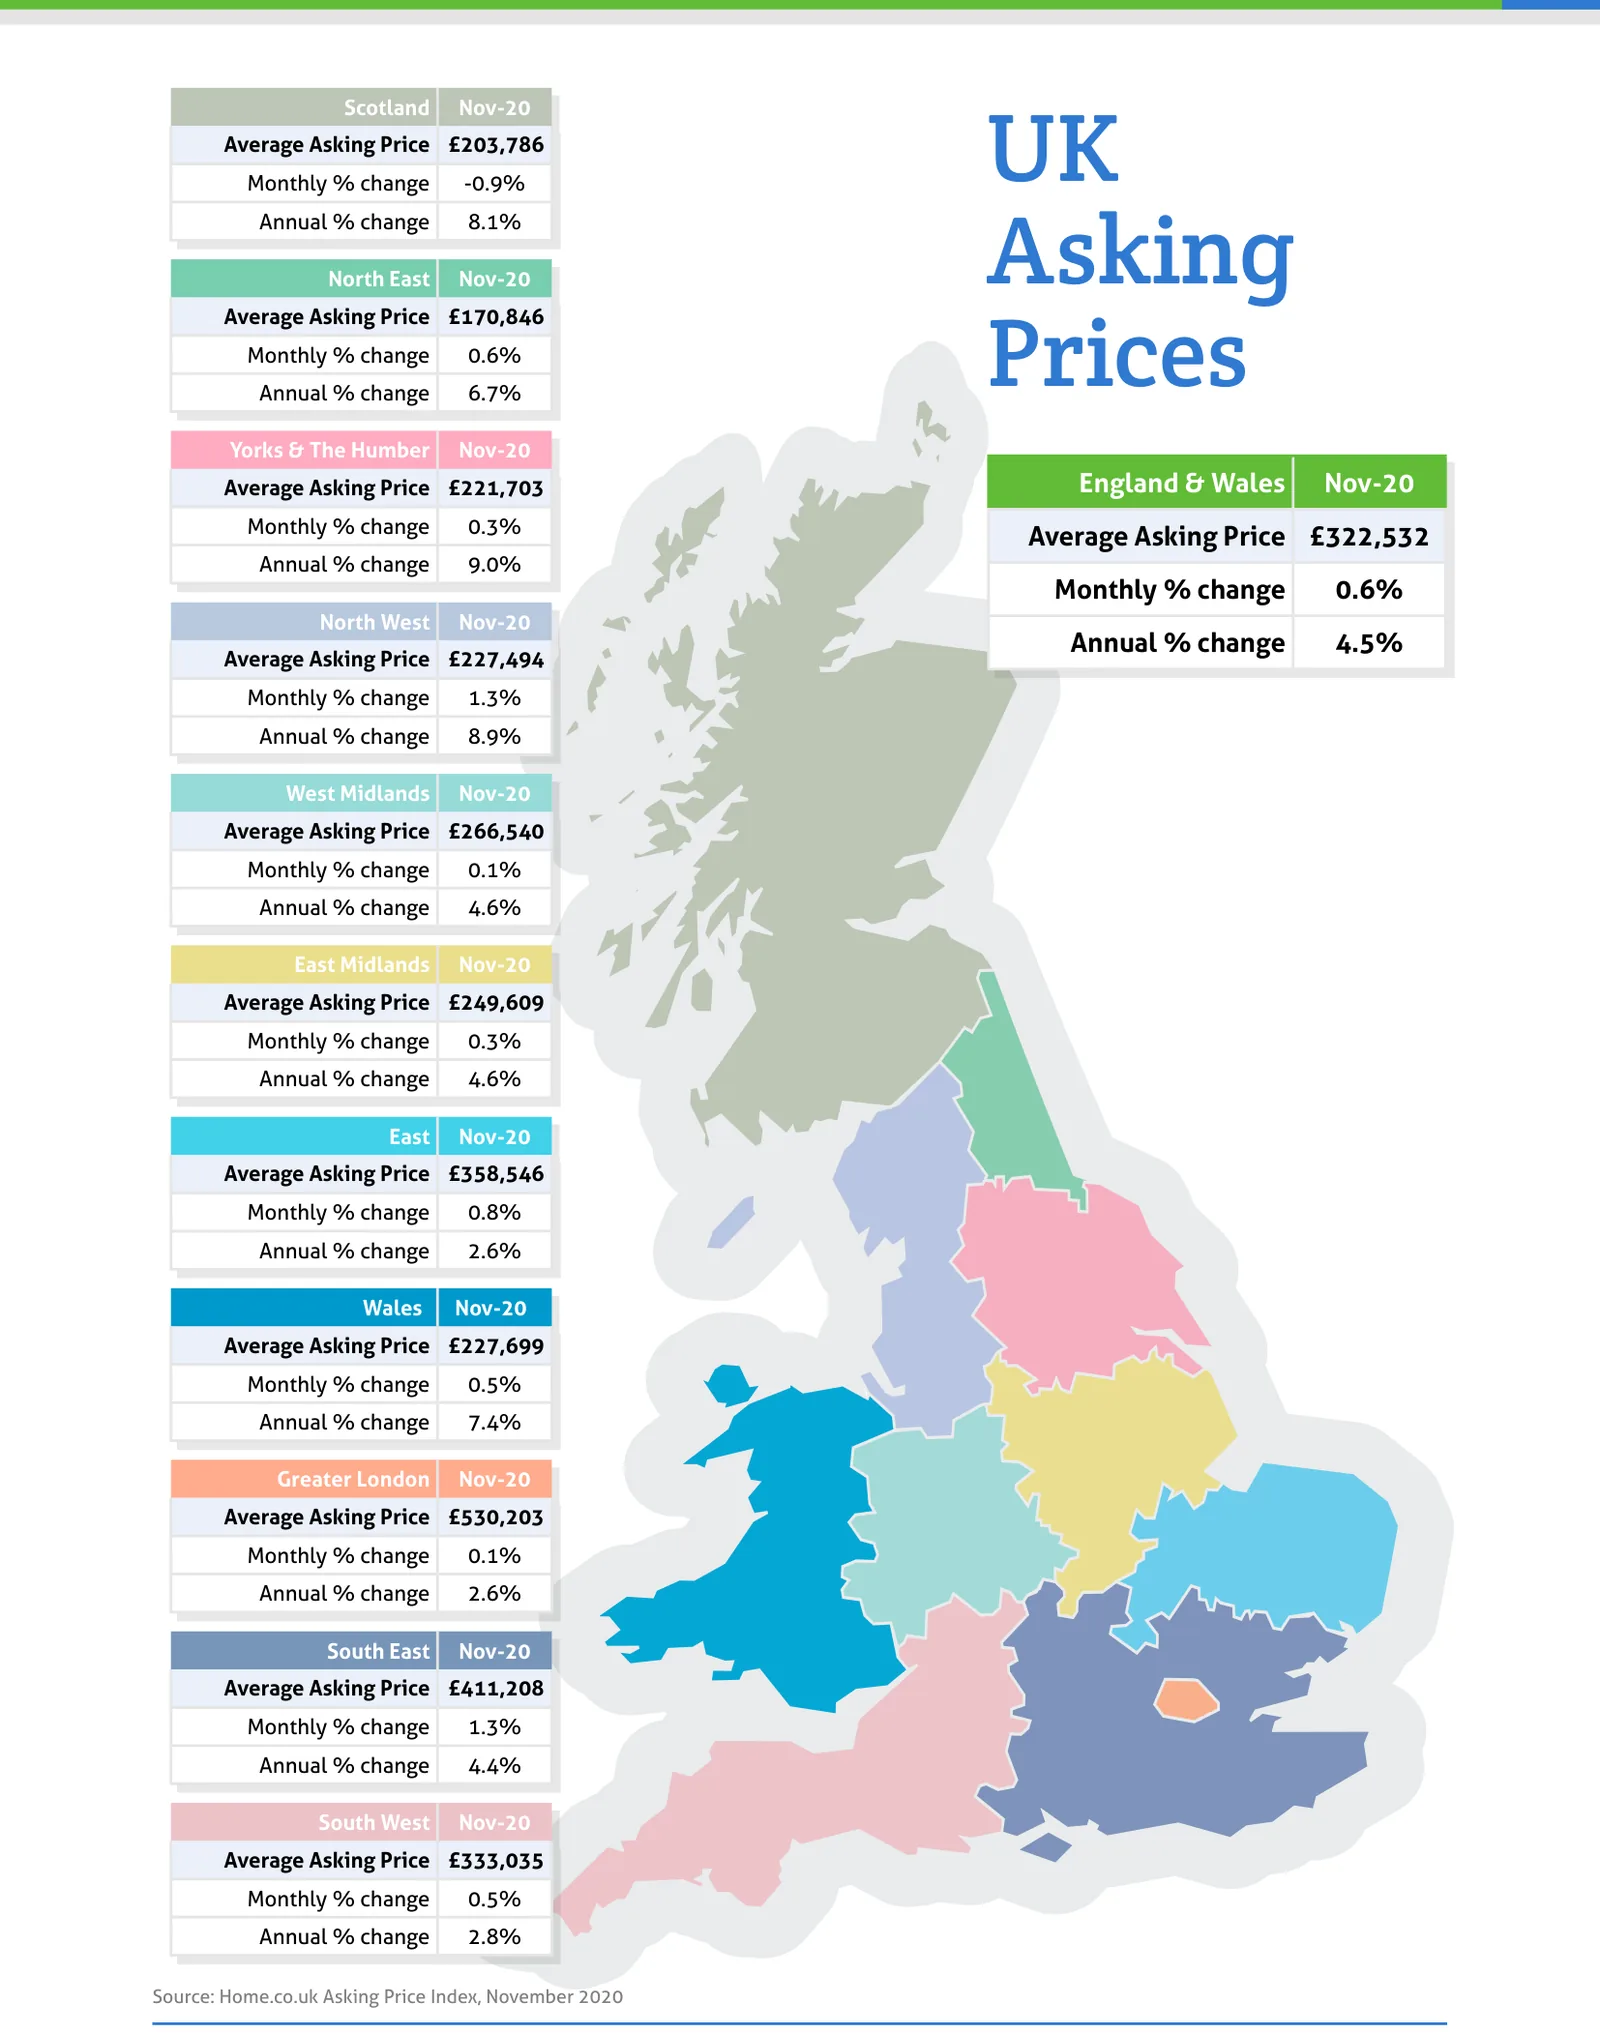
Source: Home.co.uk Asking Price Index, November 2020
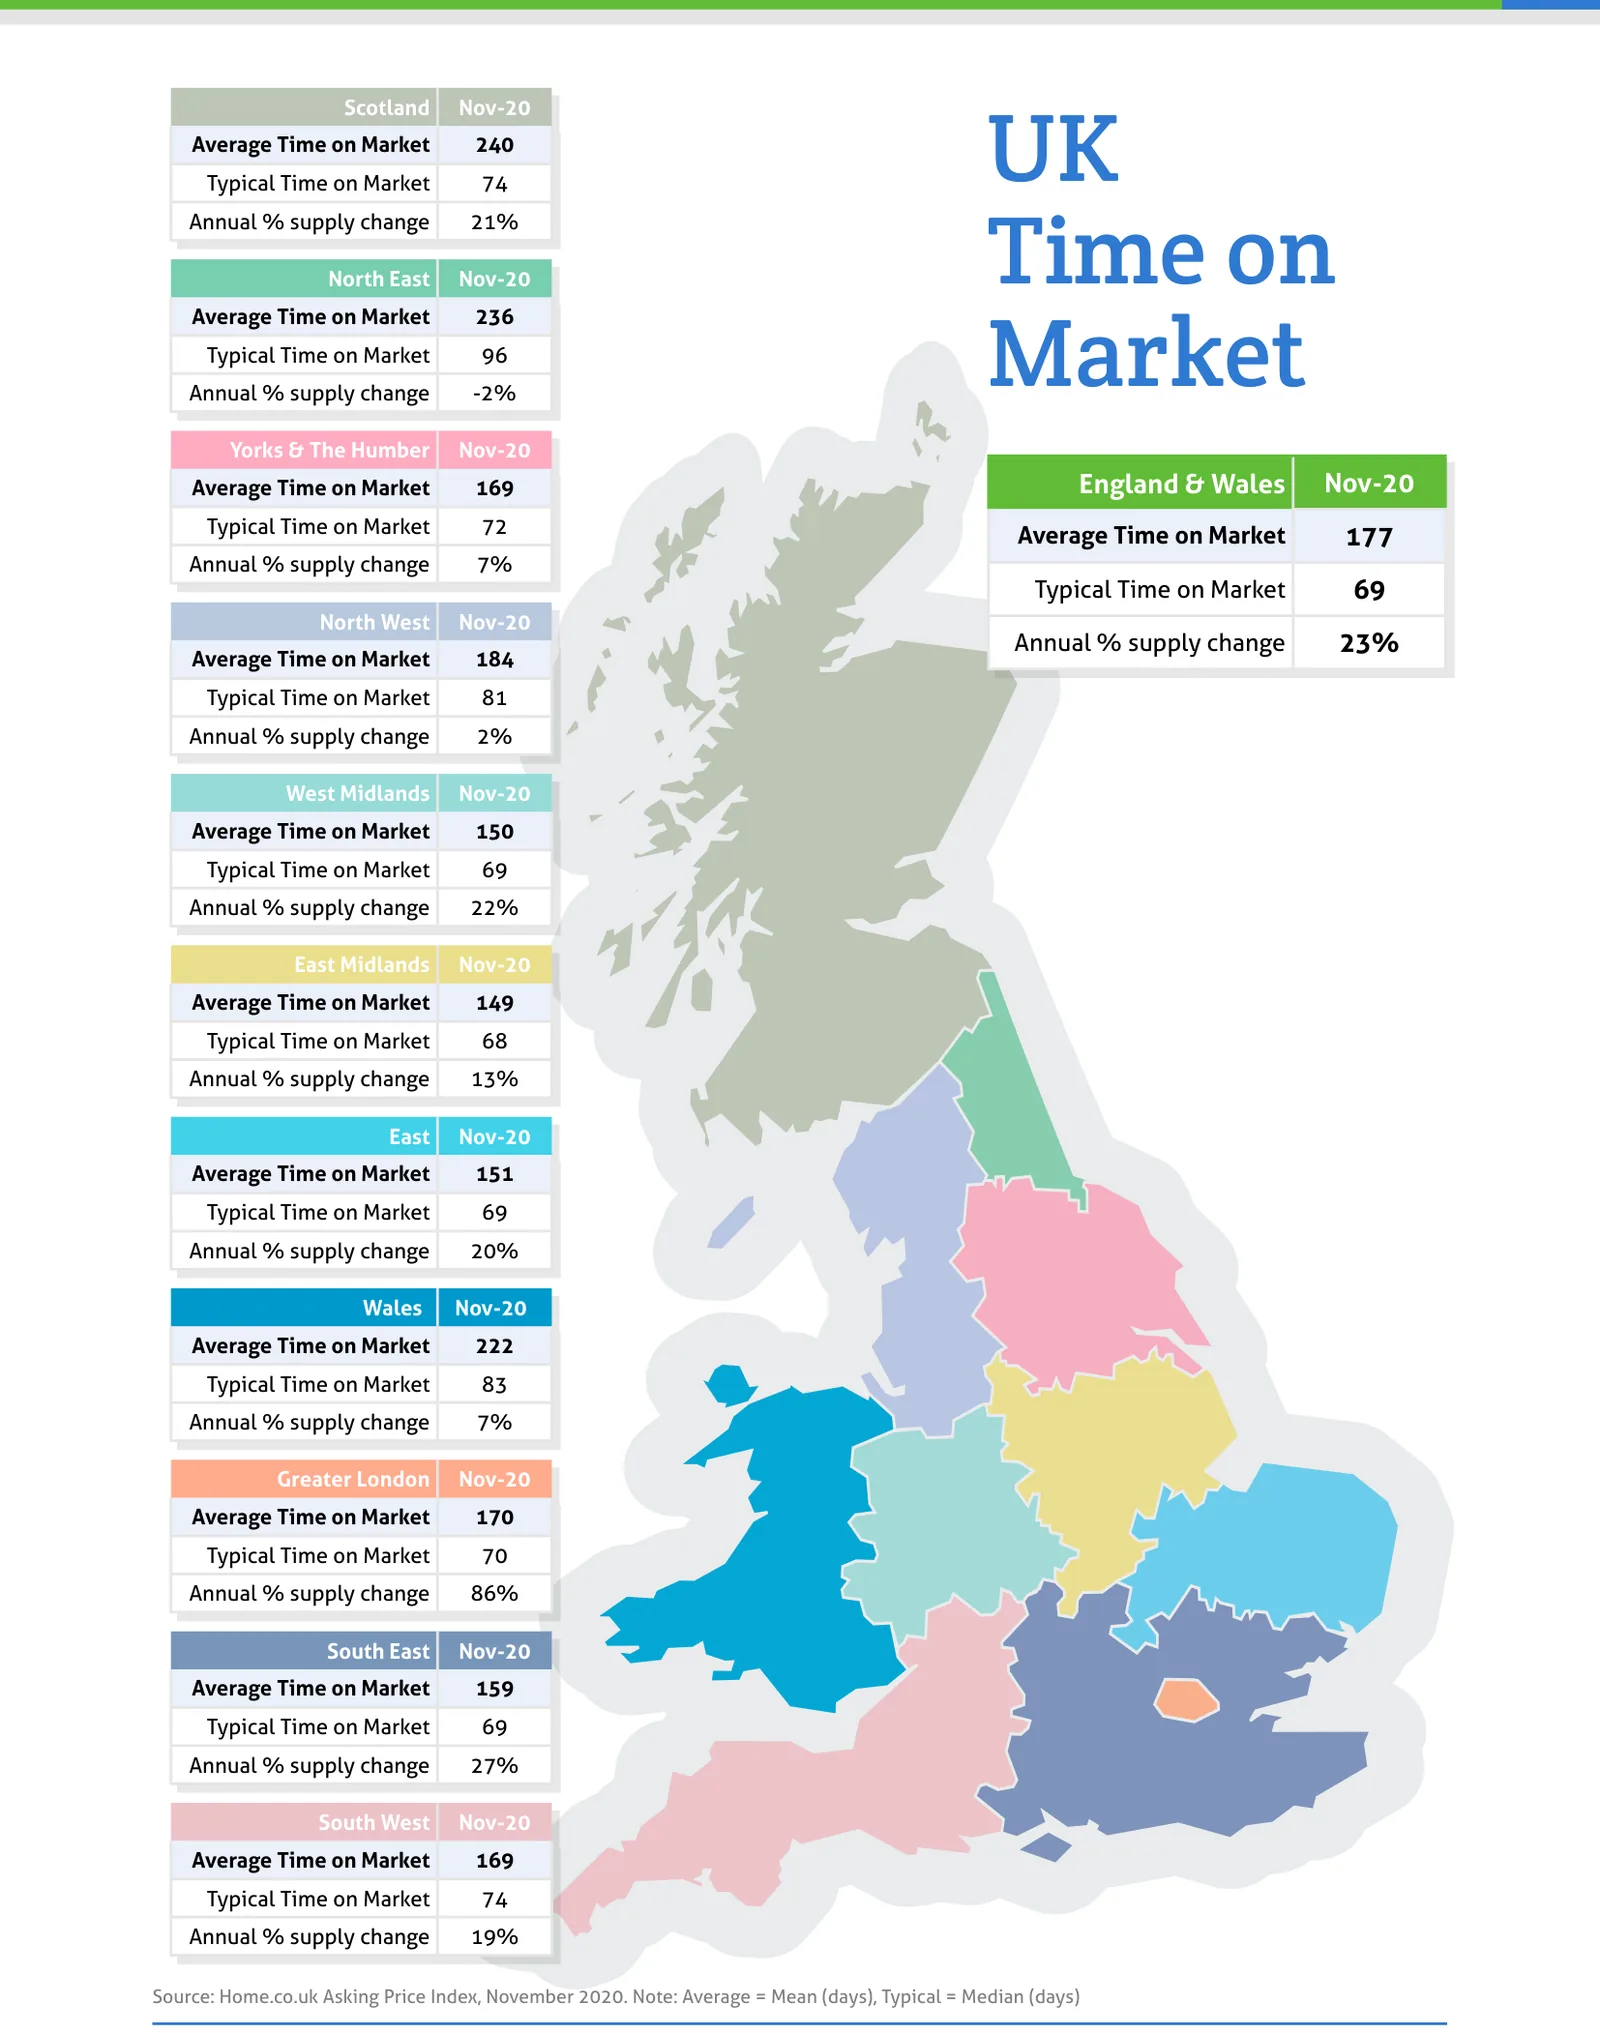
Source: Home.co.uk Asking Price Index, November 2020. Note: Average = Mean (days), Typical = Median (days)
Regional tables
UK Asking Prices, Nov-20
| Region | Average Asking Price | Monthly % change | Annual % change |
|---|---|---|---|
| Scotland | £203,786 | -0.9% | 8.1% |
| North East | £170,846 | 0.6% | 6.7% |
| Yorks & The Humber | £221,703 | 0.3% | 9.0% |
| England & Wales | £322,532 | 0.6% | 4.5% |
| North West | £227,494 | 1.3% | 8.9% |
| West Midlands | £266,540 | 0.1% | 4.6% |
| East Midlands | £249,609 | 0.3% | 4.6% |
| East | £358,546 | 0.8% | 2.6% |
| Wales | £227,699 | 0.5% | 7.4% |
| Greater London | £530,203 | 0.1% | 2.6% |
| South East | £411,208 | 1.3% | 4.4% |
| South West | £333,035 | 0.5% | 2.8% |
UK Time on Market, Nov-20
| Region | Average Time on Market | Typical Time on Market | Annual % supply change |
|---|---|---|---|
| Scotland | 240 | 74 | 21% |
| North East | 236 | 96 | -2% |
| Yorks & The Humber | 169 | 72 | 7% |
| England & Wales | 177 | 69 | 23% |
| North West | 184 | 81 | 2% |
| West Midlands | 150 | 69 | 22% |
| East Midlands | 149 | 68 | 13% |
| East | 151 | 69 | 20% |
| Wales | 222 | 83 | 7% |
| Greater London | 170 | 70 | 86% |
| South East | 159 | 69 | 27% |
| South West | 169 | 74 | 19% |
From the director's commentary
"Historically, property has always been one of the go-to investments in times of economic and political uncertainty. To call the current price growth a mini boom is speculative to say the least."
Doug Shephard, Director at Home.co.uk
Read the full November 2020 edition (PDF, 7 pages)
About the Home Asking Price Index
The Home Asking Price Index measures the change in the prices sellers ask for residential property across England, Wales and Scotland. Today it is computed every month from around half a million advertised homes and is mix-adjusted, so a change in what happens to be on the market does not move the figure; earlier editions state the sample they were built from. Because an asking price is set months before a sale completes, the index runs around five months ahead of completed-sale measures such as the UK House Price Index.
Every edition in the archive, back to October 2006, is listed on the index page. How we measure the UK property market explains the listing data behind it, and today's figures by area are on house prices and rental prices.
Text and figures above are quoted from the November 2020 edition as published, with punctuation normalised for the web, and are not revised. Later editions may restate them.
More in What is happening to house prices: the Home guide
Thinking about your next move?
See what your home's worth in seconds, with the UK's longest-running property data behind it.
Get an instant valuation