

























Home Asking Price Index, November 2012: home prices buck seasonal trend
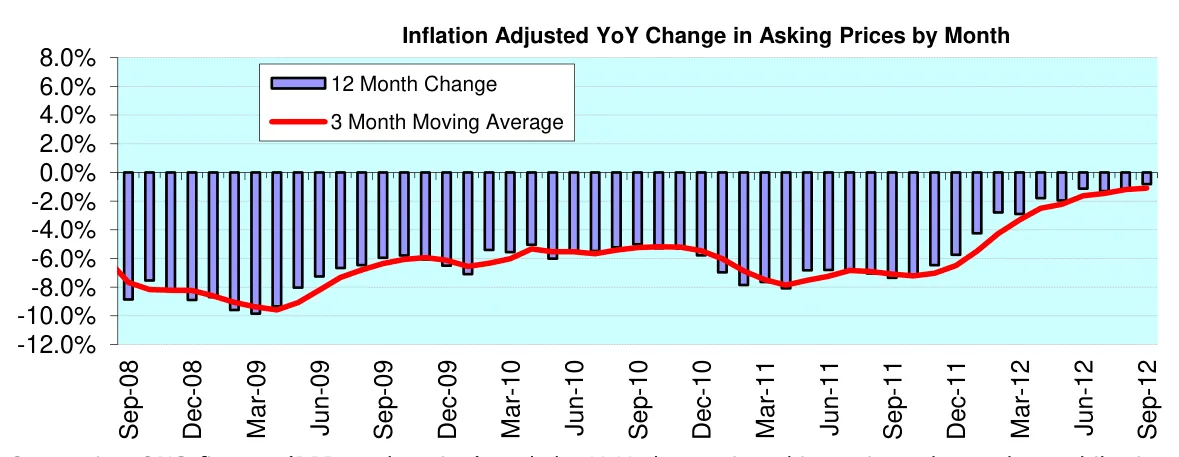
Asking prices in England and Wales rose 0.2% in November, lifting the annual increase to 2.5%, the best performance since March 2008.

This is the November 2012 edition of the Home Asking Price Index, released on 12 November 2012, under the headline:
Home Prices Buck Seasonal Trend
The headlines and summary below are the report's own words, with the key figures as it published them, followed by the report's charts and regional tables as printed.
Headlines
- Asking prices up: 0.2% since October, taking the annual rise to 2.5%: the best year-on-year price performance figure since March 2008.
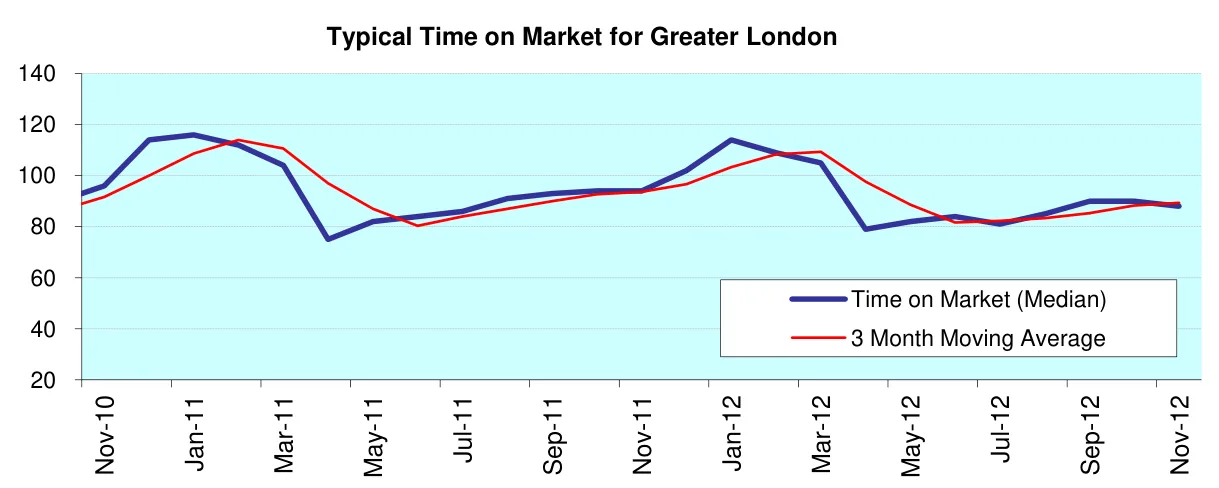
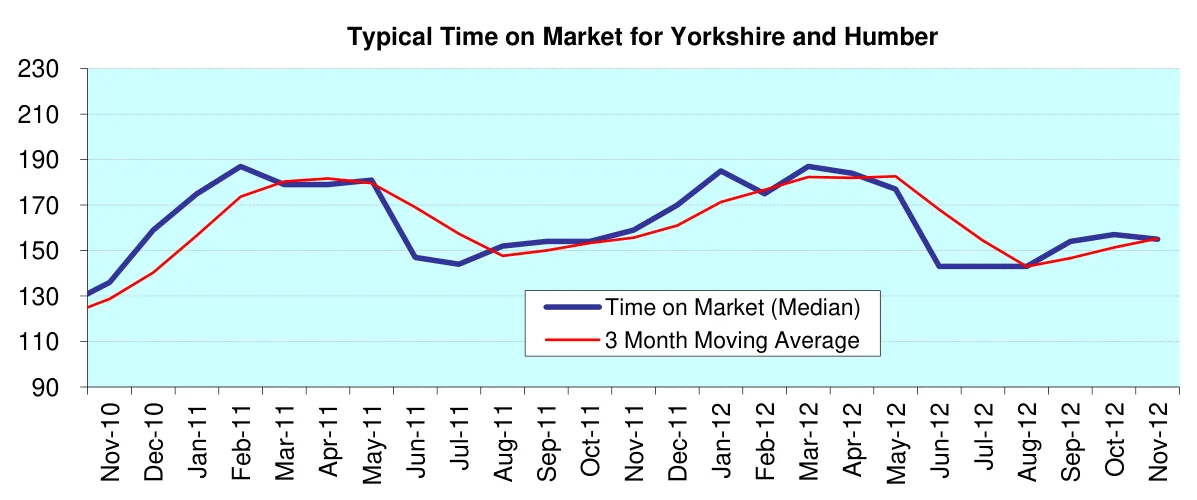
- Demand up: Typical Time on Market 4 days lower than in November 2011.
- Supply down again in October: 3.3% fewer properties enter the sales market year-on-year.
- Asking prices rose in 6 of the 9 English regions and Wales over the last month.
- Time on Market (average) remains unchanged since September at 215 days, 2 days longer than in October 2011.
- Annual change in UK home prices: +2.5%
- 6-month change: +1.1%
Summary
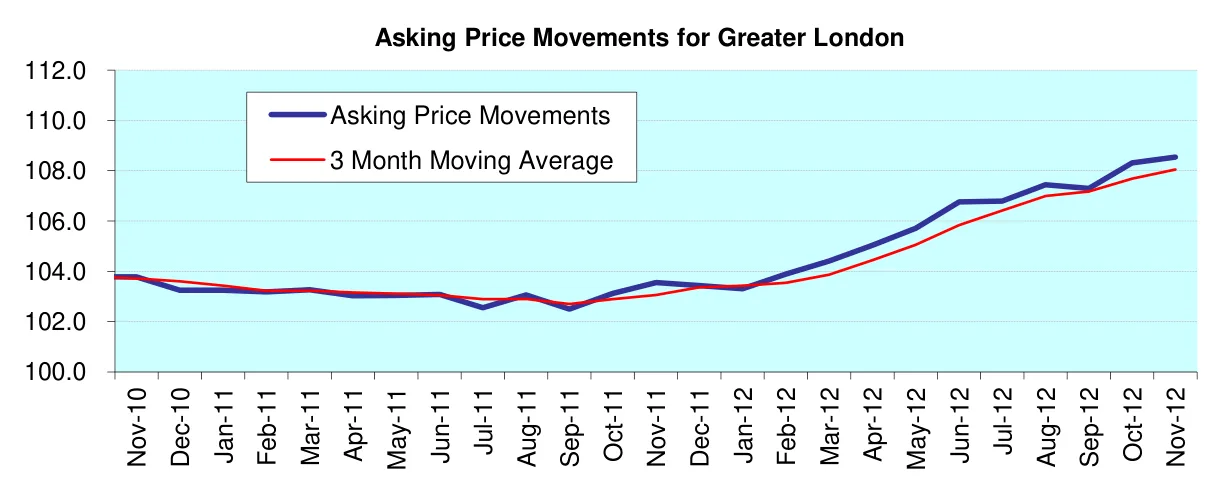
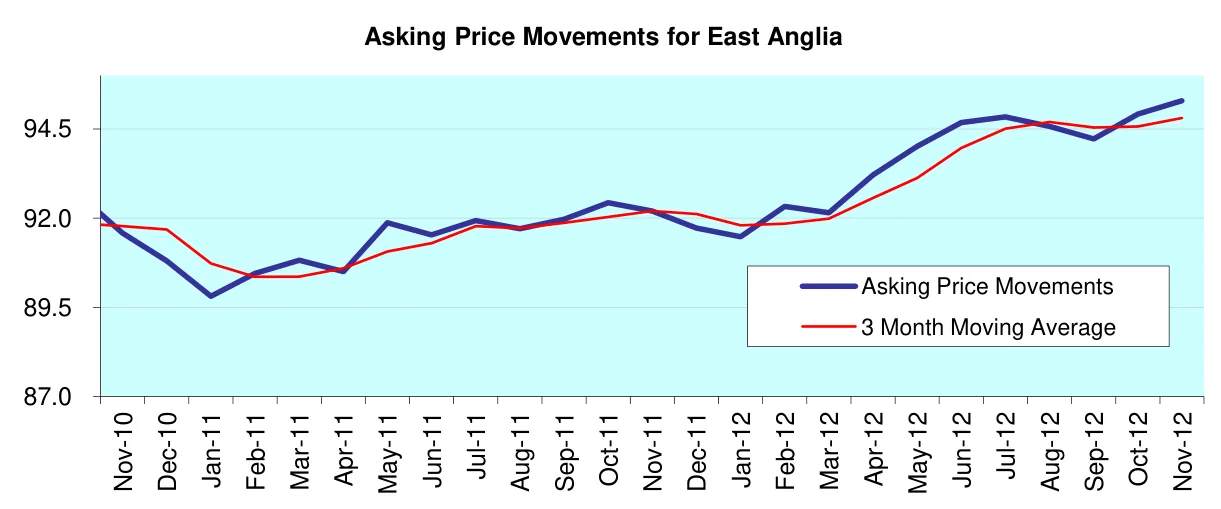
The UK property market is enjoying a burst of optimism and price growth. Unseasonal price rises coupled with falling time on market indicators for many regions show that buyers are currently more active than they have been for some time. London, of course, leads the way with outstanding price gains and the lowest median time on market in the UK. Moreover, with East Anglia joining the top performing regions, Greater London and the South East where prices are rising ahead of inflation (vs. RPI ex. housing), it is tempting to suggest that UK property may have turned the corner...
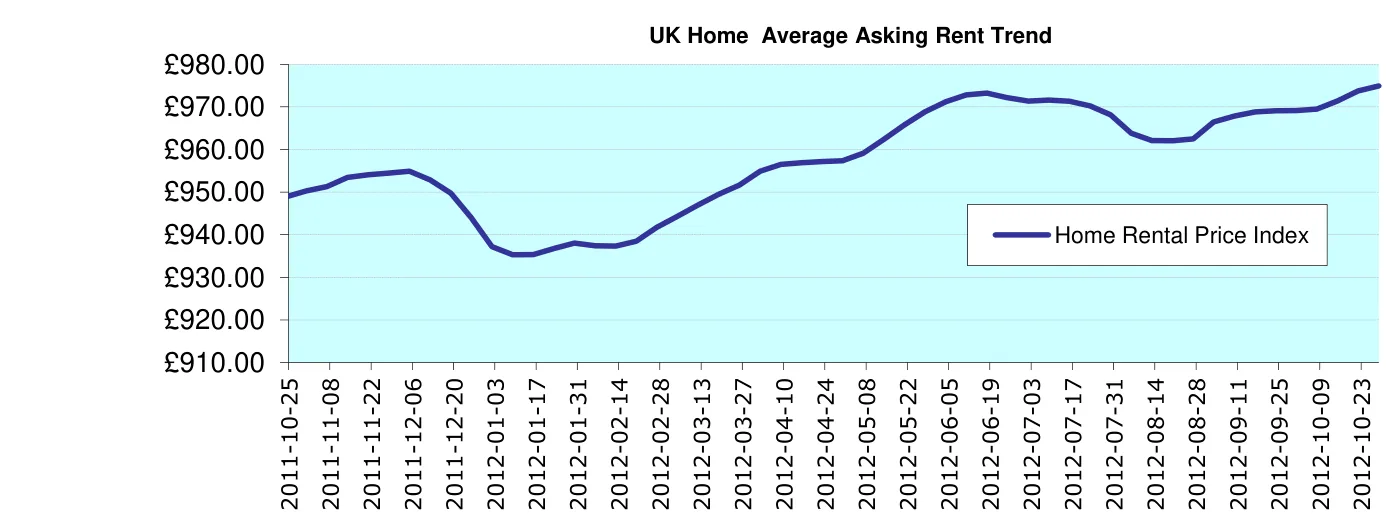
These top 3 performing regions may soon be joined by the South West although several other regions, especially those in the North, have a lot of catching up to do. The North West is still registering year-on-year falls (-0.8%) and Scotland and Yorkshire and Humber are only just into positive territory. However, with the tail wind of a flourishing rental market, which is helping to keep sales supply low, home prices may be expected to continue their overall upward trend over the coming months.
Key figures
| Measure | Figure |
|---|---|
| Average asking price (England & Wales) | £233,720 |
| Monthly change | +0.2% |
| Annual change | +2.5% |
| 6-month change | +1.1% |
| Typical Time on Market | 124 days |
| Average Time on Market (mean) | 215 days |
| Change in new supply | -3.3% |
| HAPI index (England & Wales) | 99.8 |
Figures are for England and Wales unless the report states otherwise, as published in the edition.
Charts from the report
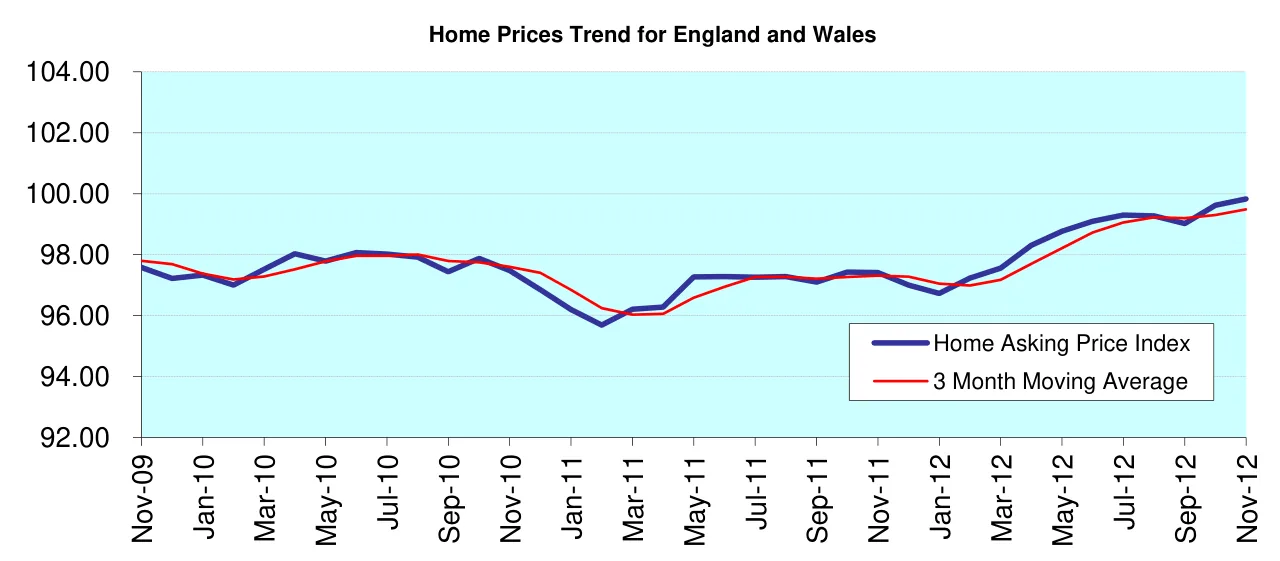
Laspeyres Index based on Weighted Arithmetic Mean of Weighted Arithmetic Mean of Regional House Prices. [May04 = 100]
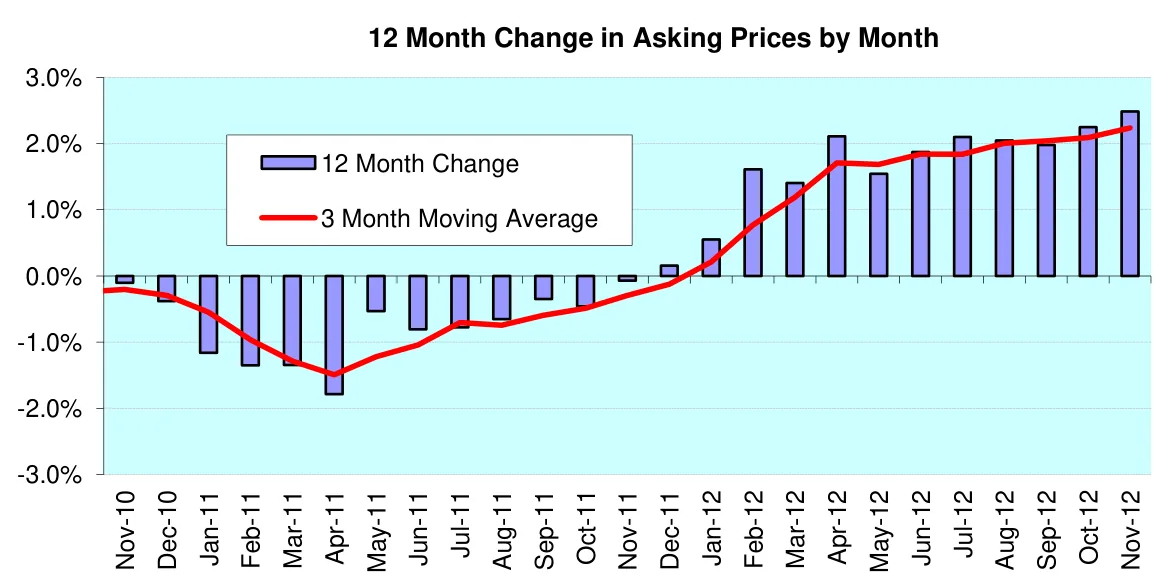
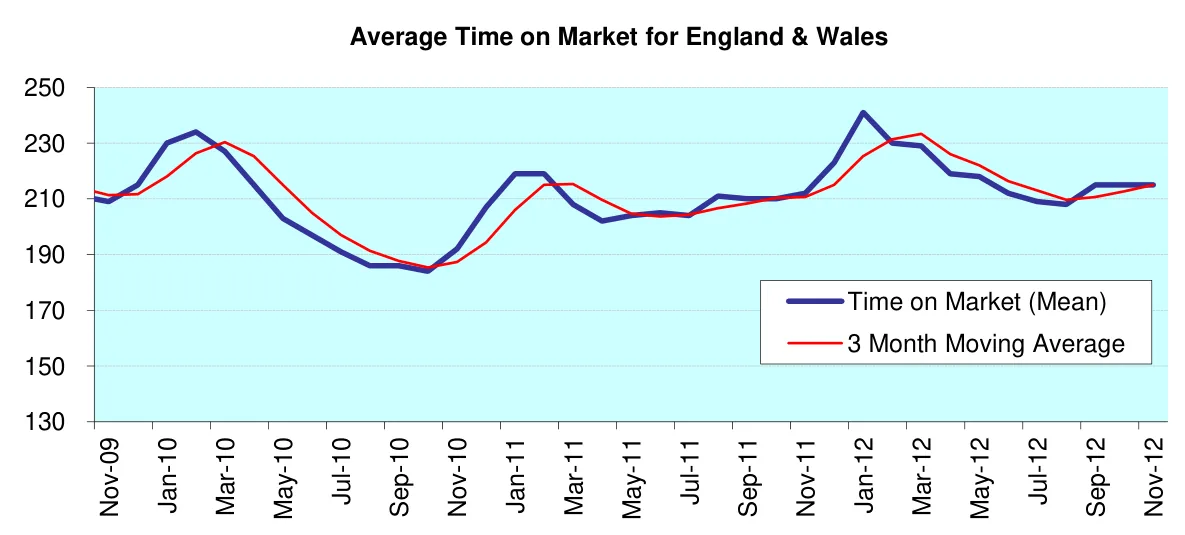
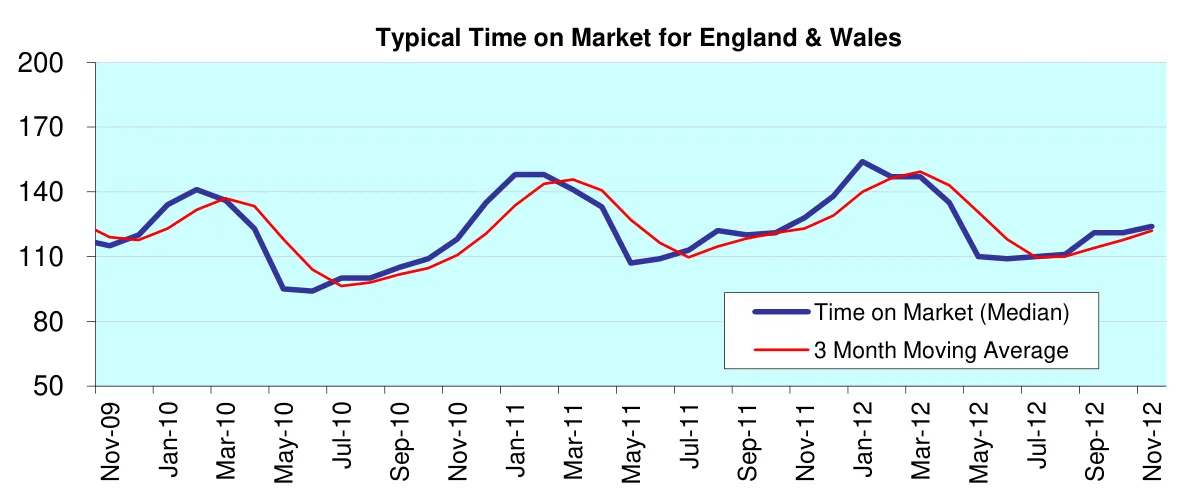
Laspeyres Indices based on Weighted Arithmetic Mean of Regional House Prices [May04 = 100]
Laspeyres Index based on Weighted Arithmetic Mean of Regional House Prices [May04 = 100]
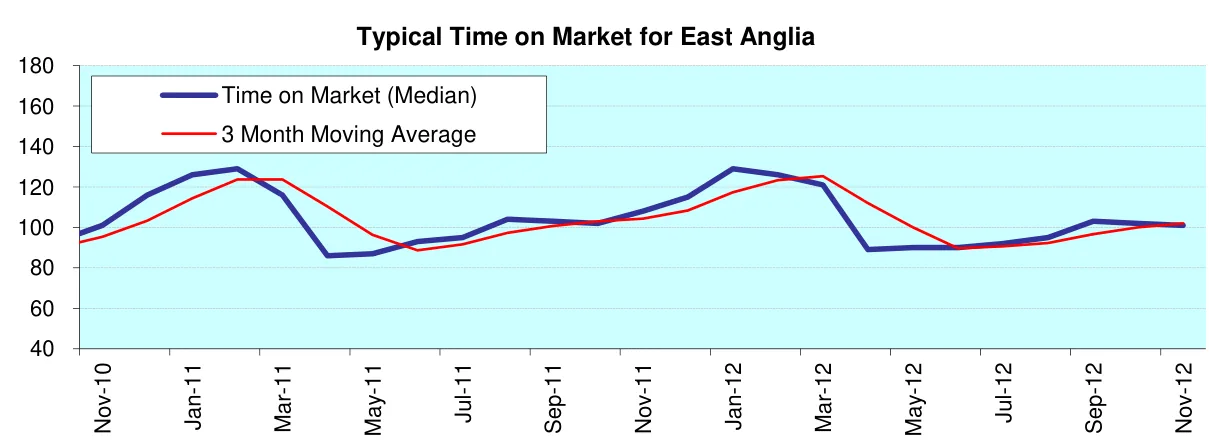
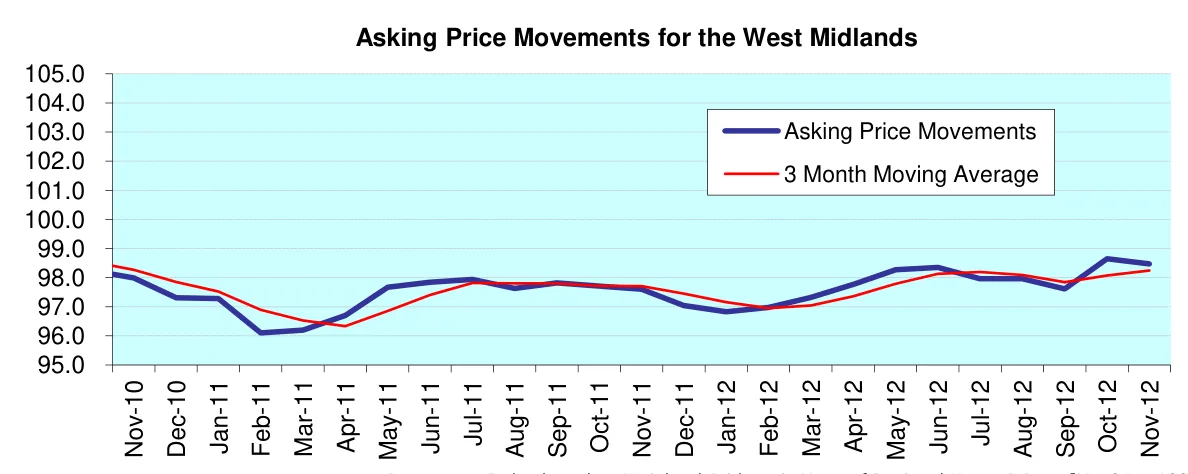
Laspeyres Index based on Weighted Arithmetic Mean of Regional House Prices [May04 = 100]
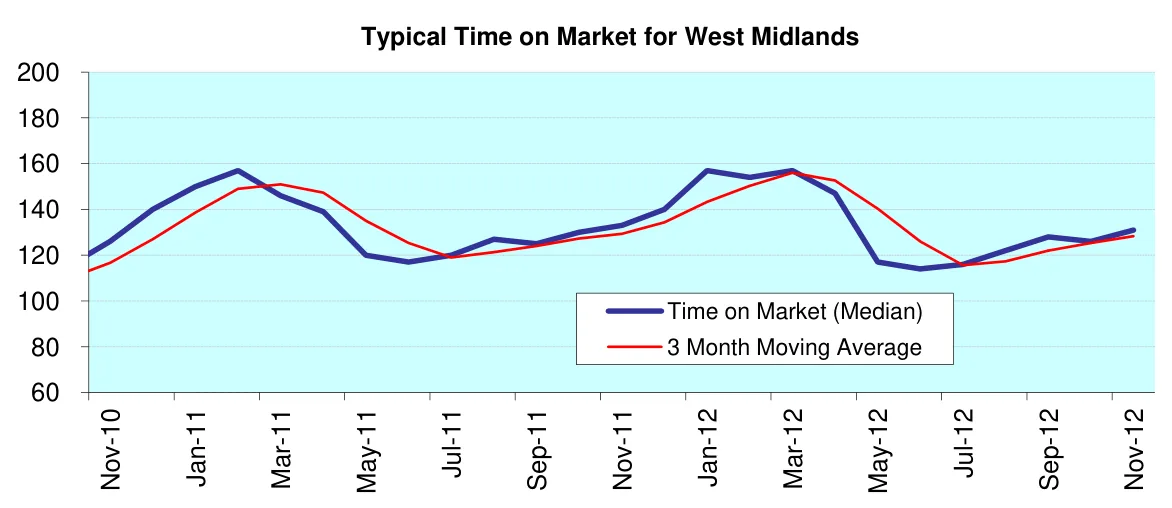
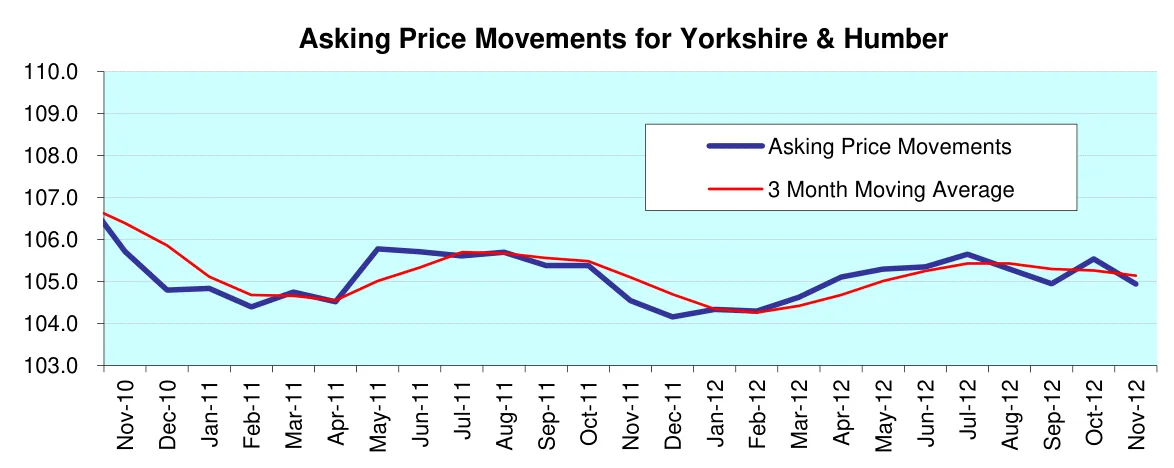
Laspeyres Index based on Weighted Arithmetic Mean of Regional House Prices [May04 = 100]
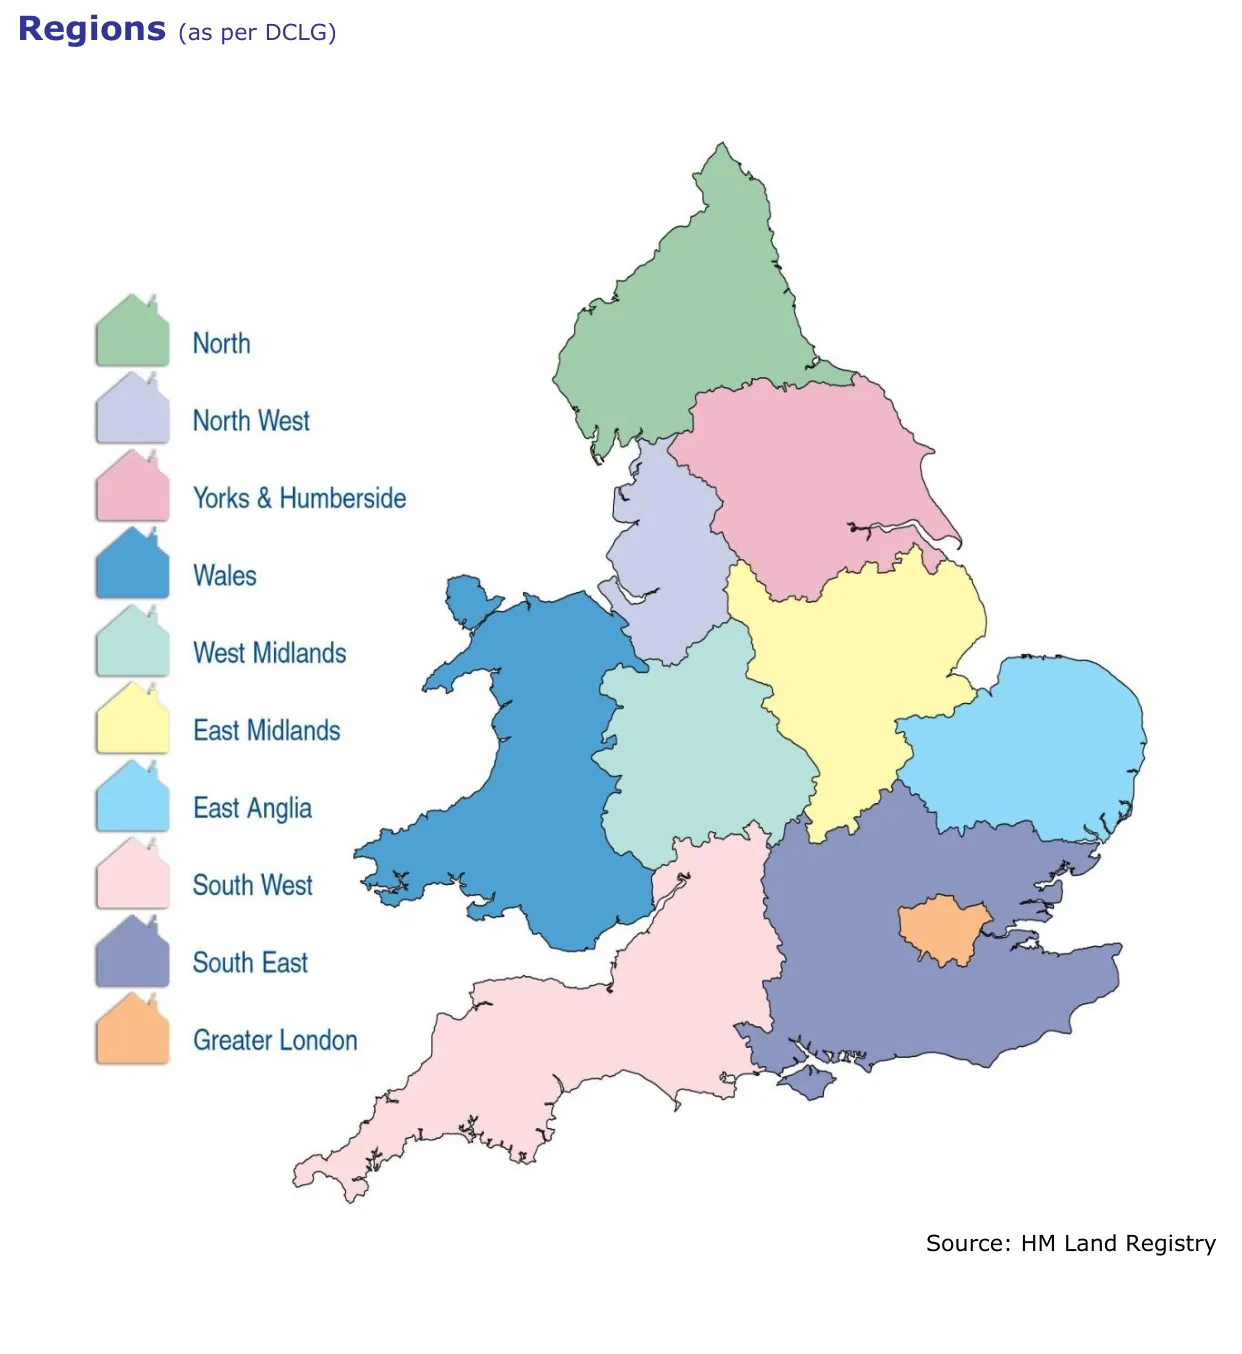
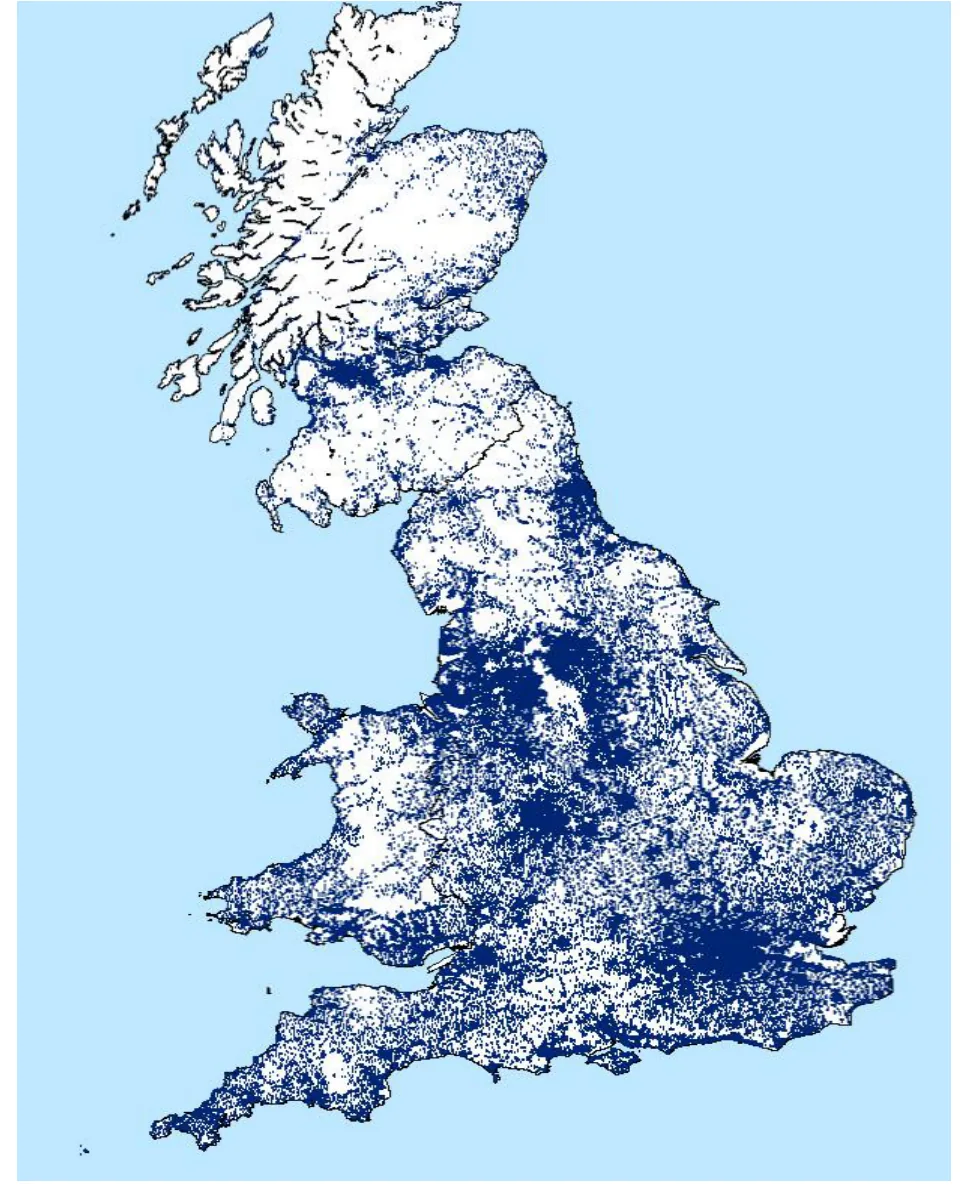
Source: HM Land Registry
Regional tables
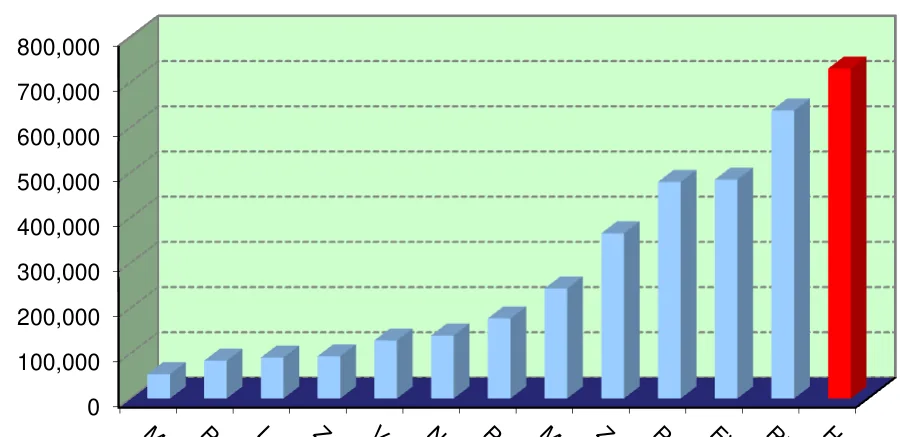
Regional asking prices for November 2012, showing gains and losses since May2012 and current typical time
| Current average price | 6-month change | Median ToM (days) | |
|---|---|---|---|
| Greater London | £359,062 | +2.7% | 88 |
| South West | £257,363 | +1.5% | 109 |
| East Anglia | £251,060 | +1.4% | 101 |
| South East | £297,906 | +1.1% | 90 |
| Scotland | £161,301 | +1.0% | 147 |
| Wales | £174,873 | +0.9% | 171 |
| North East | £153,337 | +0.8% | 182 |
| East Midlands | £175,224 | +0.6% | 125 |
| West Midlands | £189,411 | +0.2% | 131 |
| Yorkshire and Humber | £167,547 | -0.3% | 155 |
| North West | £172,156 | -0.8% | 150 |
| England & Wales | £233,720 | +2.2% | 124 |
on market.
Read the full November 2012 edition (PDF, 13 pages)
About the Home Asking Price Index
The Home Asking Price Index measures the change in the prices sellers ask for residential property across England, Wales and Scotland. Today it is computed every month from around half a million advertised homes and is mix-adjusted, so a change in what happens to be on the market does not move the figure; earlier editions state the sample they were built from. Because an asking price is set months before a sale completes, the index runs around five months ahead of completed-sale measures such as the UK House Price Index.
Every edition in the archive, back to October 2006, is listed on the index page. How we measure the UK property market explains the listing data behind it, and today's figures by area are on house prices and rental prices.
Text and figures above are quoted from the November 2012 edition as published, with punctuation normalised for the web, and are not revised. Later editions may restate them.
More in What is happening to house prices: the Home guide
Thinking about your next move?
See what your home's worth in seconds, with the UK's longest-running property data behind it.
Get an instant valuation