

























Home Asking Price Index, May 2025: sales stock soars and prices crumble in London and the South East
Unsold sales stock in England and Wales rose sharply to 533,797 while asking prices increased by just 0.4% during April 2025.

This is the May 2025 edition of the Home Asking Price Index, released on 14 May 2025, under the headline:
Sales Stock Soars and Prices Crumble in London and the South East
The headlines and summary below are the report's own words, with the key figures as it published them, followed by the report's charts and regional tables as printed.
Headlines
- Asking prices rose in every English region (except Greater London and the South East), Scotland and Wales during April, making the national average rise by a further 0.4%. Surplus stock in London and the South East is creating strong downward price pressure.
- Annualised home price growth across England and Wales continues to be well below the level of inflation at just 1.4% overall.
- The unsold sales stock count for England and Wales increased massively for a second consecutive month. 30,621 properties were added to agents' burgeoning portfolios during the last month, which is far above seasonal expectations. The current total of 533,797 is relatively very high and is the largest such figure since October 2013.
- Supply of new sales properties entering the market during April 2025 remains moderate in most areas except for minor surges in the North East and the South West. Hence, the rapid build-up of stock indicates a fall in demand since the hike in stamp duty.
- The largest April price rises were in Scotland and Yorkshire with month-on-month gains of 1.6% and 1.0% respectively.
- Scotland remains the top regional property market growth leader with an impressive year-on-year gain of 4.5% followed by Yorkshire at 4.3%. Meanwhile, the South East retains its position as the worst regional performer with a dire annualised loss of 0.4%.
- Sales market momentum shows a further increase over and above that of May 2024. High activity has upped the property turnover rate to be above any of the previous ten years of May readings. However, even this heightened throughput is not enough to prevent a serious build-up of unsold stock. Typical Time on Market is now five days higher than in May last year and rising.
- The annualised national growth in asking rents slides further into the negative (now -1.8%), driven down by increased supply (7% year-on-year). The national growth figure is in the red due mainly to the negative performance of London although negative contributions also now come from the West Midlands, the South East and Yorkshire. Meanwhile, the East Midlands continues to show exceptional performance with rental growth of 9.0%.
- Only nine of the 33 London boroughs indicate positive asking rent growth and three of those are below the 1% mark. In the boroughs of Camden and Islington, rents are down by 8.9% and 9.9% respectively.
This edition was issued as a short data bulletin with no narrative summary; the headlines above are its full commentary.
Key figures
| Measure | Figure |
|---|---|
| Average Asking Price (England & Wales) | £360,952 |
| Monthly % change (England & Wales) | 0.4% |
| Annual % change (England & Wales) | 1.4% |
| Typical Time on Market (England & Wales) | 85 |
| Average Time on Market (England & Wales) | 173 |
| Annualised % supply change (England & Wales) | 1% |
| Unsold sales stock total (England & Wales) | 533,797 |
| New properties added to stock (last month) | 30,621 |
Figures are for England and Wales unless the report states otherwise, as published in the edition.
Charts from the report
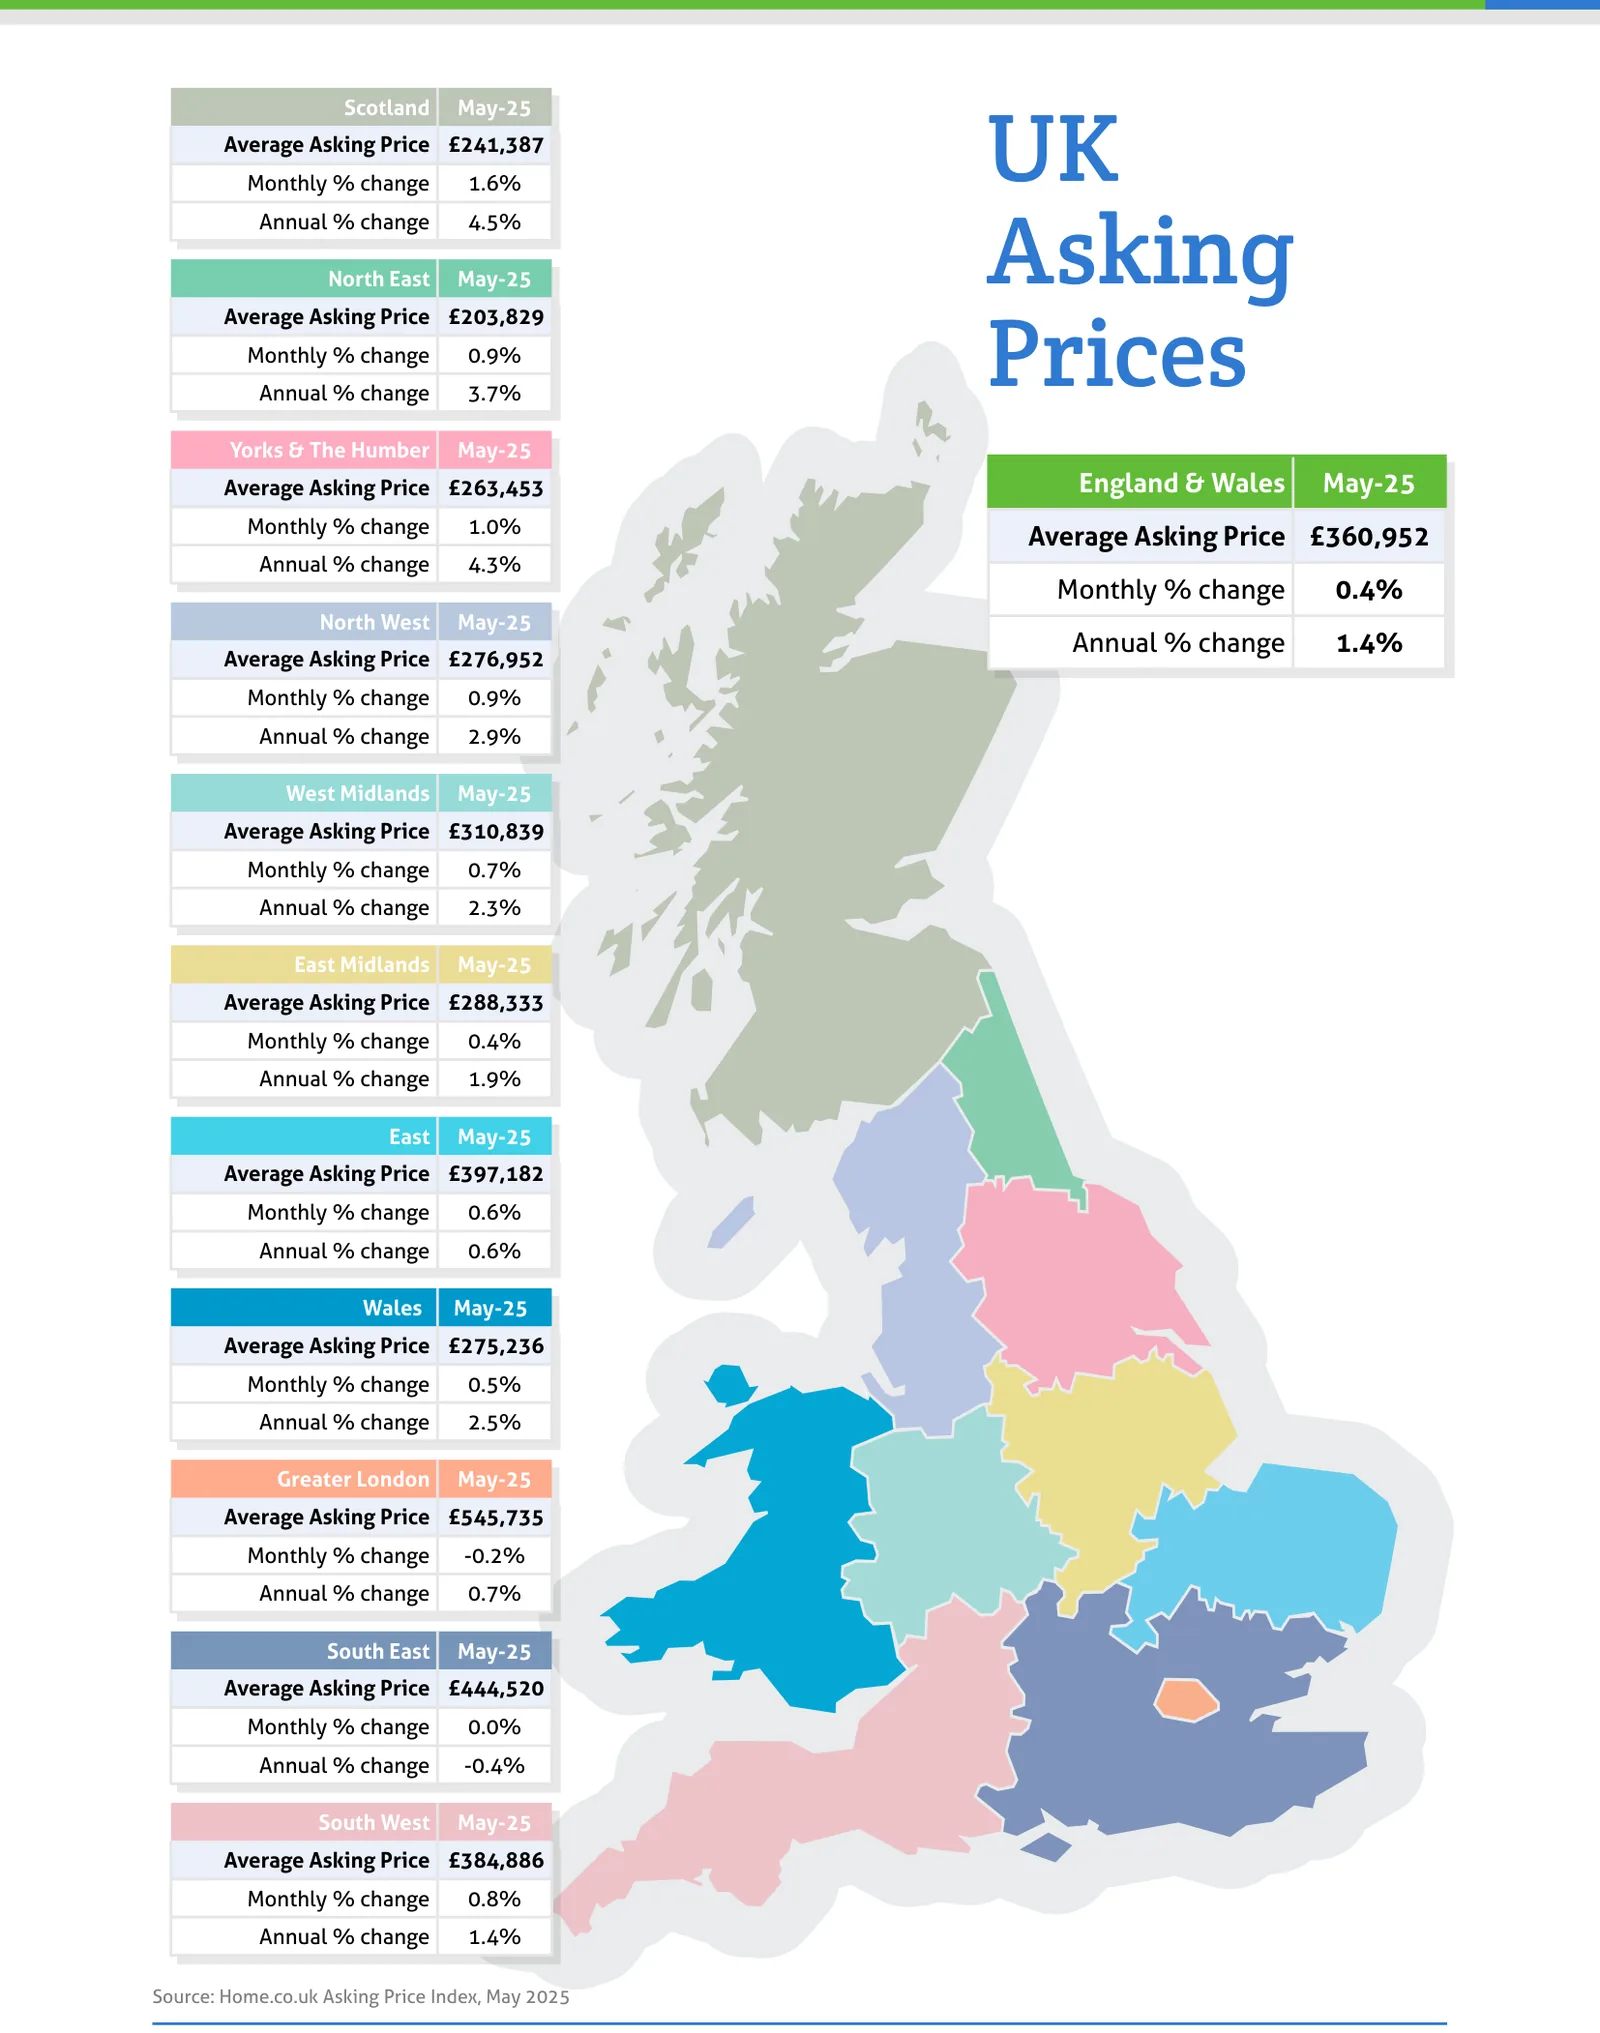
Source: Home.co.uk Asking Price Index, May 2025
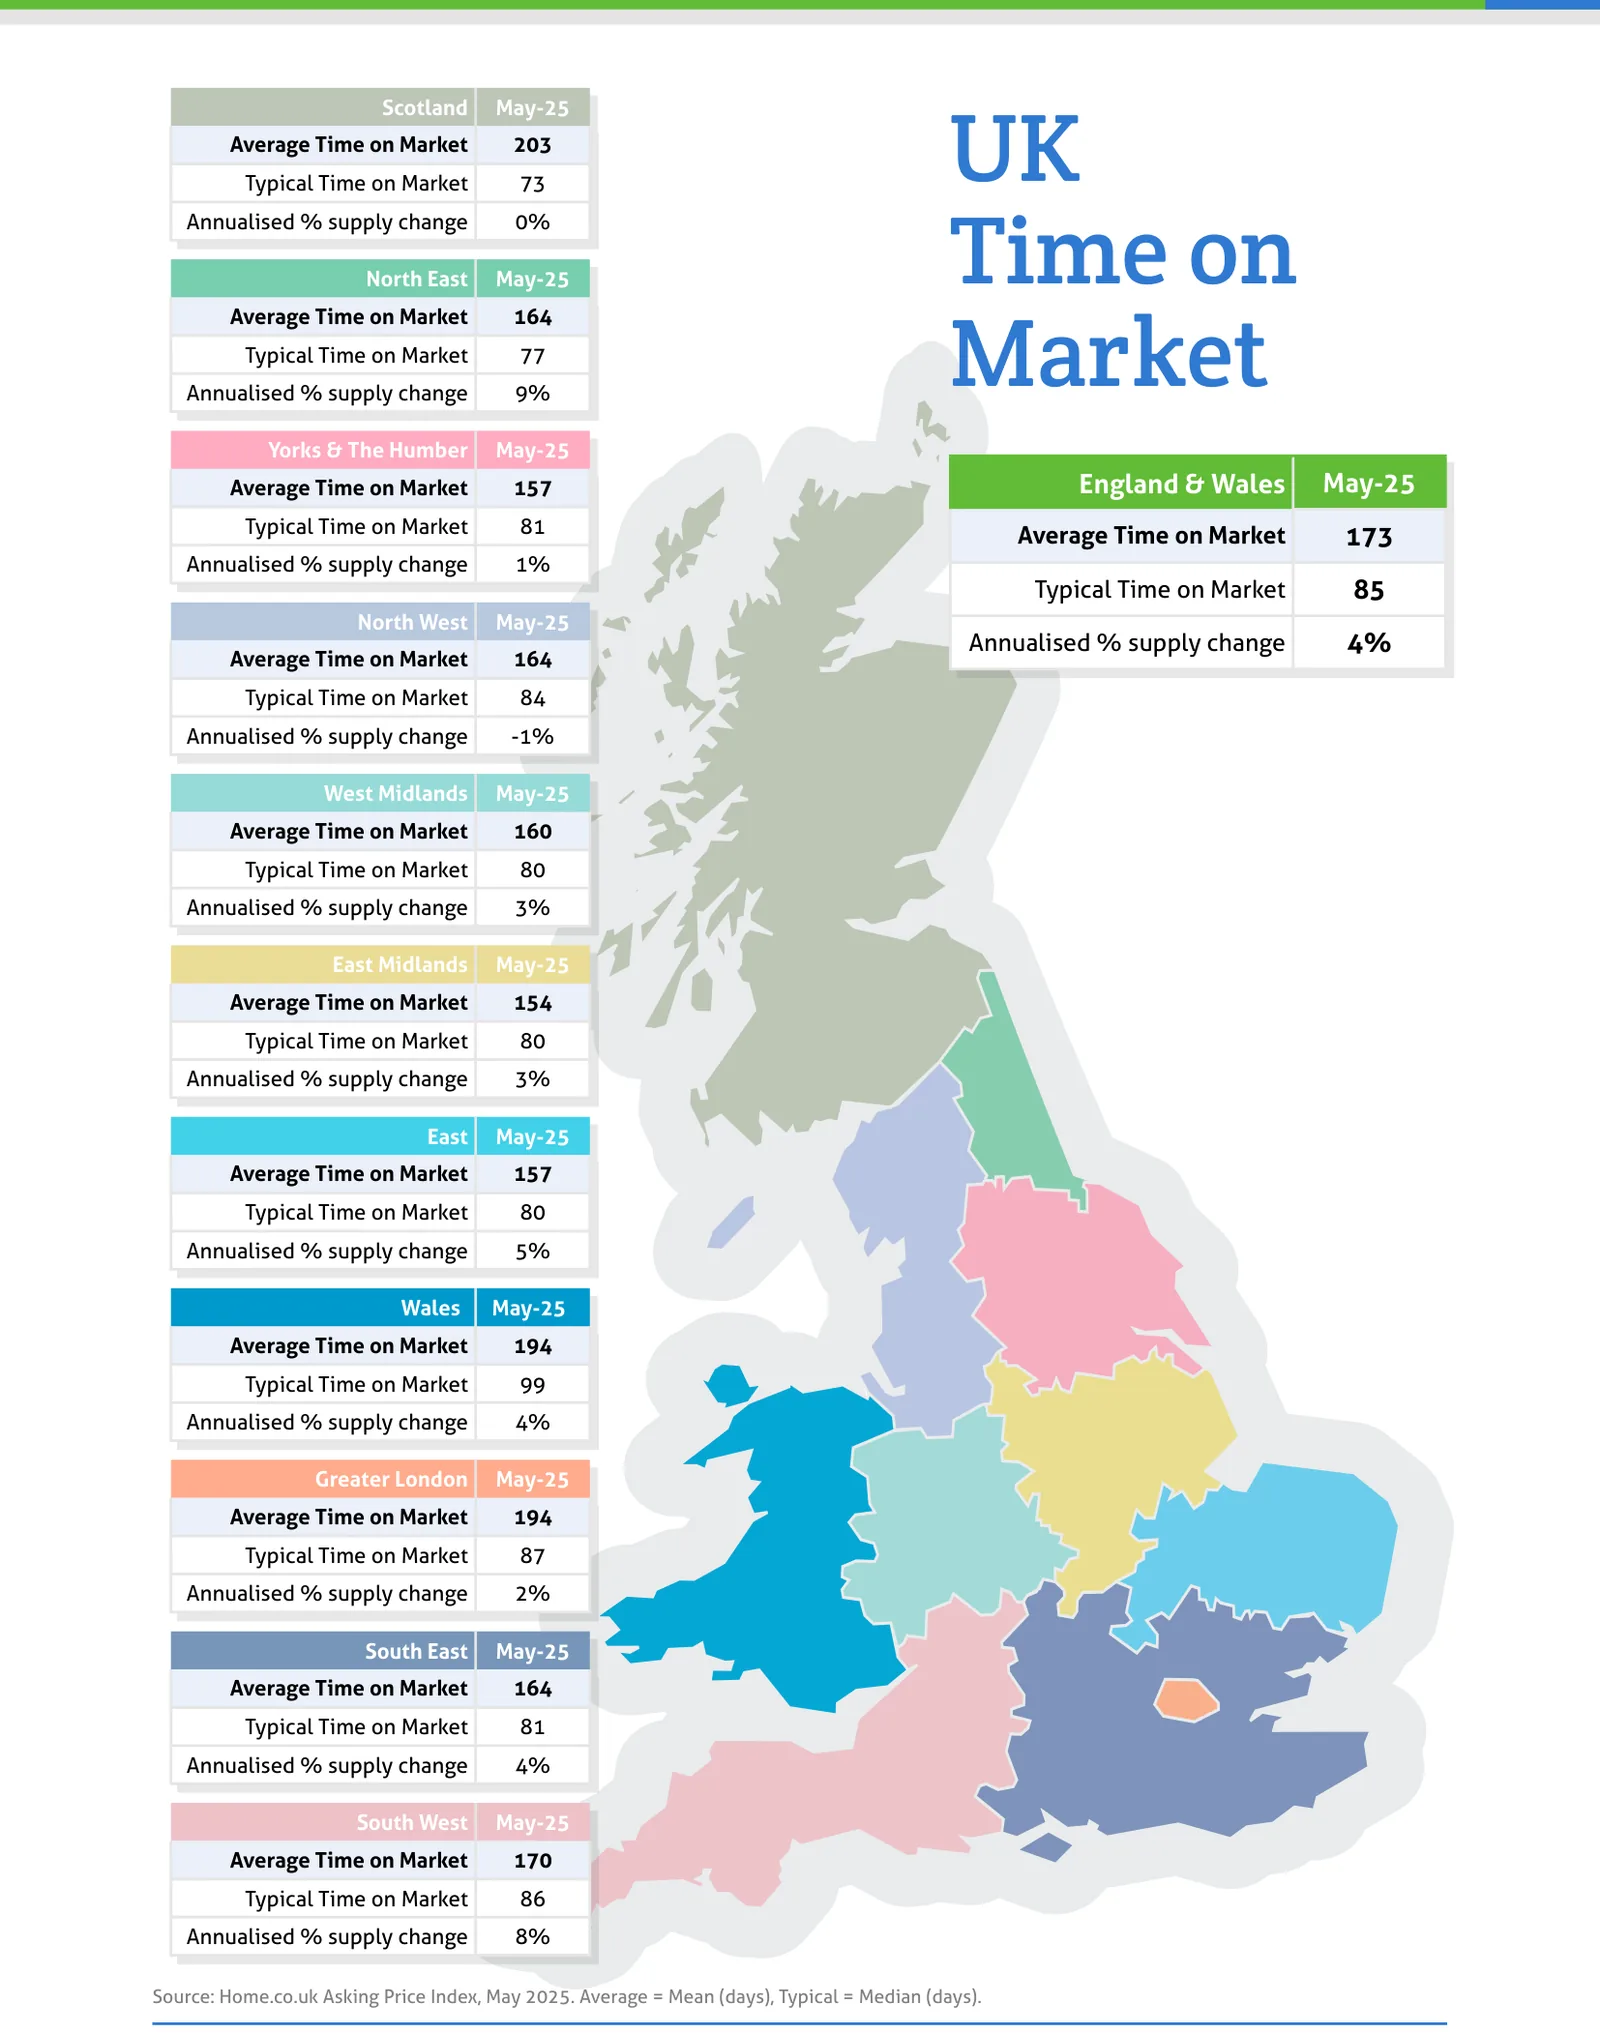
Source: Home.co.uk Asking Price Index, May 2025. Average = Mean (days), Typical = Median (days).
Regional tables
UK Asking Prices, May-25
| Region | Average Asking Price | Monthly % change | Annual % change |
|---|---|---|---|
| Scotland | £241,387 | 1.6% | 4.5% |
| North East | £203,829 | 0.9% | 3.7% |
| Yorks & The Humber | £263,453 | 1.0% | 4.3% |
| England & Wales | £360,952 | 0.4% | 1.4% |
| North West | £276,952 | 0.9% | 2.9% |
| West Midlands | £310,839 | 0.7% | 2.3% |
| East Midlands | £288,333 | 0.4% | 1.9% |
| East | £397,182 | 0.6% | 0.6% |
| Wales | £275,236 | 0.5% | 2.5% |
| Greater London | £545,735 | -0.2% | 0.7% |
| South East | £444,520 | 0.0% | -0.4% |
| South West | £384,886 | 0.8% | 1.4% |
UK Time on Market, May-25
| Region | Average Time on Market | Typical Time on Market | Annualised % supply change |
|---|---|---|---|
| Scotland | 203 | 73 | 0% |
| North East | 164 | 77 | 9% |
| Yorks & The Humber | 157 | 81 | 1% |
| England & Wales | 173 | 85 | 4% |
| North West | 164 | 84 | -1% |
| West Midlands | 160 | 80 | 3% |
| East Midlands | 154 | 80 | 3% |
| East | 157 | 80 | 5% |
| Wales | 194 | 99 | 4% |
| Greater London | 194 | 87 | 2% |
| South East | 164 | 81 | 4% |
| South West | 170 | 86 | 8% |
Read the full May 2025 edition (PDF, 4 pages)
About the Home Asking Price Index
The Home Asking Price Index measures the change in the prices sellers ask for residential property across England, Wales and Scotland. Today it is computed every month from around half a million advertised homes and is mix-adjusted, so a change in what happens to be on the market does not move the figure; earlier editions state the sample they were built from. Because an asking price is set months before a sale completes, the index runs around five months ahead of completed-sale measures such as the UK House Price Index.
Every edition in the archive, back to October 2006, is listed on the index page. How we measure the UK property market explains the listing data behind it, and today's figures by area are on house prices and rental prices.
Text and figures above are quoted from the May 2025 edition as published, with punctuation normalised for the web, and are not revised. Later editions may restate them.
More in What is happening to house prices: the Home guide
Thinking about your next move?
See what your home's worth in seconds, with the UK's longest-running property data behind it.
Get an instant valuation