

























Home Asking Price Index, May 2024: home prices rise further while stock levels surge
Asking prices in England and Wales rose 0.4% in the month while unsold stock surged to 475,785, the highest since November 2018.

This is the May 2024 edition of the Home Asking Price Index, released on 15 May 2024, under the headline:
Home Prices Rise Further While Stock Levels Surge
The headlines and summary below are the report's own words, with the key figures as it published them, followed by the report's charts and regional tables as printed.
Headlines
- Asking prices have risen a fairly modest 0.4% since last month across England and Wales and are up just 0.4% since May 2023.
- The total unsold sales stock count for England and Wales surged during the last month. Around 21,000 properties were added to agents' portfolios, surpassing the maximum total set in October 2023 and making the current count of 475,785 the largest since November 2018. Supply outpaced demand.
- Prices increased again in all English regions and in Scotland during the last month. Vendors in Wales were less optimistic and moderated their asking prices by the smallest margin (0.1%).
- Market momentum remains relatively healthy, as indicated by the Typical Time on Market (median) for unsold property in England and Wales being one day less than last year. However, the current mean time on market at 165 days is eight days higher than in May 2023, indicating that harder to shift properties are hanging around longer on the market.
- The number of new instructions during April 2024 was 7% more than during April 2023. The increase may be based on the hope of a cut in mortgage rates as opposed to the actual supply/demand balance of the current market.
- The North West remains the regional property market growth leader with a year-on-year gain of 3.7%, while the East Midlands is now the worst performing region over the same period at -1.3%.
- The national growth figure for asking rents is an annualised 3.4% although some regions, for example the North East and Yorkshire, are indicating growth at +17.4% and +15.1% year-on-year respectively. Meanwhile, Greater London rents are down 3.2%, which is a slower rate of decline than previously observed.
- Rents continue to correct in several London boroughs in response to increased supply. However, the overall picture shows that boroughs with falling rents are now in the minority, with 18 of the 33 boroughs indicating year-on-year rises. Some larger central boroughs such as Islington have returned to significant growth (+7.7%), while the worst performer is now Richmond with a year-on-year fall of 10.3%.
Summary
While uncertainty about a rate cut continues to hamstring the UK economy, the European Central Bank has, quite sensibly, firmly signalled an imminent cut and both Sweden and Switzerland have already cut. Uncertainty is eroding Britain's business and consumer confidence and what we are seeing now is a minor dose of the jitters. Obviously, the danger for the UK property market is that rising supply will create a glut and therefore a standoff between buyers and sellers, while the procrastination experts of Threadneedle Street sit on their hands.
Rapidly rising stock levels is impacting price growth. This month's overall increase of just 0.4% indicates that vendors' confidence has been somewhat dented as transaction rates wane. However, vendors in the North East, Yorkshire and Scotland remain much more bullish than in the southern regions.
Steadily rising mortgage costs have negatively impacted the market rebound. Earlier this year, the market factored in a cut in the Bank of England base rate as inflation fell precipitously, and this encouraged plenty of potential vendors to commit. However, actual mortgage rates have been rising ever since due to increasing market pessimism about inflation and this has gently put the brakes on the recovery. Understandable hesitancy on the part of buyers has resulted in a surge of oversupply which will negatively impact price growth going forward.
Key figures
| Measure | Figure |
|---|---|
| Monthly change in asking prices | +0.4% |
| Annual change in asking prices | +0.4% |
| Total unsold stock | 475,785 |
| Typical Time on Market | 80 days |
| Mean time on market | 165 days |
| New instructions change | +7% |
| Asking rents annual growth | +3.4% |
Figures are for England and Wales unless the report states otherwise, as published in the edition.
Charts from the report
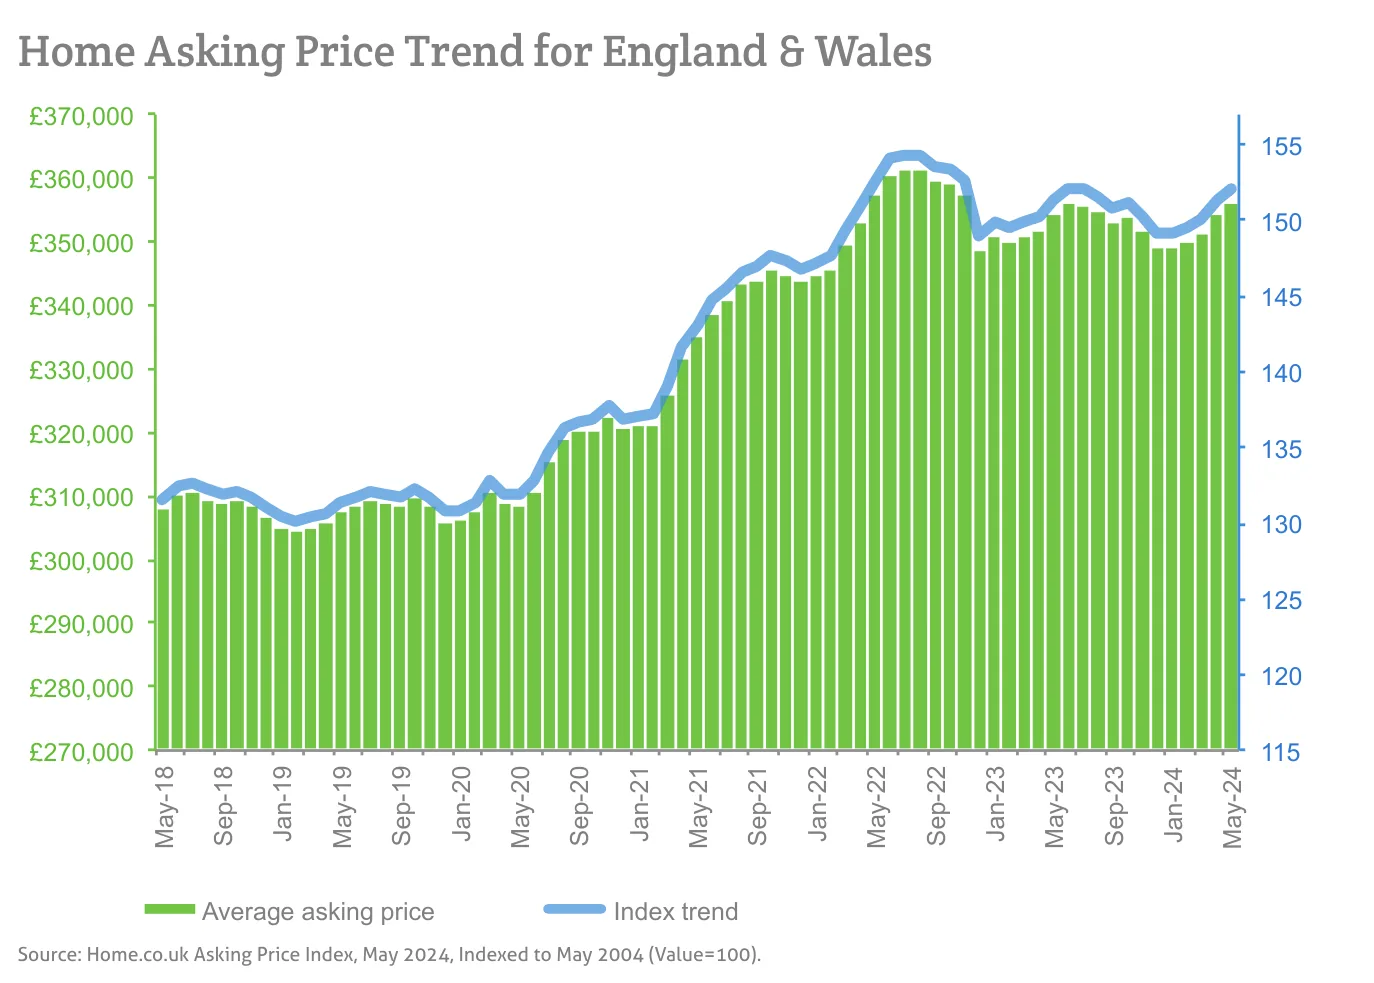
Source: Home.co.uk Asking Price Index, May 2024, Indexed to May 2004 (Value=100).
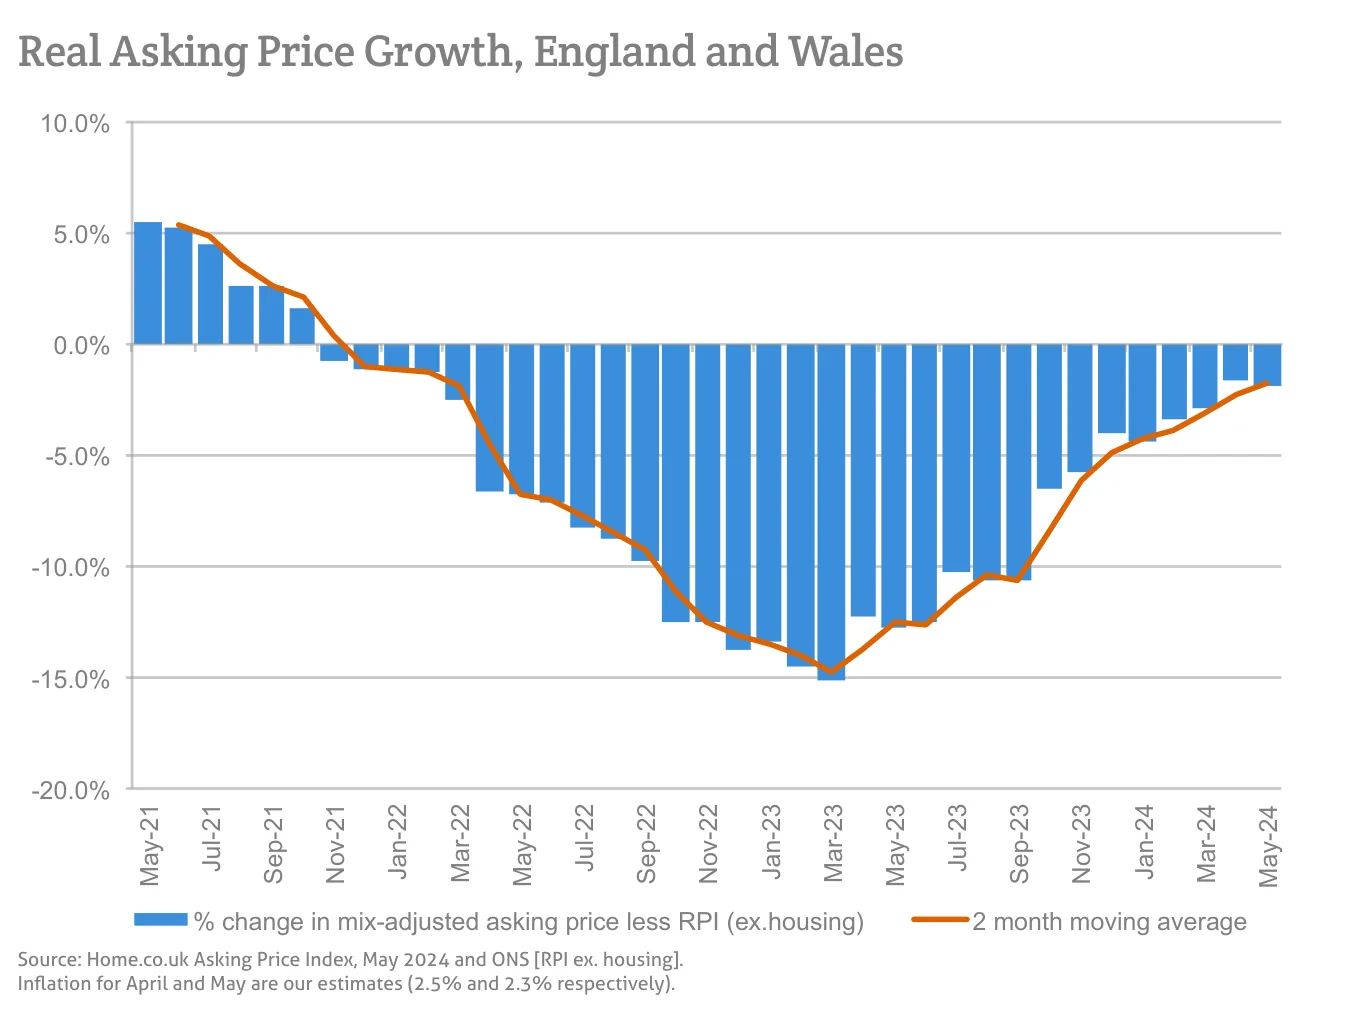
Source: Home.co.uk Asking Price Index, May 2024 and ONS [RPI ex. housing].
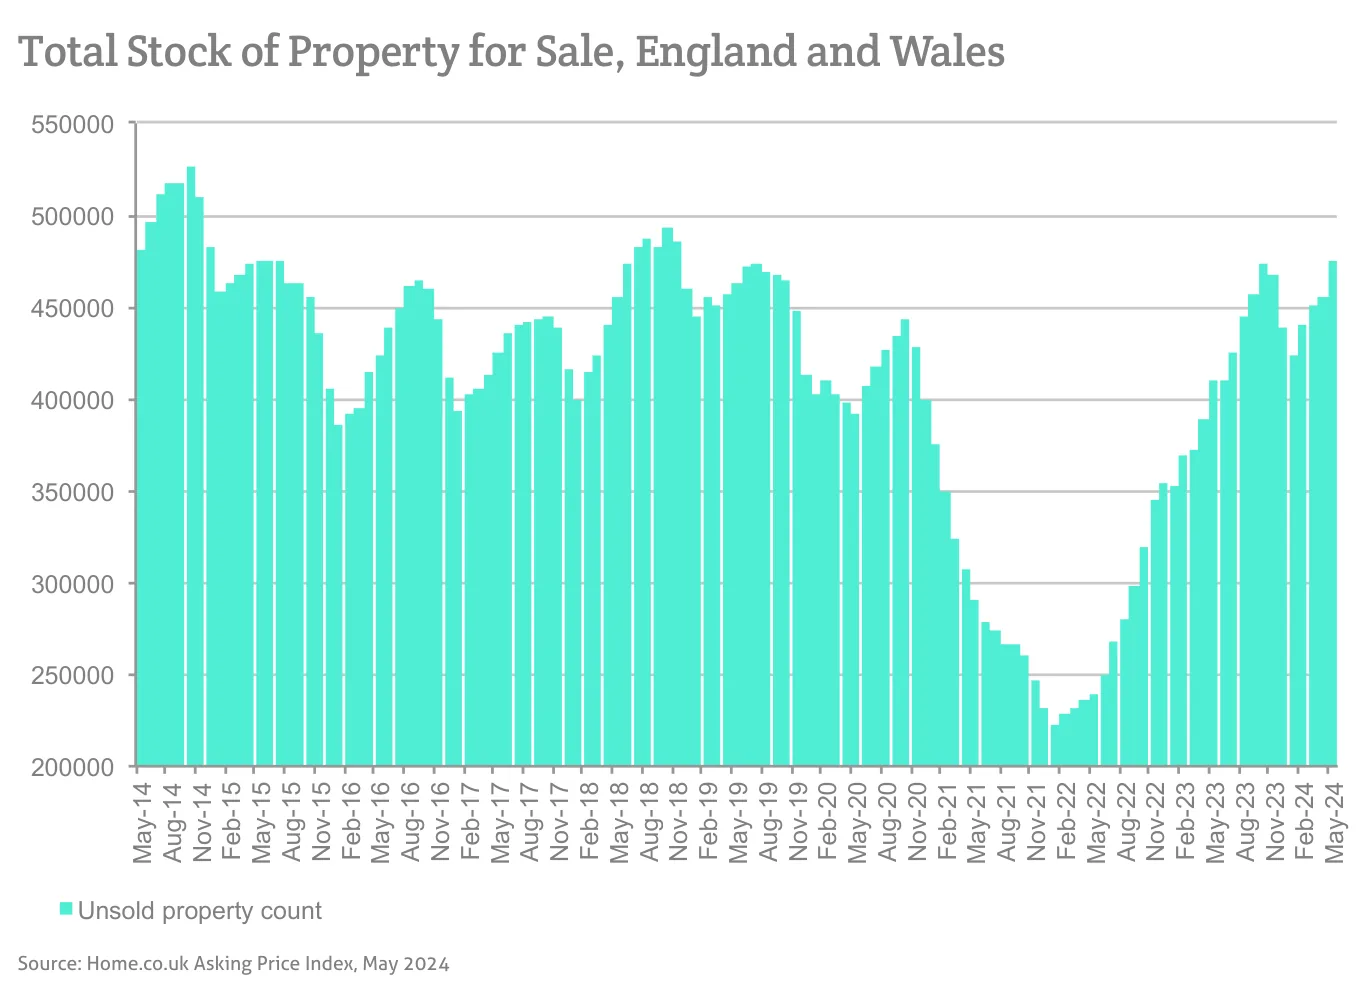
Source: Home.co.uk Asking Price Index, May 2024
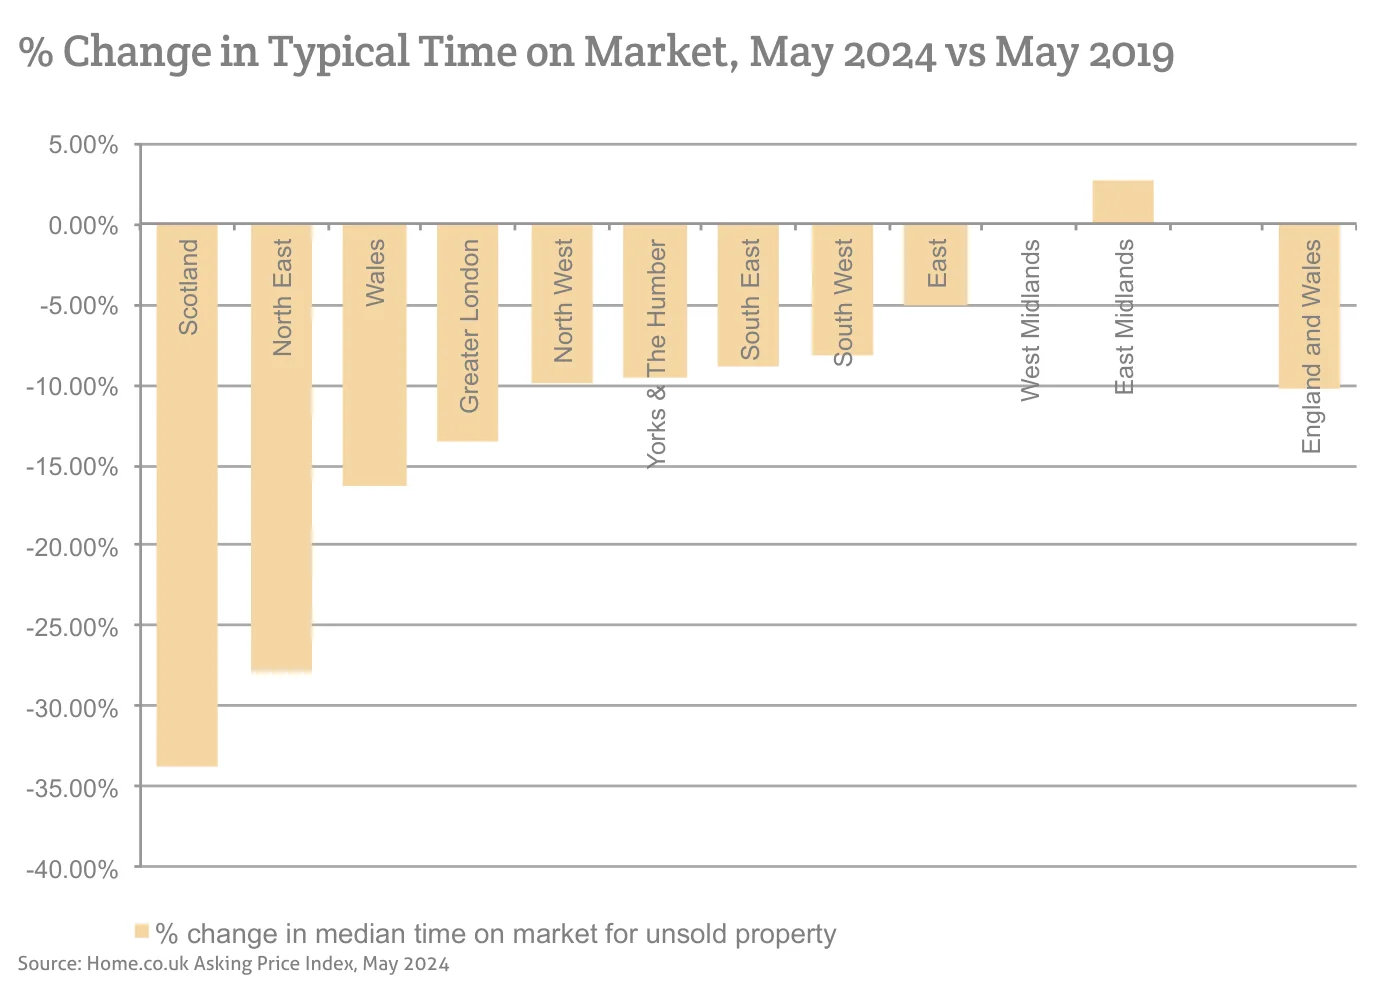
Source: Home.co.uk Asking Price Index, May 2024
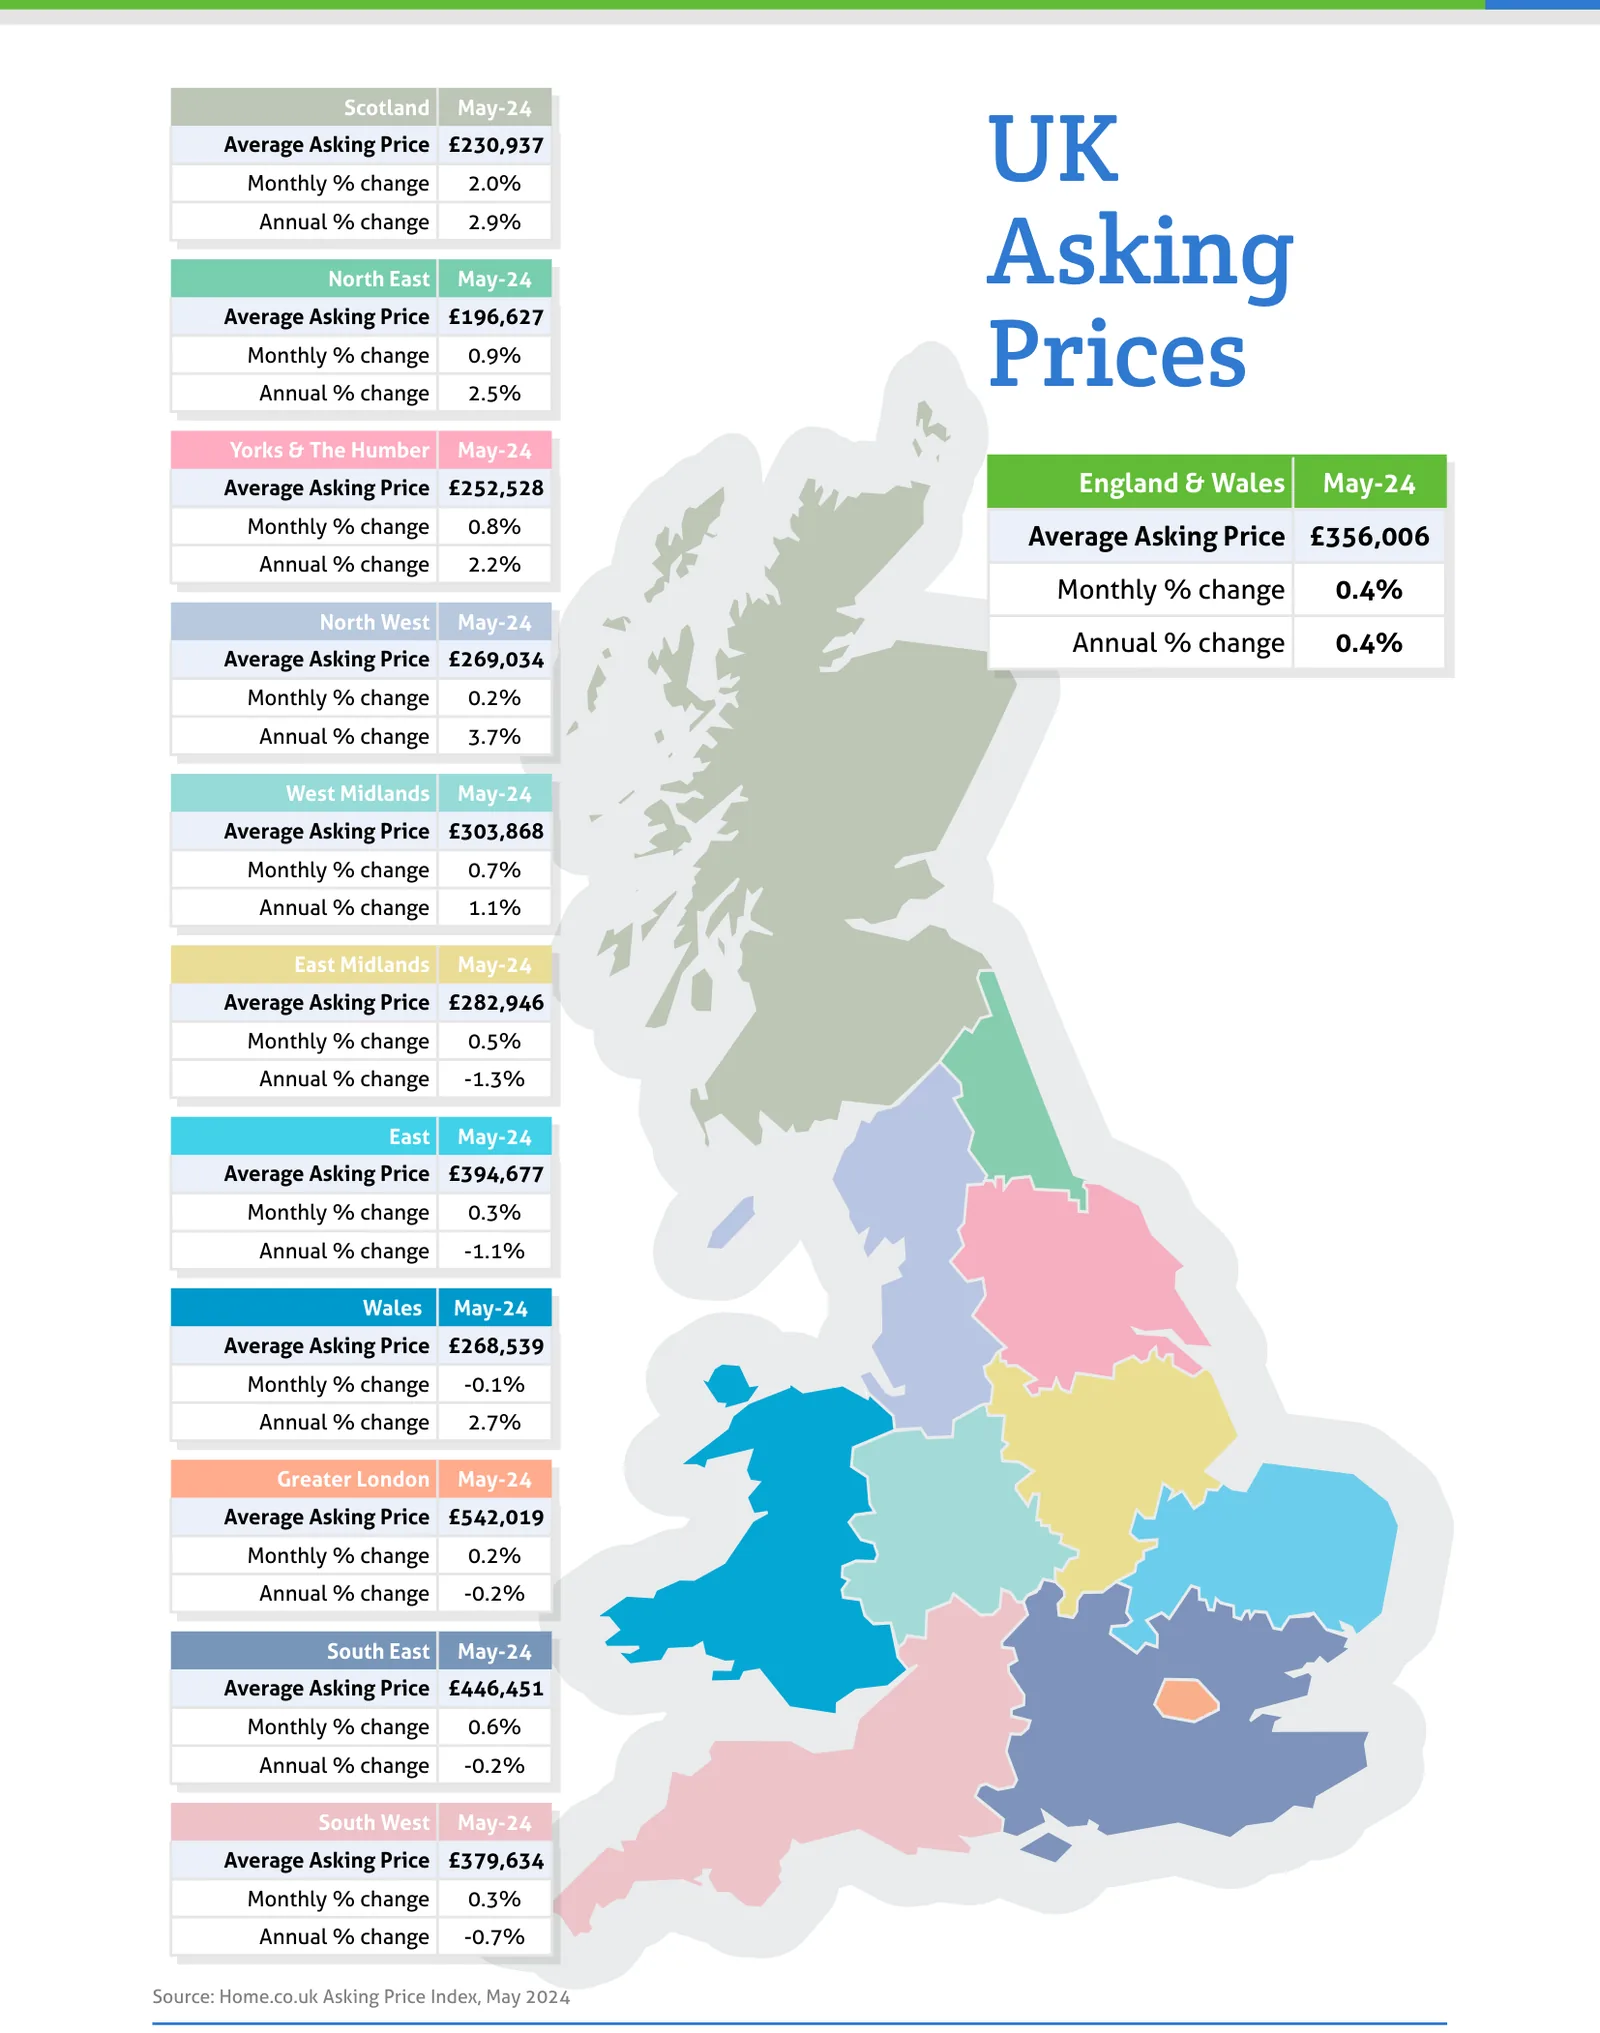
Source: Home.co.uk Asking Price Index, May 2024
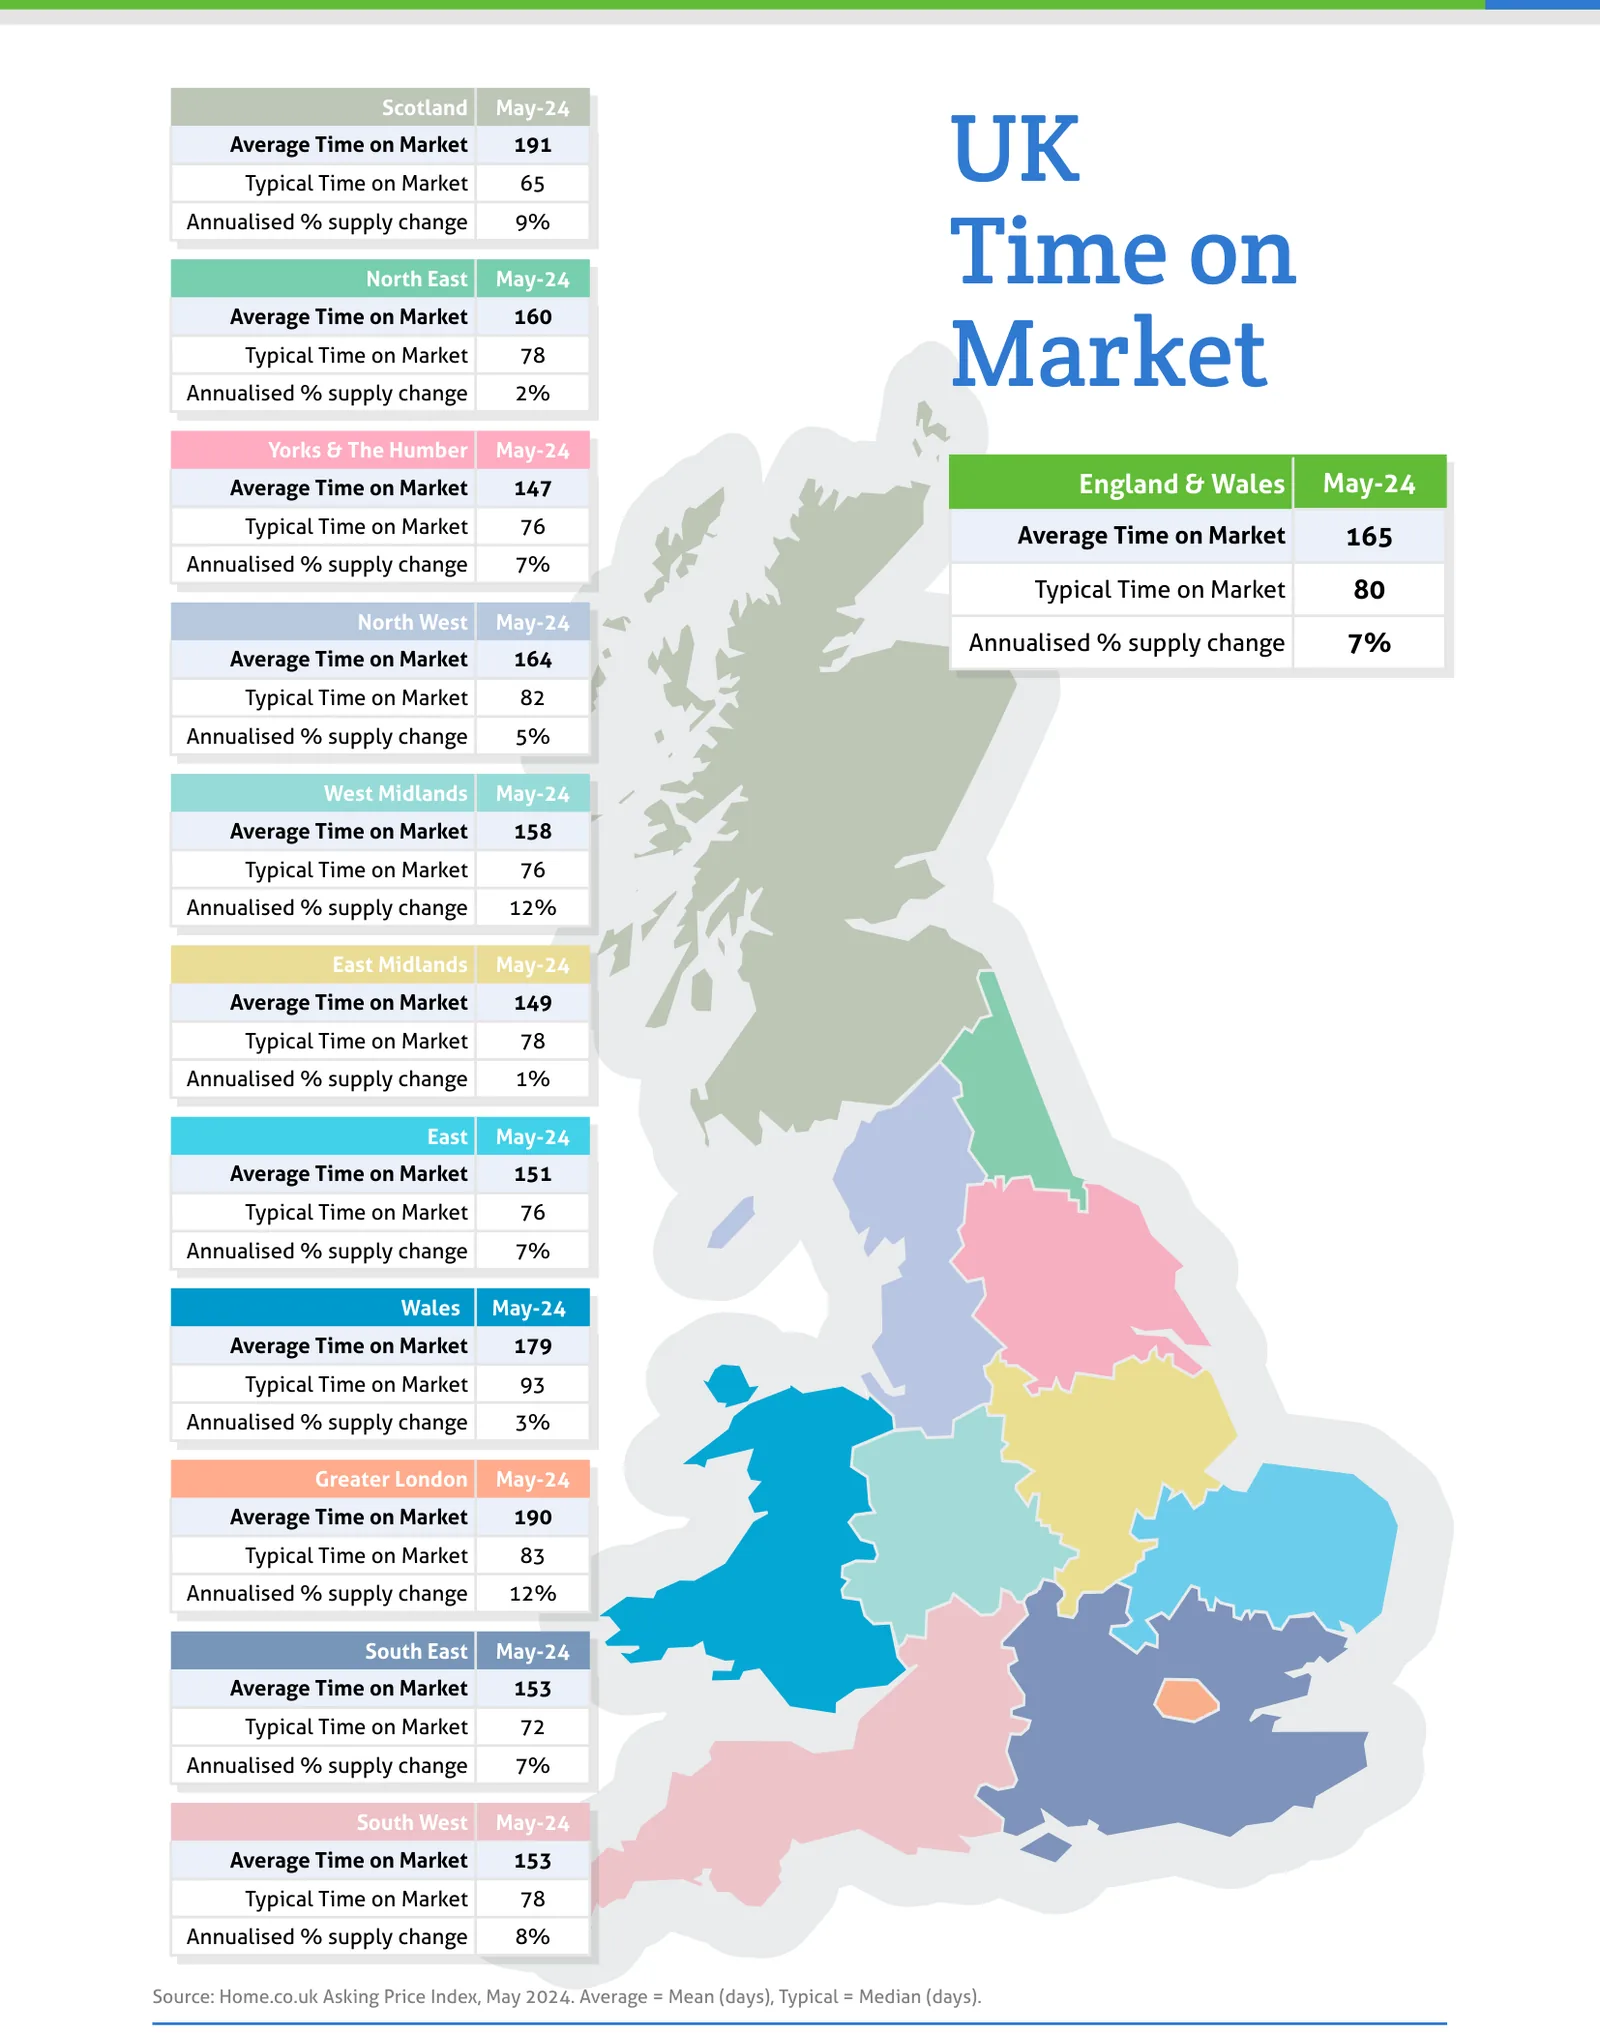
Source: Home.co.uk Asking Price Index, May 2024. Average = Mean (days), Typical = Median (days).
Regional tables
UK Asking Prices, May-24
| Region | Average Asking Price | Monthly % change | Annual % change |
|---|---|---|---|
| Scotland | £230,937 | 2.0% | 2.9% |
| North East | £196,627 | 0.9% | 2.5% |
| Yorks & The Humber | £252,528 | 0.8% | 2.2% |
| England & Wales | £356,006 | 0.4% | 0.4% |
| North West | £269,034 | 0.2% | 3.7% |
| West Midlands | £303,868 | 0.7% | 1.1% |
| East Midlands | £282,946 | 0.5% | -1.3% |
| East | £394,677 | 0.3% | -1.1% |
| Wales | £268,539 | -0.1% | 2.7% |
| Greater London | £542,019 | 0.2% | -0.2% |
| South East | £446,451 | 0.6% | -0.2% |
| South West | £379,634 | 0.3% | -0.7% |
UK Time on Market, May-24
| Region | Average Time on Market | Typical Time on Market | Annualised % supply change |
|---|---|---|---|
| Scotland | 191 | 65 | 9% |
| North East | 160 | 78 | 2% |
| Yorks & The Humber | 147 | 76 | 7% |
| England & Wales | 165 | 80 | 7% |
| North West | 164 | 82 | 5% |
| West Midlands | 158 | 76 | 12% |
| East Midlands | 149 | 78 | 1% |
| East | 151 | 76 | 7% |
| Wales | 179 | 93 | 3% |
| Greater London | 190 | 83 | 12% |
| South East | 153 | 72 | 7% |
| South West | 153 | 78 | 8% |
Read the full May 2024 edition (PDF, 9 pages)
About the Home Asking Price Index
The Home Asking Price Index measures the change in the prices sellers ask for residential property across England, Wales and Scotland. Today it is computed every month from around half a million advertised homes and is mix-adjusted, so a change in what happens to be on the market does not move the figure; earlier editions state the sample they were built from. Because an asking price is set months before a sale completes, the index runs around five months ahead of completed-sale measures such as the UK House Price Index.
Every edition in the archive, back to October 2006, is listed on the index page. How we measure the UK property market explains the listing data behind it, and today's figures by area are on house prices and rental prices.
Text and figures above are quoted from the May 2024 edition as published, with punctuation normalised for the web, and are not revised. Later editions may restate them.
More in What is happening to house prices: the Home guide
Thinking about your next move?
See what your home's worth in seconds, with the UK's longest-running property data behind it.
Get an instant valuation