

























Home Asking Price Index, May 2023: prices jump on spring optimism
Asking prices in England and Wales rose 0.8% in April, though annual growth remained negative at 0.8%, while stock levels increased to 409,559.
This is the May 2023 edition of the Home Asking Price Index, released on 12 May 2023, under the headline:
Prices Jump on Spring Optimism
The headlines and summary below are the report's own words, with the key figures as it published them, followed by the report's charts and regional tables as printed.
Headlines
- Asking prices across England and Wales surged during April by 0.8% on a wave of optimism, although year-on-year growth slipped further into the negative (-0.8%).
- The Typical Time on Market for unsold property in England and Wales increased by four days during April to make the current median 81 days, in line with seasonal expectations.
- Asking prices in April rose in Scotland, Wales and all English regions. The steepest rise was in the South East (+1.6%).
- The total sales stock count for England and Wales increased again during April by 21,077 to reach 409,559. This further significant rise takes the total to just under the 10-year average of 418,885.
- The supply rate of new instructions entering the market remains relatively restrained: up 5% on April 2022 but down 6% on April 2021.
- Typical Time on Market rose in all English regions during April but fell in Scotland and Wales.
- The Scottish property market remains the new leader in terms of annualised regional price growth (5.5%), while London is the laggard at -3.0%.
- Rents across the UK continue to rise (12.4% annualised) led by Greater London (up 18.7%). Supply remains very tight in the lettings sector.
- The current new growth leaders in asking rents are the London boroughs of Bexley and Hillingdon (+32% and +30% annualised respectively).
Summary
To date, the recovery of the UK property market in the wake of the interest rate shocks is well underway. Prices underwent a significant correction and subsequently the market regained much lost momentum. This month's data is consistent with the typical operation of the marketplace for the time of year. In fact, the current key indicators are completely in line with market observations for the seven years prior to the pandemic.
More cautious pricing might have been expected given the considerable uncertainty about interest rates. However, vendors appear to have brushed aside the Bank of England's hand-wringing and negative messaging that was seemingly designed to undermine buyer confidence and create a fearful climate of wait-and-see hesitancy.
Rising asking prices across all English regions, Scotland and Wales indicate a renewed level of confidence among vendors and a further bold step along the road to recovery. At the same time, rising stock levels and longer marketing times, while normal for the time of year, will both serve to restrain further price hikes going forward. Of course, overly optimistic pricing risks a stand-off between buyers and sellers that could spark a further price correction and stall the market.
Key figures
| Measure | Figure |
|---|---|
| Monthly change in asking prices | +0.8% |
| Annual change in asking prices | -0.8% |
| Typical Time on Market | 81 days |
| Total unsold stock | 409,559 |
| 10-year average stock | 418,885 |
| New instructions vs April 2022 | +5% |
| UK average asking rent growth (annualised) | +12.4% |
| 3-year price rise since May 2020 | 14.8% |
Figures are for England and Wales unless the report states otherwise, as published in the edition.
Charts from the report
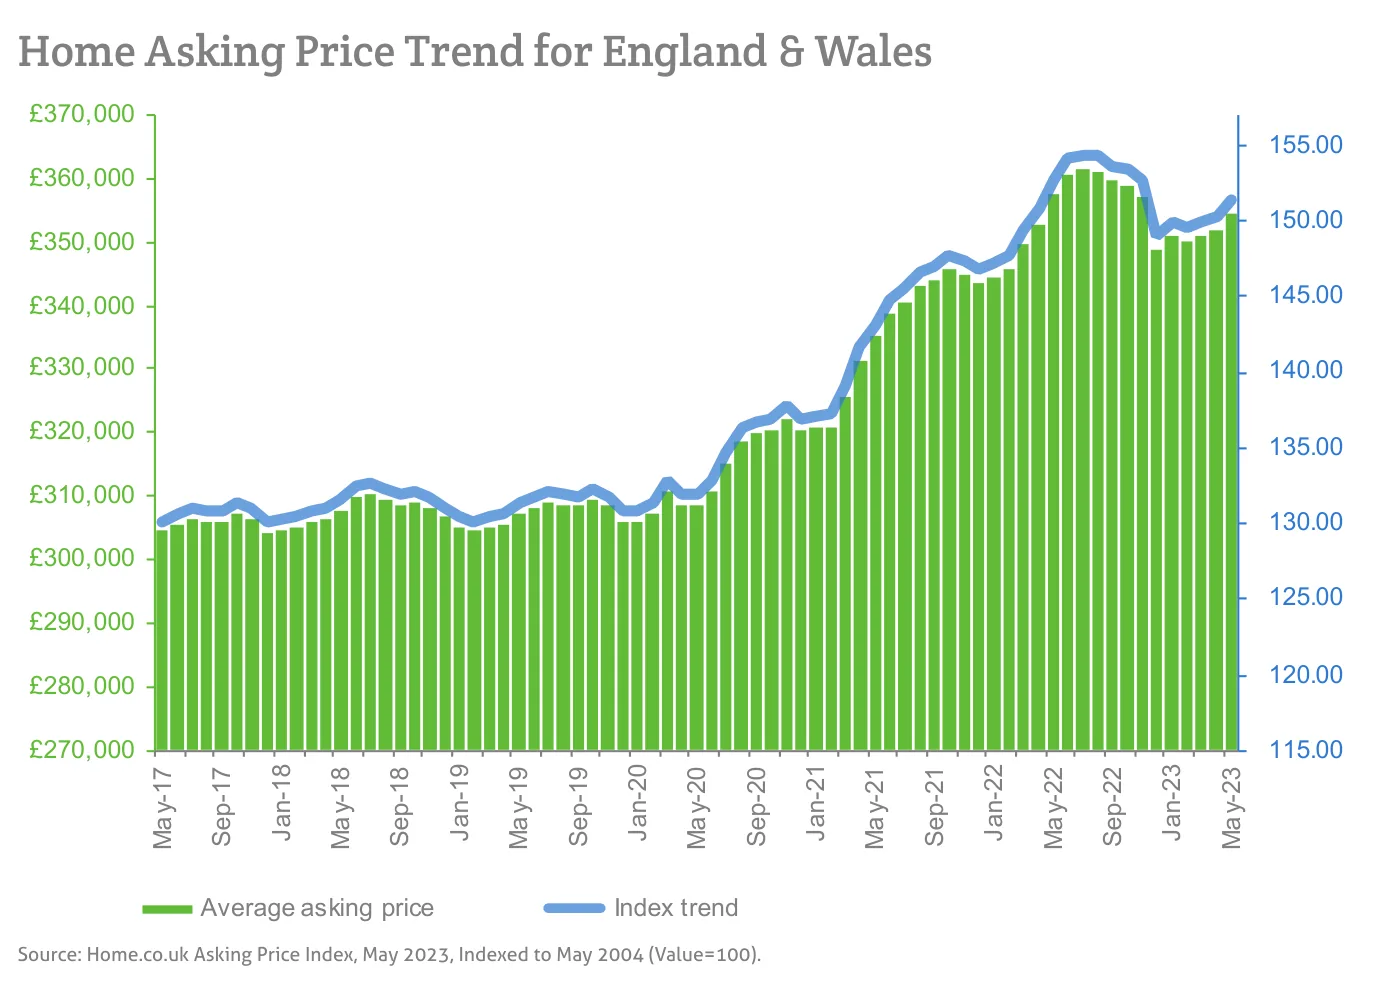
Source: Home.co.uk Asking Price Index, May 2023, Indexed to May 2004 (Value=100).
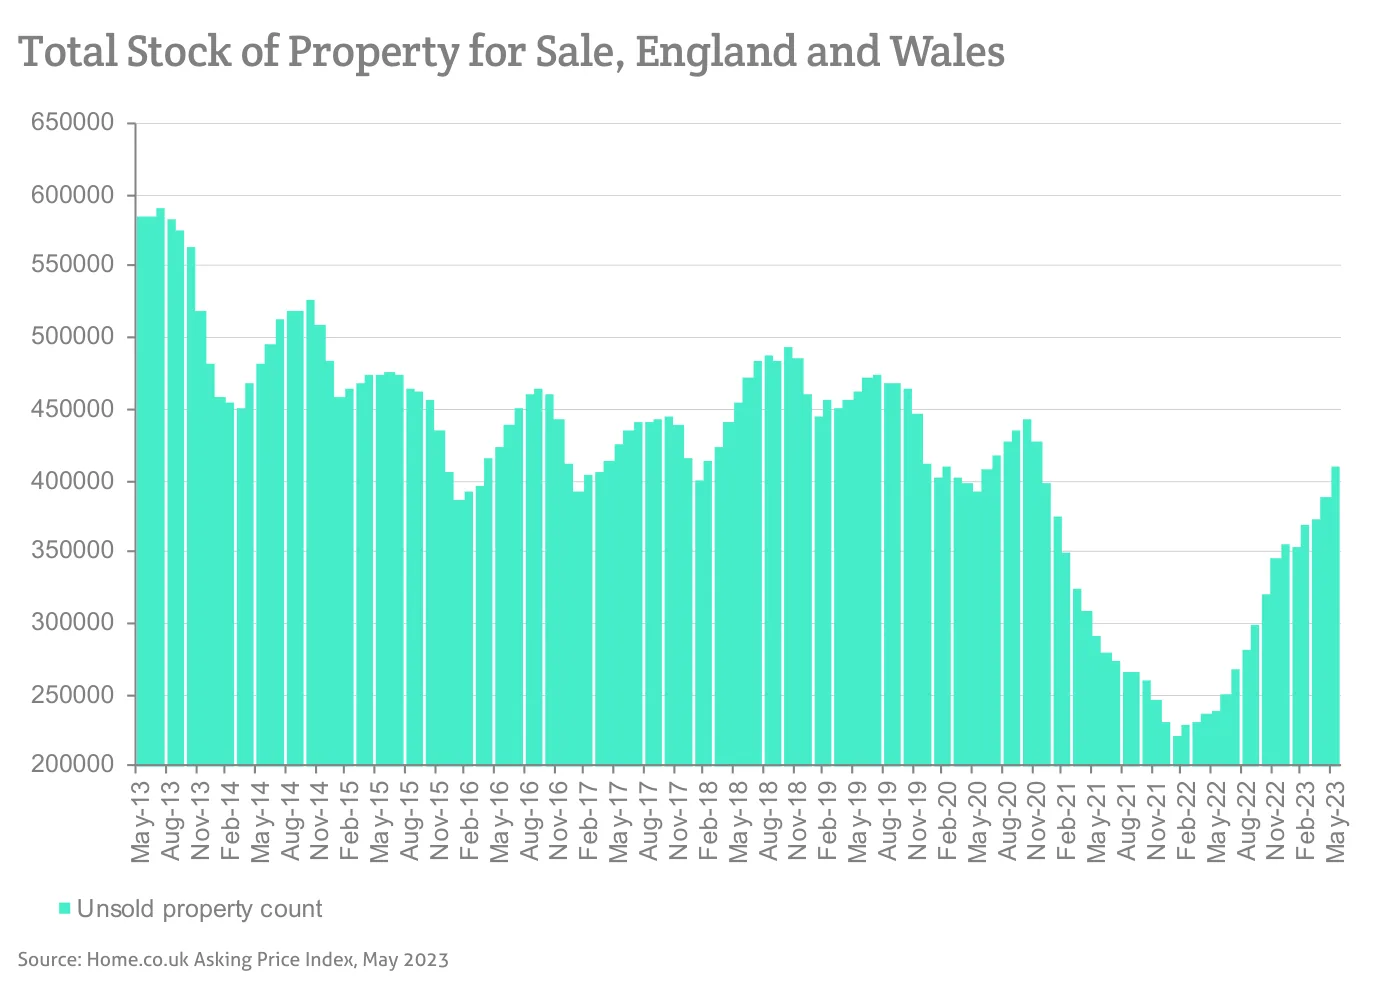
Source: Home.co.uk Asking Price Index, May 2023
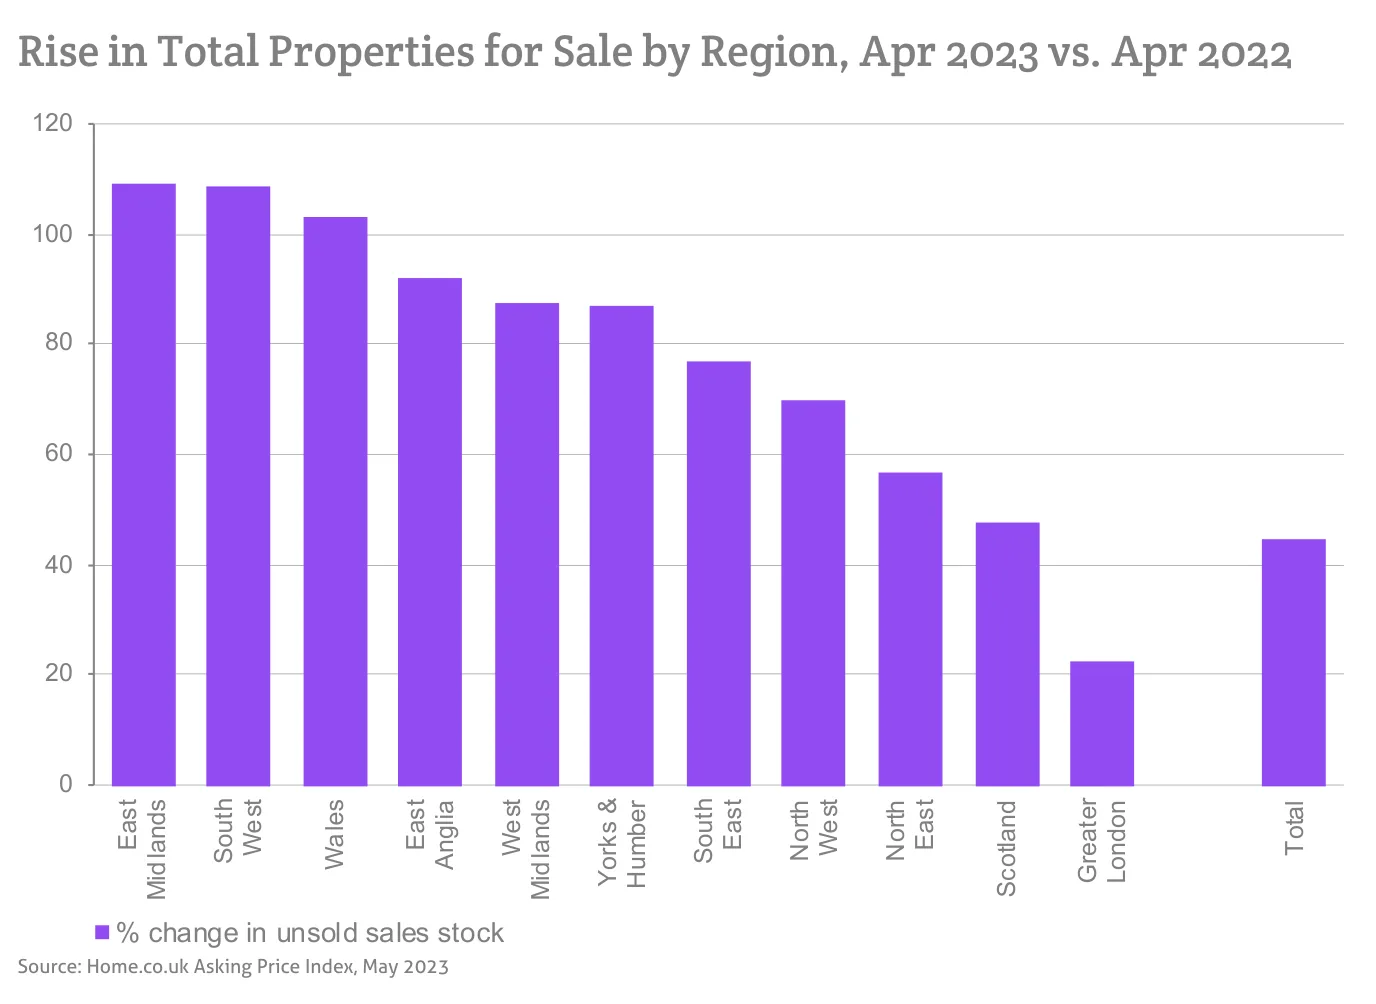
Source: Home.co.uk Asking Price Index, May 2023
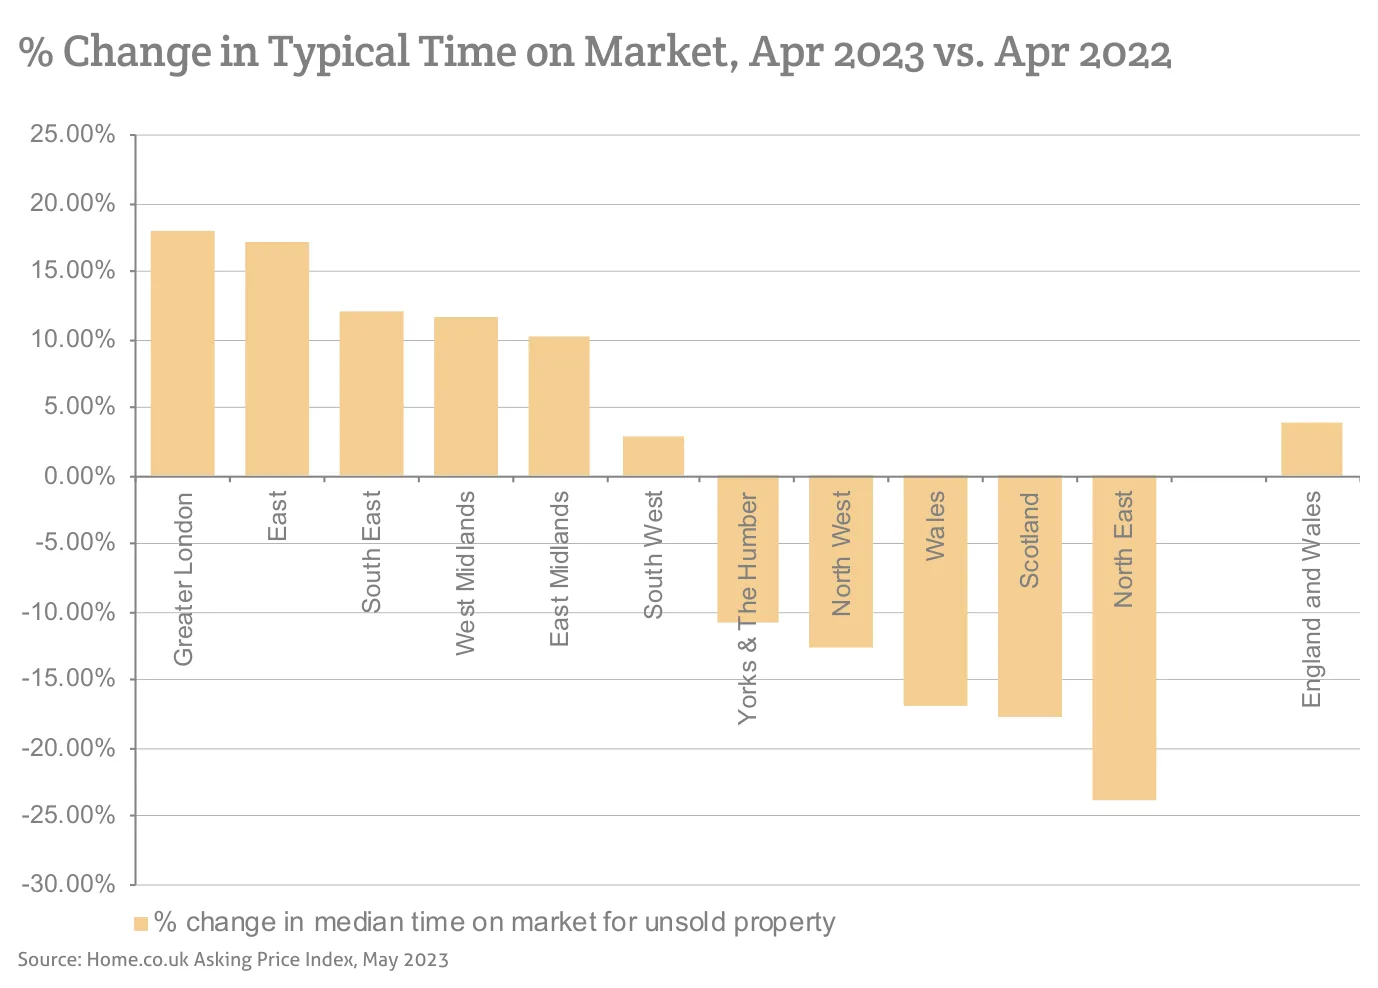
Source: Home.co.uk Asking Price Index, May 2023
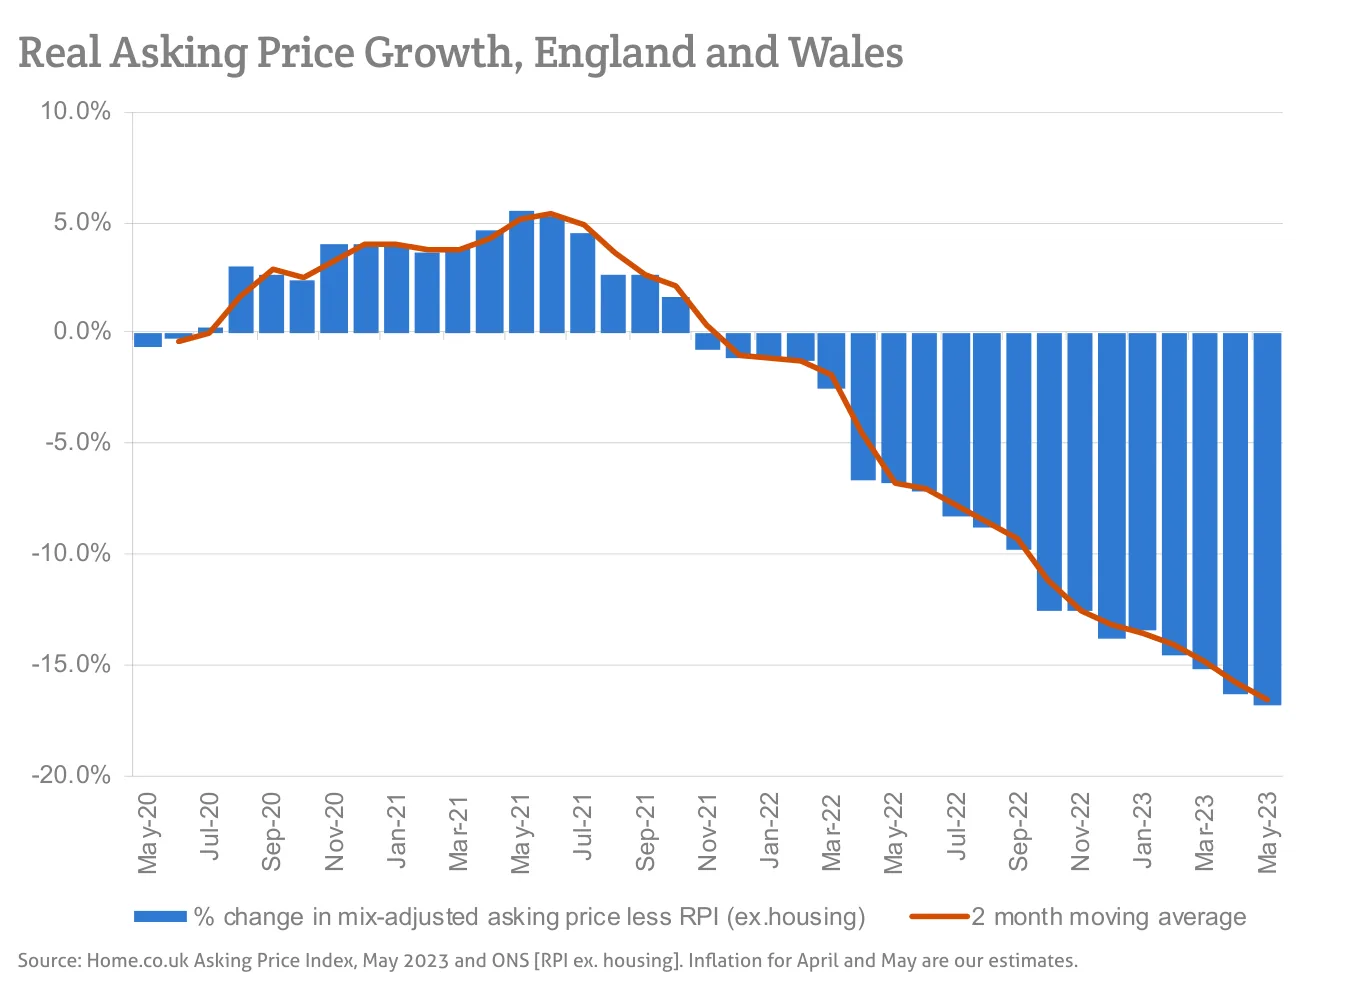
Source: Home.co.uk Asking Price Index, May 2023 and ONS [RPI ex. housing]. Inflation for April and May are our estimates.
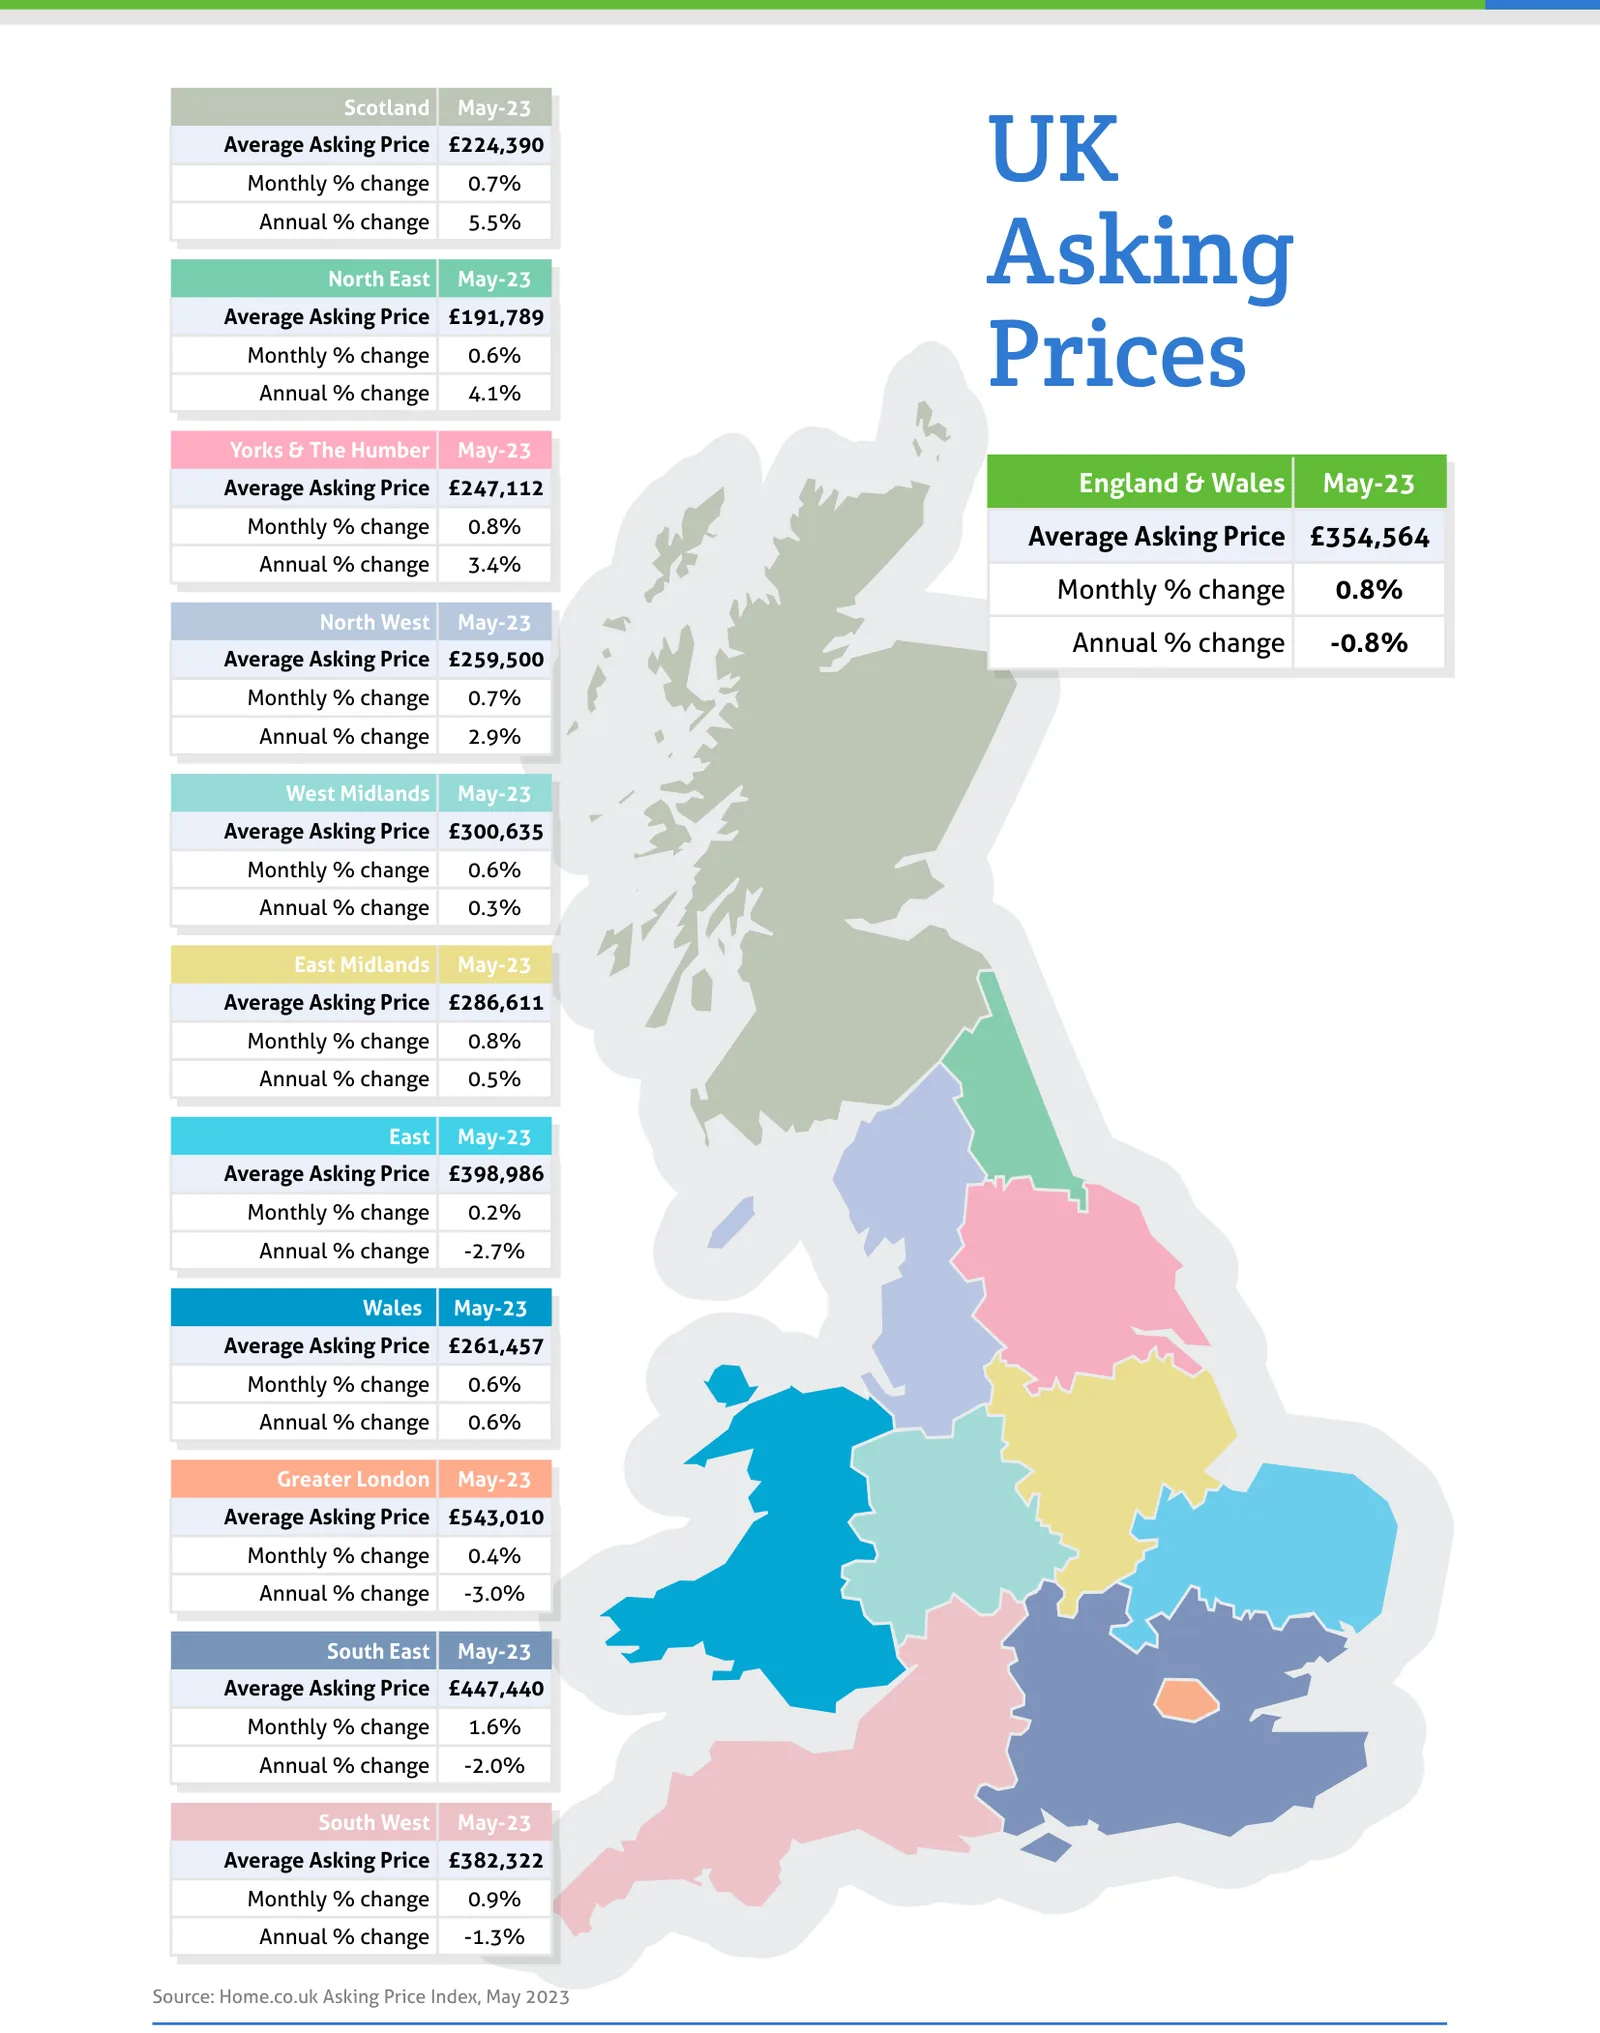
Source: Home.co.uk Asking Price Index, May 2023
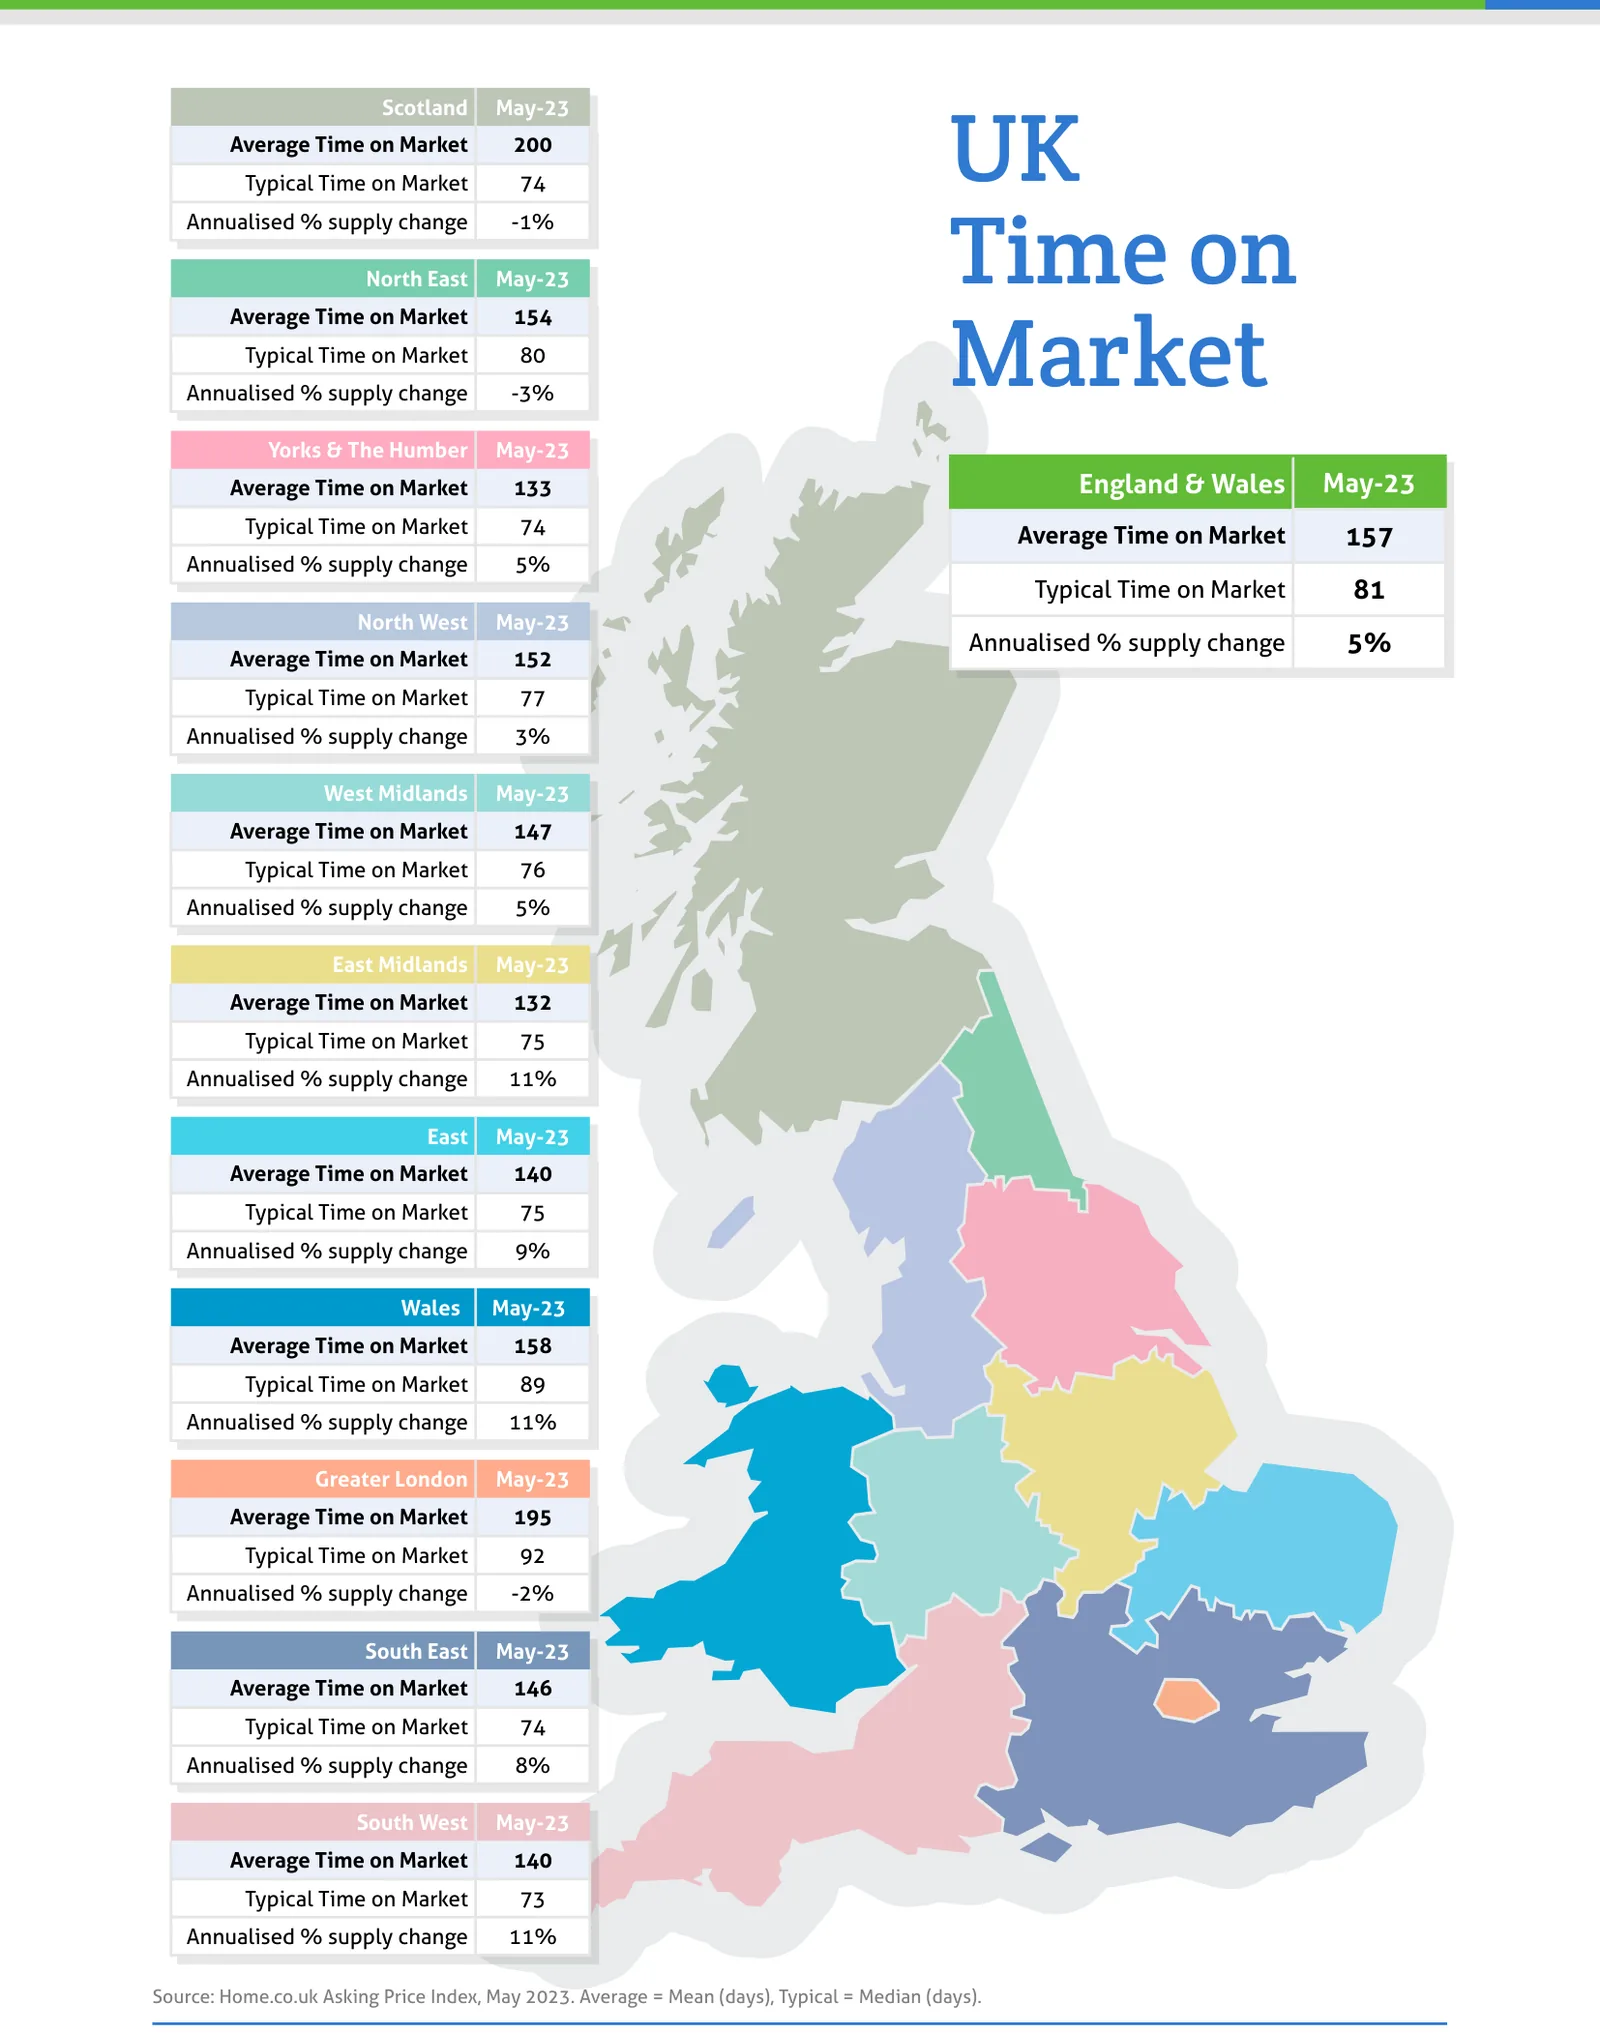
Source: Home.co.uk Asking Price Index, May 2023. Average = Mean (days), Typical = Median (days).
Regional tables
UK Asking Prices, May-23
| Region | Average Asking Price | Monthly % change | Annual % change |
|---|---|---|---|
| Scotland | £224,390 | 0.7% | 5.5% |
| North East | £191,789 | 0.6% | 4.1% |
| Yorks & The Humber | £247,112 | 0.8% | 3.4% |
| England & Wales | £354,564 | 0.8% | -0.8% |
| North West | £259,500 | 0.7% | 2.9% |
| West Midlands | £300,635 | 0.6% | 0.3% |
| East Midlands | £286,611 | 0.8% | 0.5% |
| East | £398,986 | 0.2% | -2.7% |
| Wales | £261,457 | 0.6% | 0.6% |
| Greater London | £543,010 | 0.4% | -3.0% |
| South East | £447,440 | 1.6% | -2.0% |
| South West | £382,322 | 0.9% | -1.3% |
UK Time on Market, May-23
| Region | Average Time on Market | Typical Time on Market | Annualised % supply change |
|---|---|---|---|
| Scotland | 200 | 74 | -1% |
| North East | 154 | 80 | -3% |
| Yorks & The Humber | 133 | 74 | 5% |
| England & Wales | 157 | 81 | 5% |
| North West | 152 | 77 | 3% |
| West Midlands | 147 | 76 | 5% |
| East Midlands | 132 | 75 | 11% |
| East | 140 | 75 | 9% |
| Wales | 158 | 89 | 11% |
| Greater London | 195 | 92 | -2% |
| South East | 146 | 74 | 8% |
| South West | 140 | 73 | 11% |
From the director's commentary
"This month's price hike presents a quite remarkable show of confidence among vendors and confirms that the market has adapted to changing credit conditions and is back to business as usual. Perhaps the doomsters in the media will be silenced for a while but somehow I doubt it."
Doug Shephard, Director at Home.co.uk
Read the full May 2023 edition (PDF, 10 pages)
About the Home Asking Price Index
The Home Asking Price Index measures the change in the prices sellers ask for residential property across England, Wales and Scotland. Today it is computed every month from around half a million advertised homes and is mix-adjusted, so a change in what happens to be on the market does not move the figure; earlier editions state the sample they were built from. Because an asking price is set months before a sale completes, the index runs around five months ahead of completed-sale measures such as the UK House Price Index.
Every edition in the archive, back to October 2006, is listed on the index page. How we measure the UK property market explains the listing data behind it, and today's figures by area are on house prices and rental prices.
Text and figures above are quoted from the May 2023 edition as published, with punctuation normalised for the web, and are not revised. Later editions may restate them.
More in What is happening to house prices: the Home guide
Thinking about your next move?
See what your home's worth in seconds, with the UK's longest-running property data behind it.
Get an instant valuation