

























Home Asking Price Index, May 2022: lack of stock pushes prices higher
Asking prices in England and Wales rose 1.3% in April, driven by a severe shortage of properties for sale and strong buyer demand.
This is the May 2022 edition of the Home Asking Price Index, released on 12 May 2022, under the headline:
Lack of Stock Pushes Prices Higher
The headlines and summary below are the report's own words, with the key figures as it published them, followed by the report's charts and regional tables as printed.
Headlines
- Asking prices across England and Wales jumped a further 1.3% overall in April, while the average price in Wales surged an incredible 2.7% month-on-month.
- Property continues to move through the market at an extraordinary pace due to vast buyer demand. Despite nudging up three days to 58 days (median) since last month, the Typical Time on Market for unsold property in England and Wales remains very low and is 18 days less than in May 2021.
- Supply problems worsened as vendors placed fewer properties on the UK market last month compared to April 2021 (-10%). The most significant supply drop is in London (-23%). No region indicated a year-on-year rise in supply.
- The total stock of property for sale in England and Wales nudged up for the fourth consecutive month but remains extremely low compared to historic levels.
- The South West property market now leads in annualised regional price growth (+10.5%), narrowly ahead of Wales (+9.3%).
- Rents in Greater London continue to skyrocket. Increasing scarcity of available properties to let has pushed up annualised rental growth to an eye-watering 37.1%. Supply of rental property in the capital is still falling.
- Asking rent growth across the UK currently stands at 18.3% year-on-year.
- Central London rents continue to skyrocket as supply plummets. Aside from the City (+64%), the greatest rises in asking rents over the last twelve months are in Kensington (+53%) and Westminster (+43%).
Summary
Exceptional vigour and vitality persist in the UK property market, despite many challenges both foreign and domestic. Prices continue to rise rapidly across all regions driven by considerable demand and an extreme scarcity of property for sale. Moreover, the supply of new instructions entering the market appears to be in decline.
The data shows that the 2022 UK property market continues to perform strongly in all regions. Despite much higher prices, Typical Time on Market of unsold property remains just above record lows, confirming that property is still moving through the market at a really rapid pace. For example, Typical Time on Market for the East Midlands has moved up slightly but remains at a level not seen since the buying frenzy of 2007 before the onset of the financial crisis. In fact, such is the strength of current demand that the median Time on Market for unsold property in England and Wales is currently 24% lower than May last year when the market was already showing clear signs of overheating.
Key figures
| Measure | Figure |
|---|---|
| Monthly change in asking prices (England and Wales) | +1.3% |
| Annualised asking price growth (England and Wales) | +6.6% |
| Typical Time on Market | 58 days |
| Reduction in Time on Market vs May 2021 | -24% |
| Change in supply vs April 2021 (UK) | -10% |
| Annual asking rent growth (UK) | +18.3% |
| Fall in average stock total year-on-year | -18% |
Figures are for England and Wales unless the report states otherwise, as published in the edition.
Charts from the report
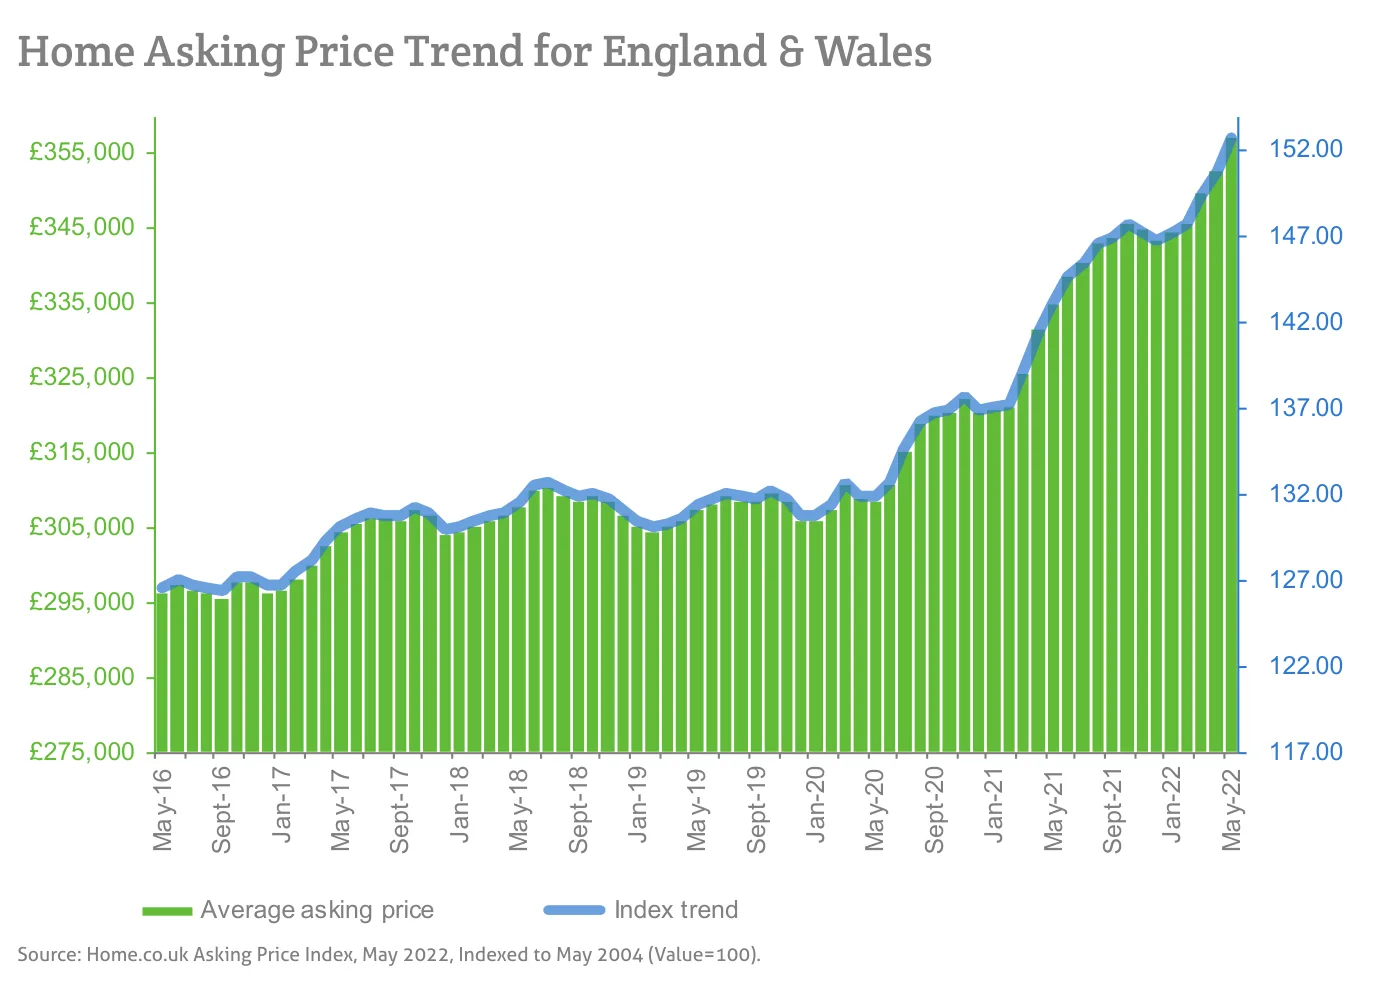
Source: Home.co.uk Asking Price Index, May 2022, Indexed to May 2004 (Value=100).
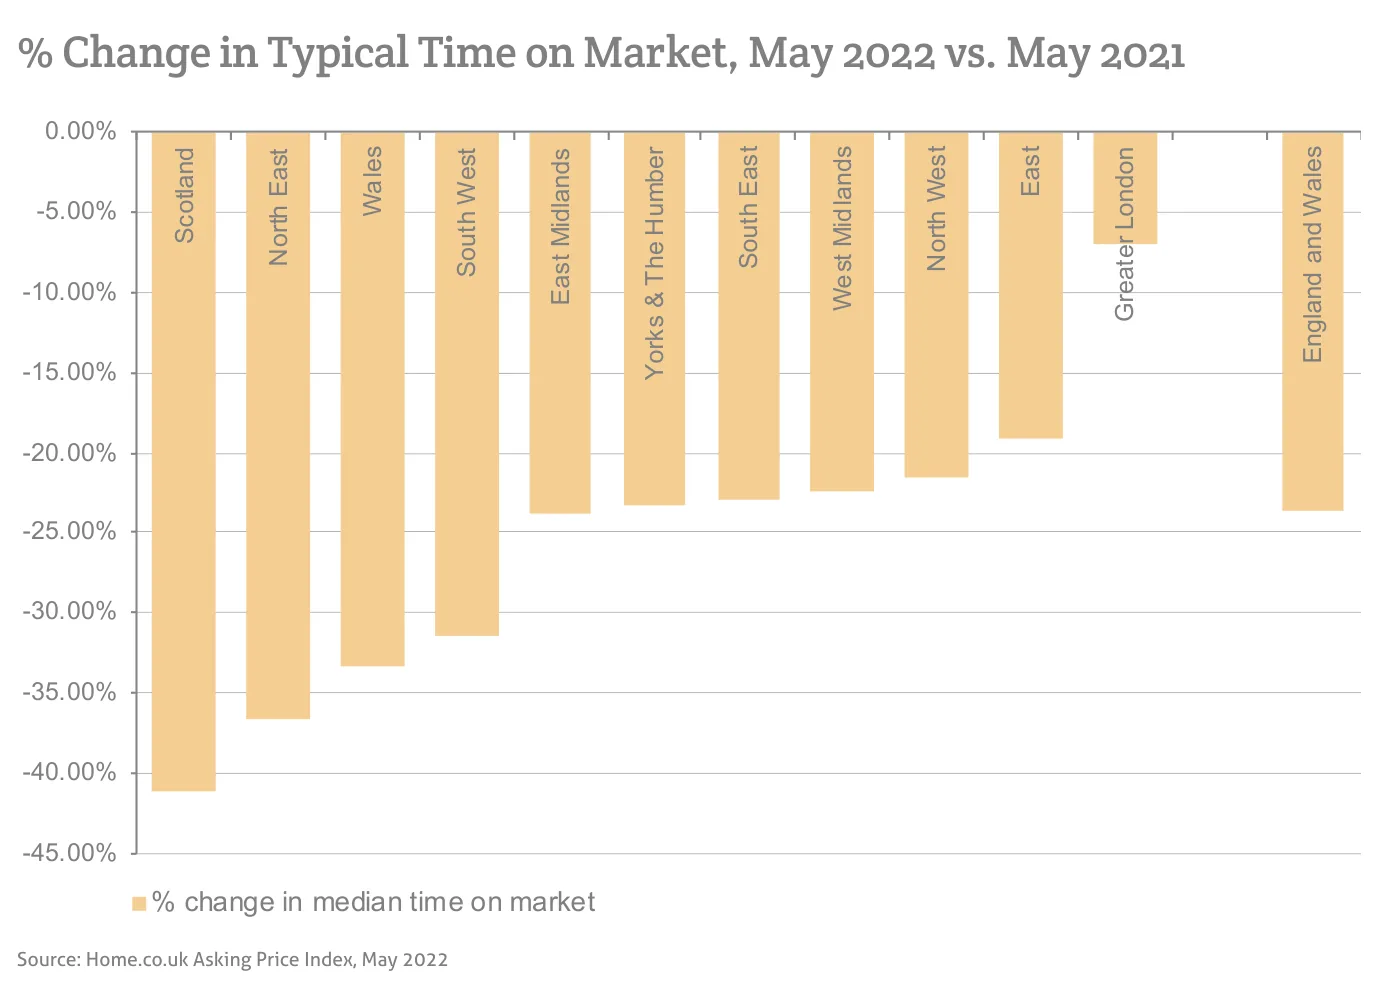
Source: Home.co.uk Asking Price Index, May 2022
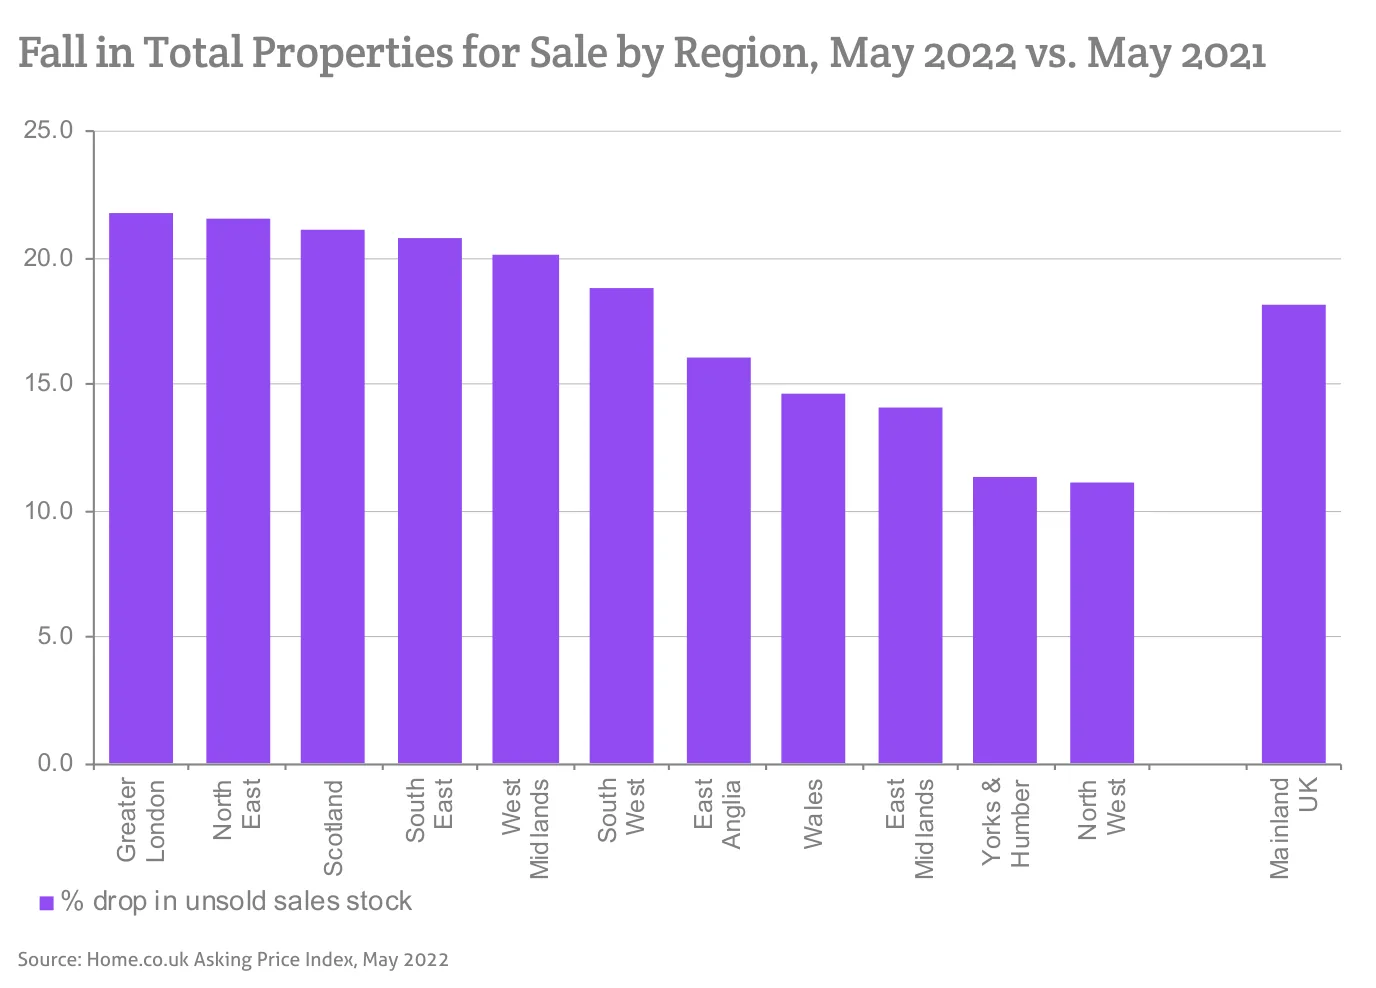
Source: Home.co.uk Asking Price Index, May 2022
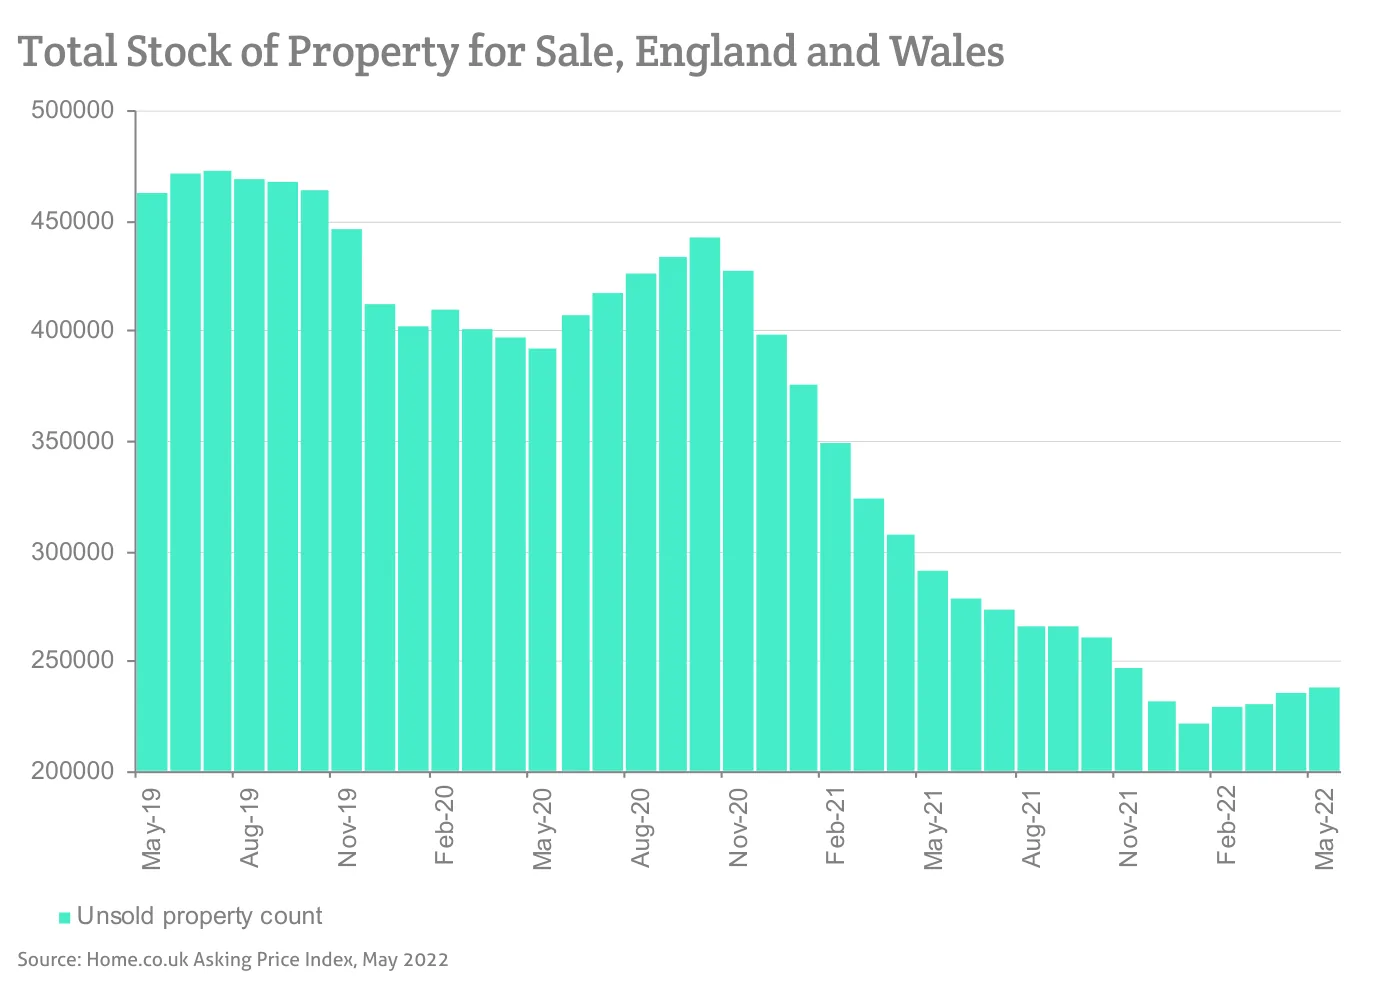
Source: Home.co.uk Asking Price Index, May 2022
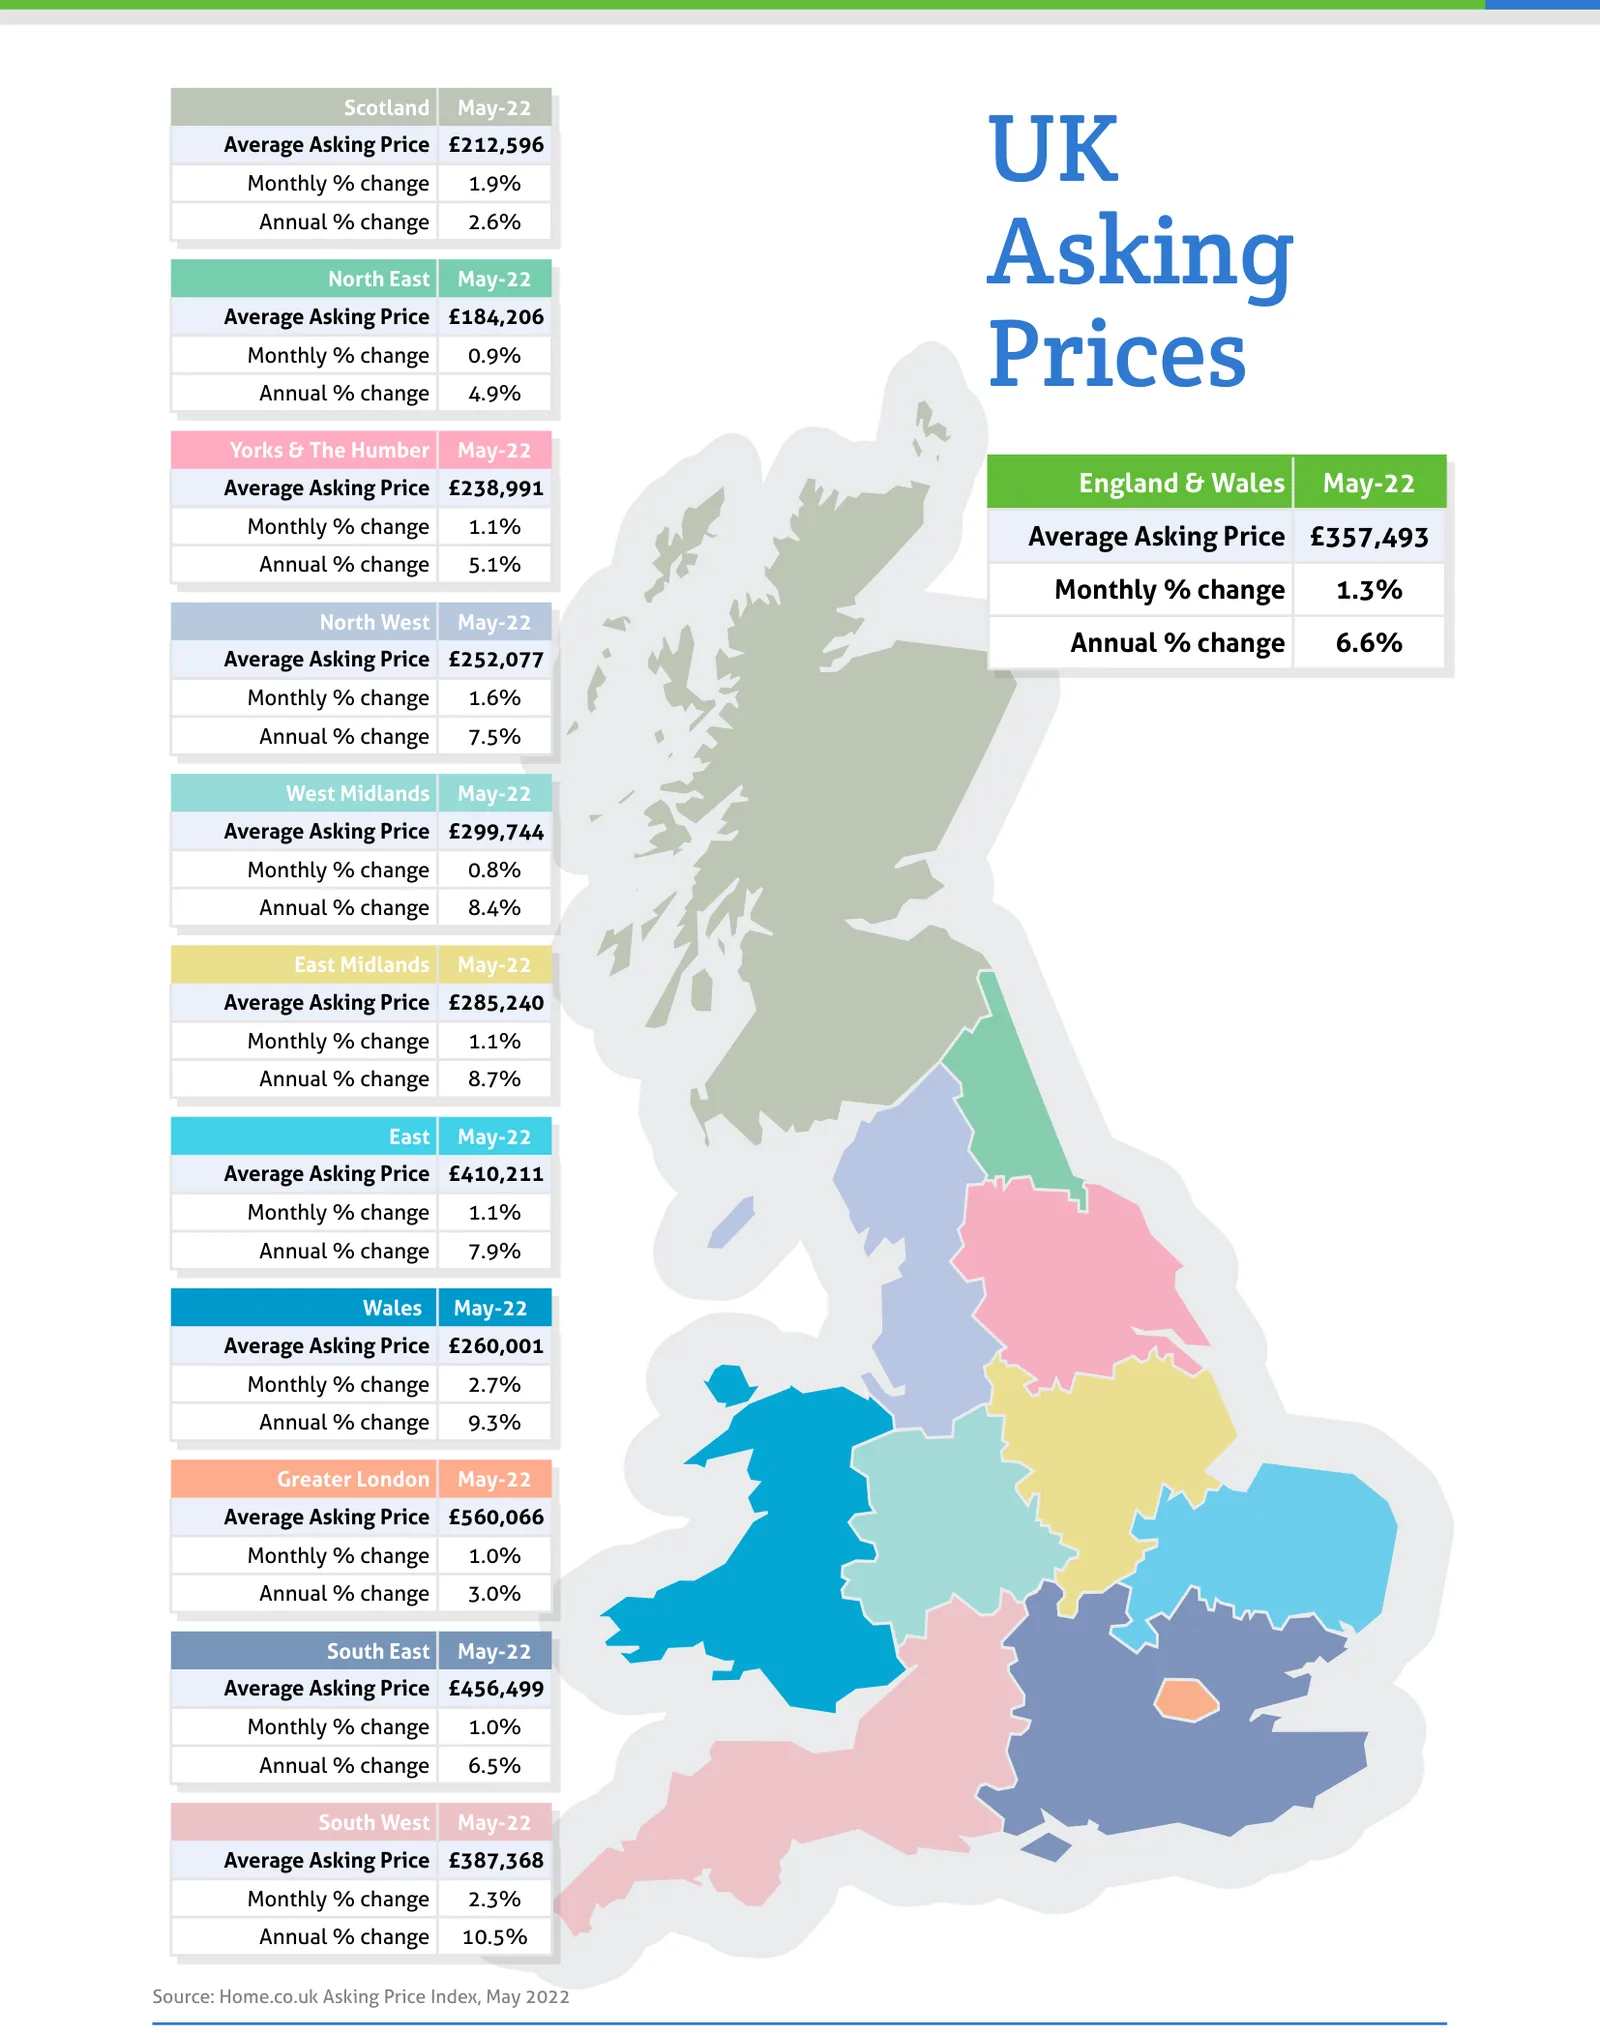
Source: Home.co.uk Asking Price Index, May 2022
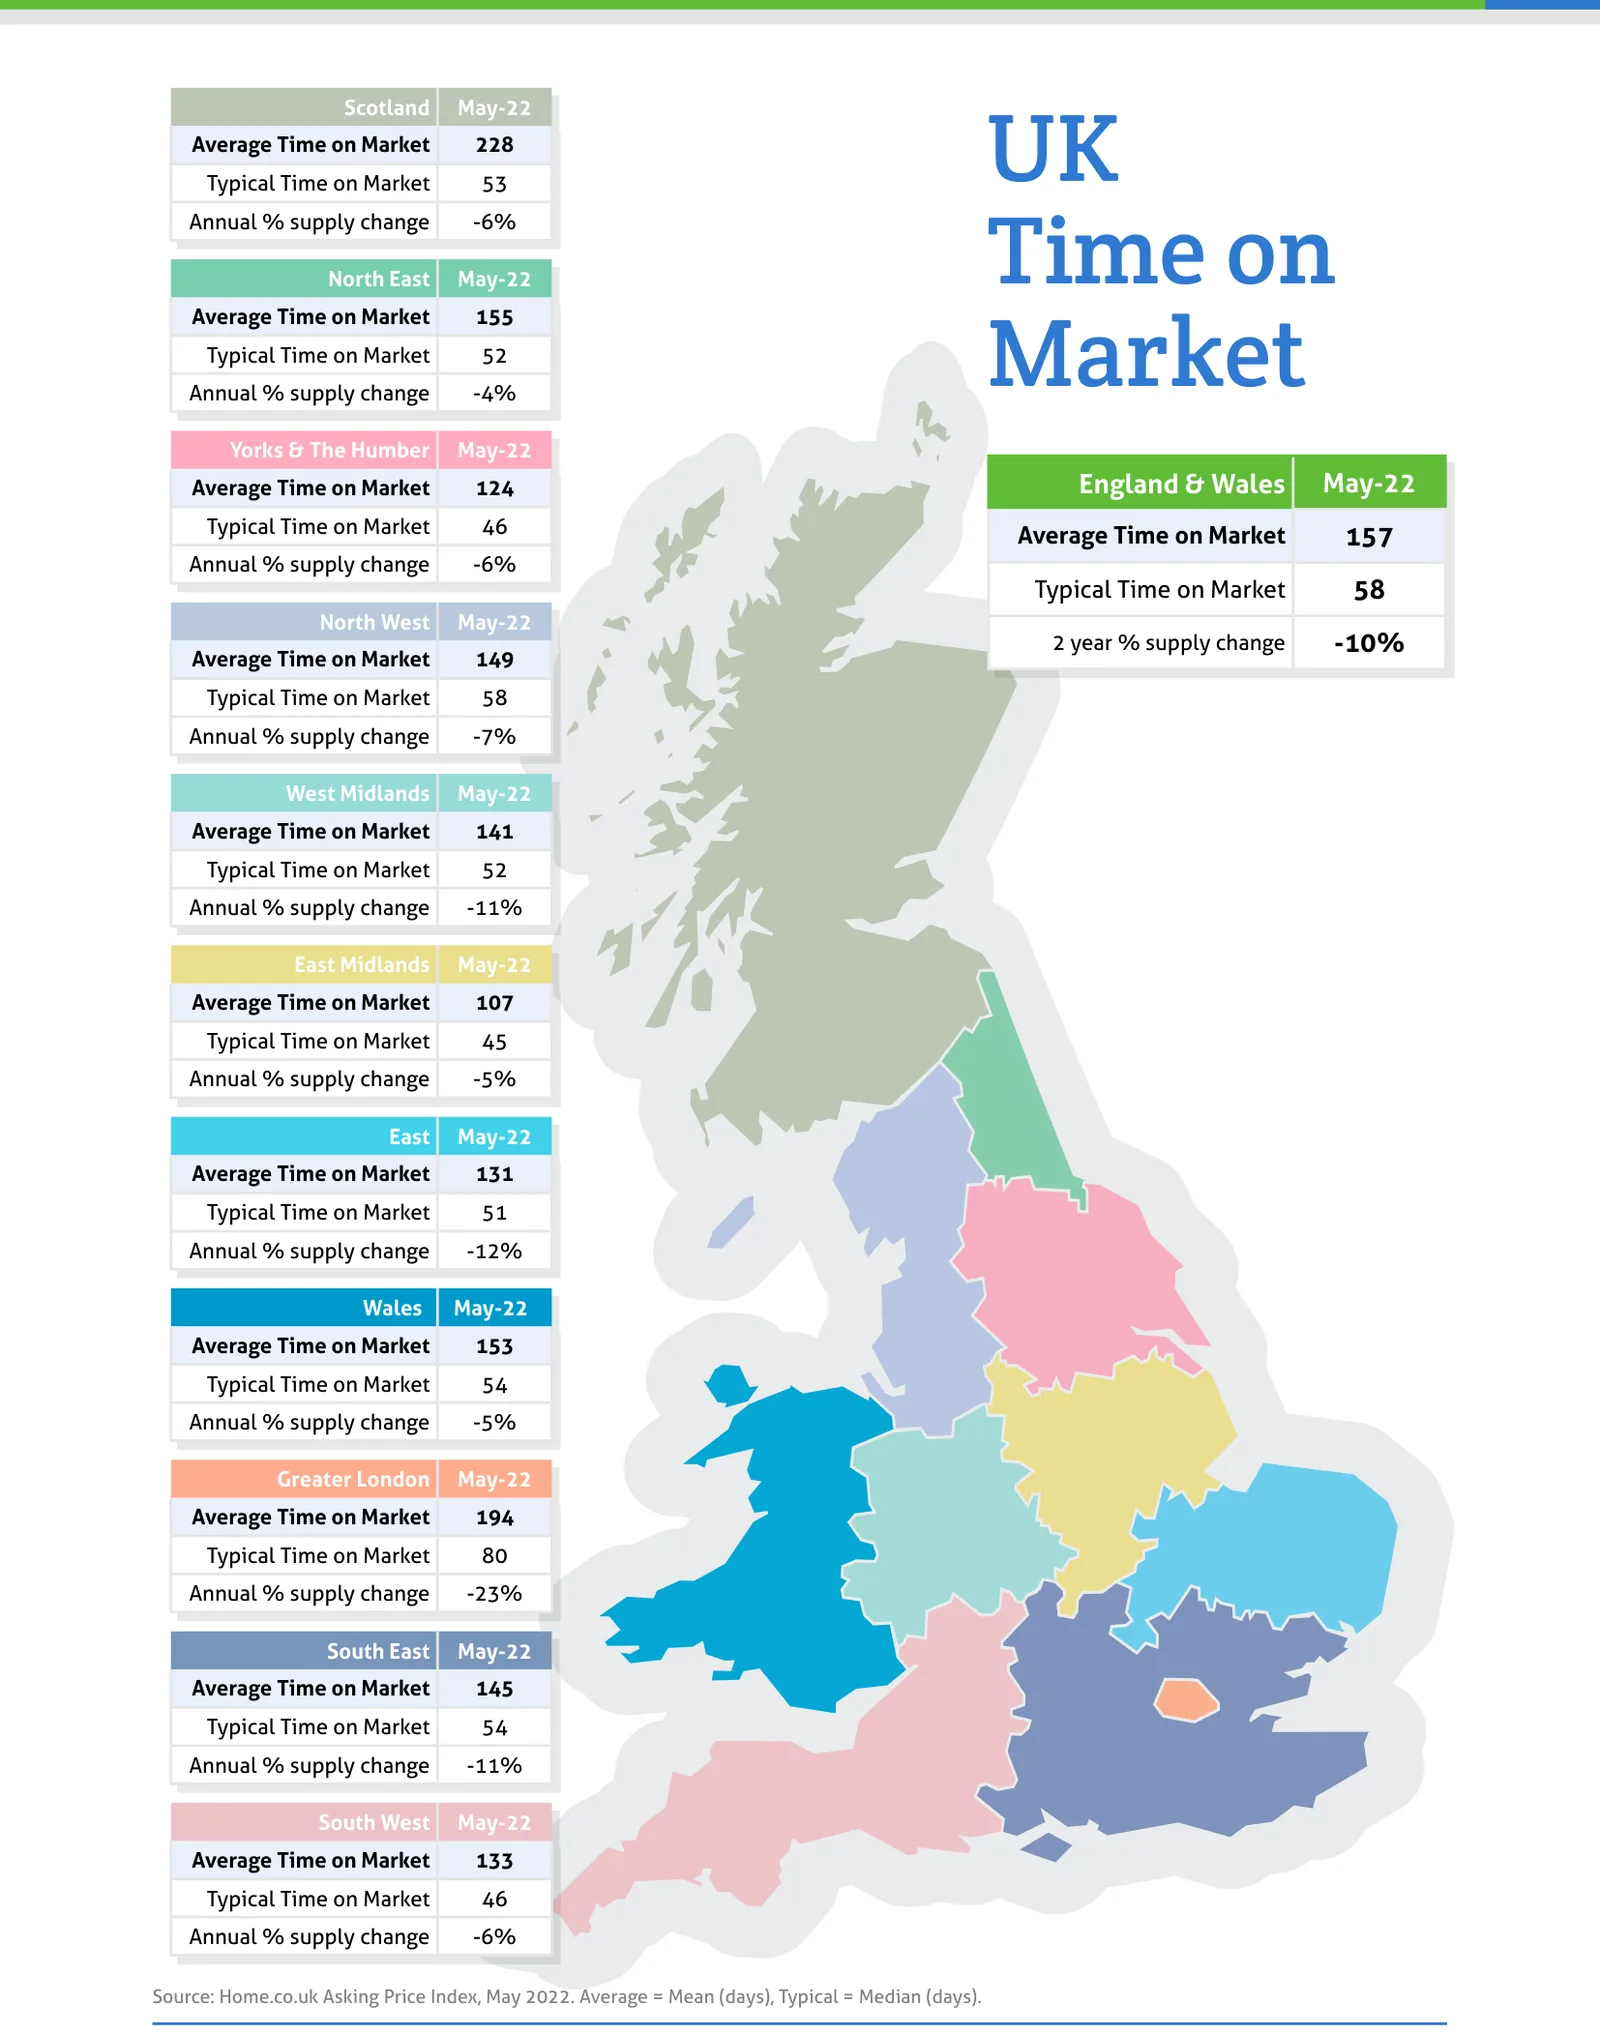
Source: Home.co.uk Asking Price Index, May 2022. Average = Mean (days), Typical = Median (days).
Regional tables
UK Asking Prices, May-22
| Region | Average Asking Price | Monthly % change | Annual % change |
|---|---|---|---|
| Scotland | £212,596 | 1.9% | 2.6% |
| North East | £184,206 | 0.9% | 4.9% |
| Yorks & The Humber | £238,991 | 1.1% | 5.1% |
| England & Wales | £357,493 | 1.3% | 6.6% |
| North West | £252,077 | 1.6% | 7.5% |
| West Midlands | £299,744 | 0.8% | 8.4% |
| East Midlands | £285,240 | 1.1% | 8.7% |
| East | £410,211 | 1.1% | 7.9% |
| Wales | £260,001 | 2.7% | 9.3% |
| Greater London | £560,066 | 1.0% | 3.0% |
| South East | £456,499 | 1.0% | 6.5% |
| South West | £387,368 | 2.3% | 10.5% |
UK Time on Market, May-22
| Region | Average Time on Market | Typical Time on Market | Annual % supply change |
|---|---|---|---|
| Scotland | 228 | 53 | -6% |
| North East | 155 | 52 | -4% |
| Yorks & The Humber | 124 | 46 | -6% |
| England & Wales | 157 | 58 | |
| North West | 149 | 58 | -7% |
| West Midlands | 141 | 52 | -11% |
| East Midlands | 107 | 45 | -5% |
| East | 131 | 51 | -12% |
| Wales | 153 | 54 | -5% |
| Greater London | 194 | 80 | -23% |
| South East | 145 | 54 | -11% |
| South West | 133 | 46 | -6% |
The report also prints '2 year % supply change' in 1 of its 12 region boxes (England & Wales -10%), so it is not a column of this table.
Read the full May 2022 edition (PDF, 9 pages)
About the Home Asking Price Index
The Home Asking Price Index measures the change in the prices sellers ask for residential property across England, Wales and Scotland. Today it is computed every month from around half a million advertised homes and is mix-adjusted, so a change in what happens to be on the market does not move the figure; earlier editions state the sample they were built from. Because an asking price is set months before a sale completes, the index runs around five months ahead of completed-sale measures such as the UK House Price Index.
Every edition in the archive, back to October 2006, is listed on the index page. How we measure the UK property market explains the listing data behind it, and today's figures by area are on house prices and rental prices.
Text and figures above are quoted from the May 2022 edition as published, with punctuation normalised for the web, and are not revised. Later editions may restate them.
More in What is happening to house prices: the Home guide
Thinking about your next move?
See what your home's worth in seconds, with the UK's longest-running property data behind it.
Get an instant valuation