

























Home Asking Price Index, May 2020: collapse in supply of new instructions
New sales instructions across the UK fell 85% year-on-year while average asking prices in England and Wales slipped just 0.1% month-on-month.
This is the May 2020 edition of the Home Asking Price Index, released on 13 May 2020, under the headline:
Collapse in Supply of New Instructions
The headlines and summary below are the report's own words, with the key figures as it published them, followed by the report's charts and regional tables as printed.
Headlines
- Collapse in supply of new sales instructions across the UK (down an extraordinary 85% year-on-year) as the pandemic halts activity.
- The largest regional fall in the number of new instructions year-on-year is in Scotland, followed by East Anglia, the South East and the South West.
- While supply and demand are both on hold, home prices slipped just 0.1% month-on-month.
- Both the median and mean Time on Market for unsold sales properties in England and Wales are soaring in an unprecedented manner.
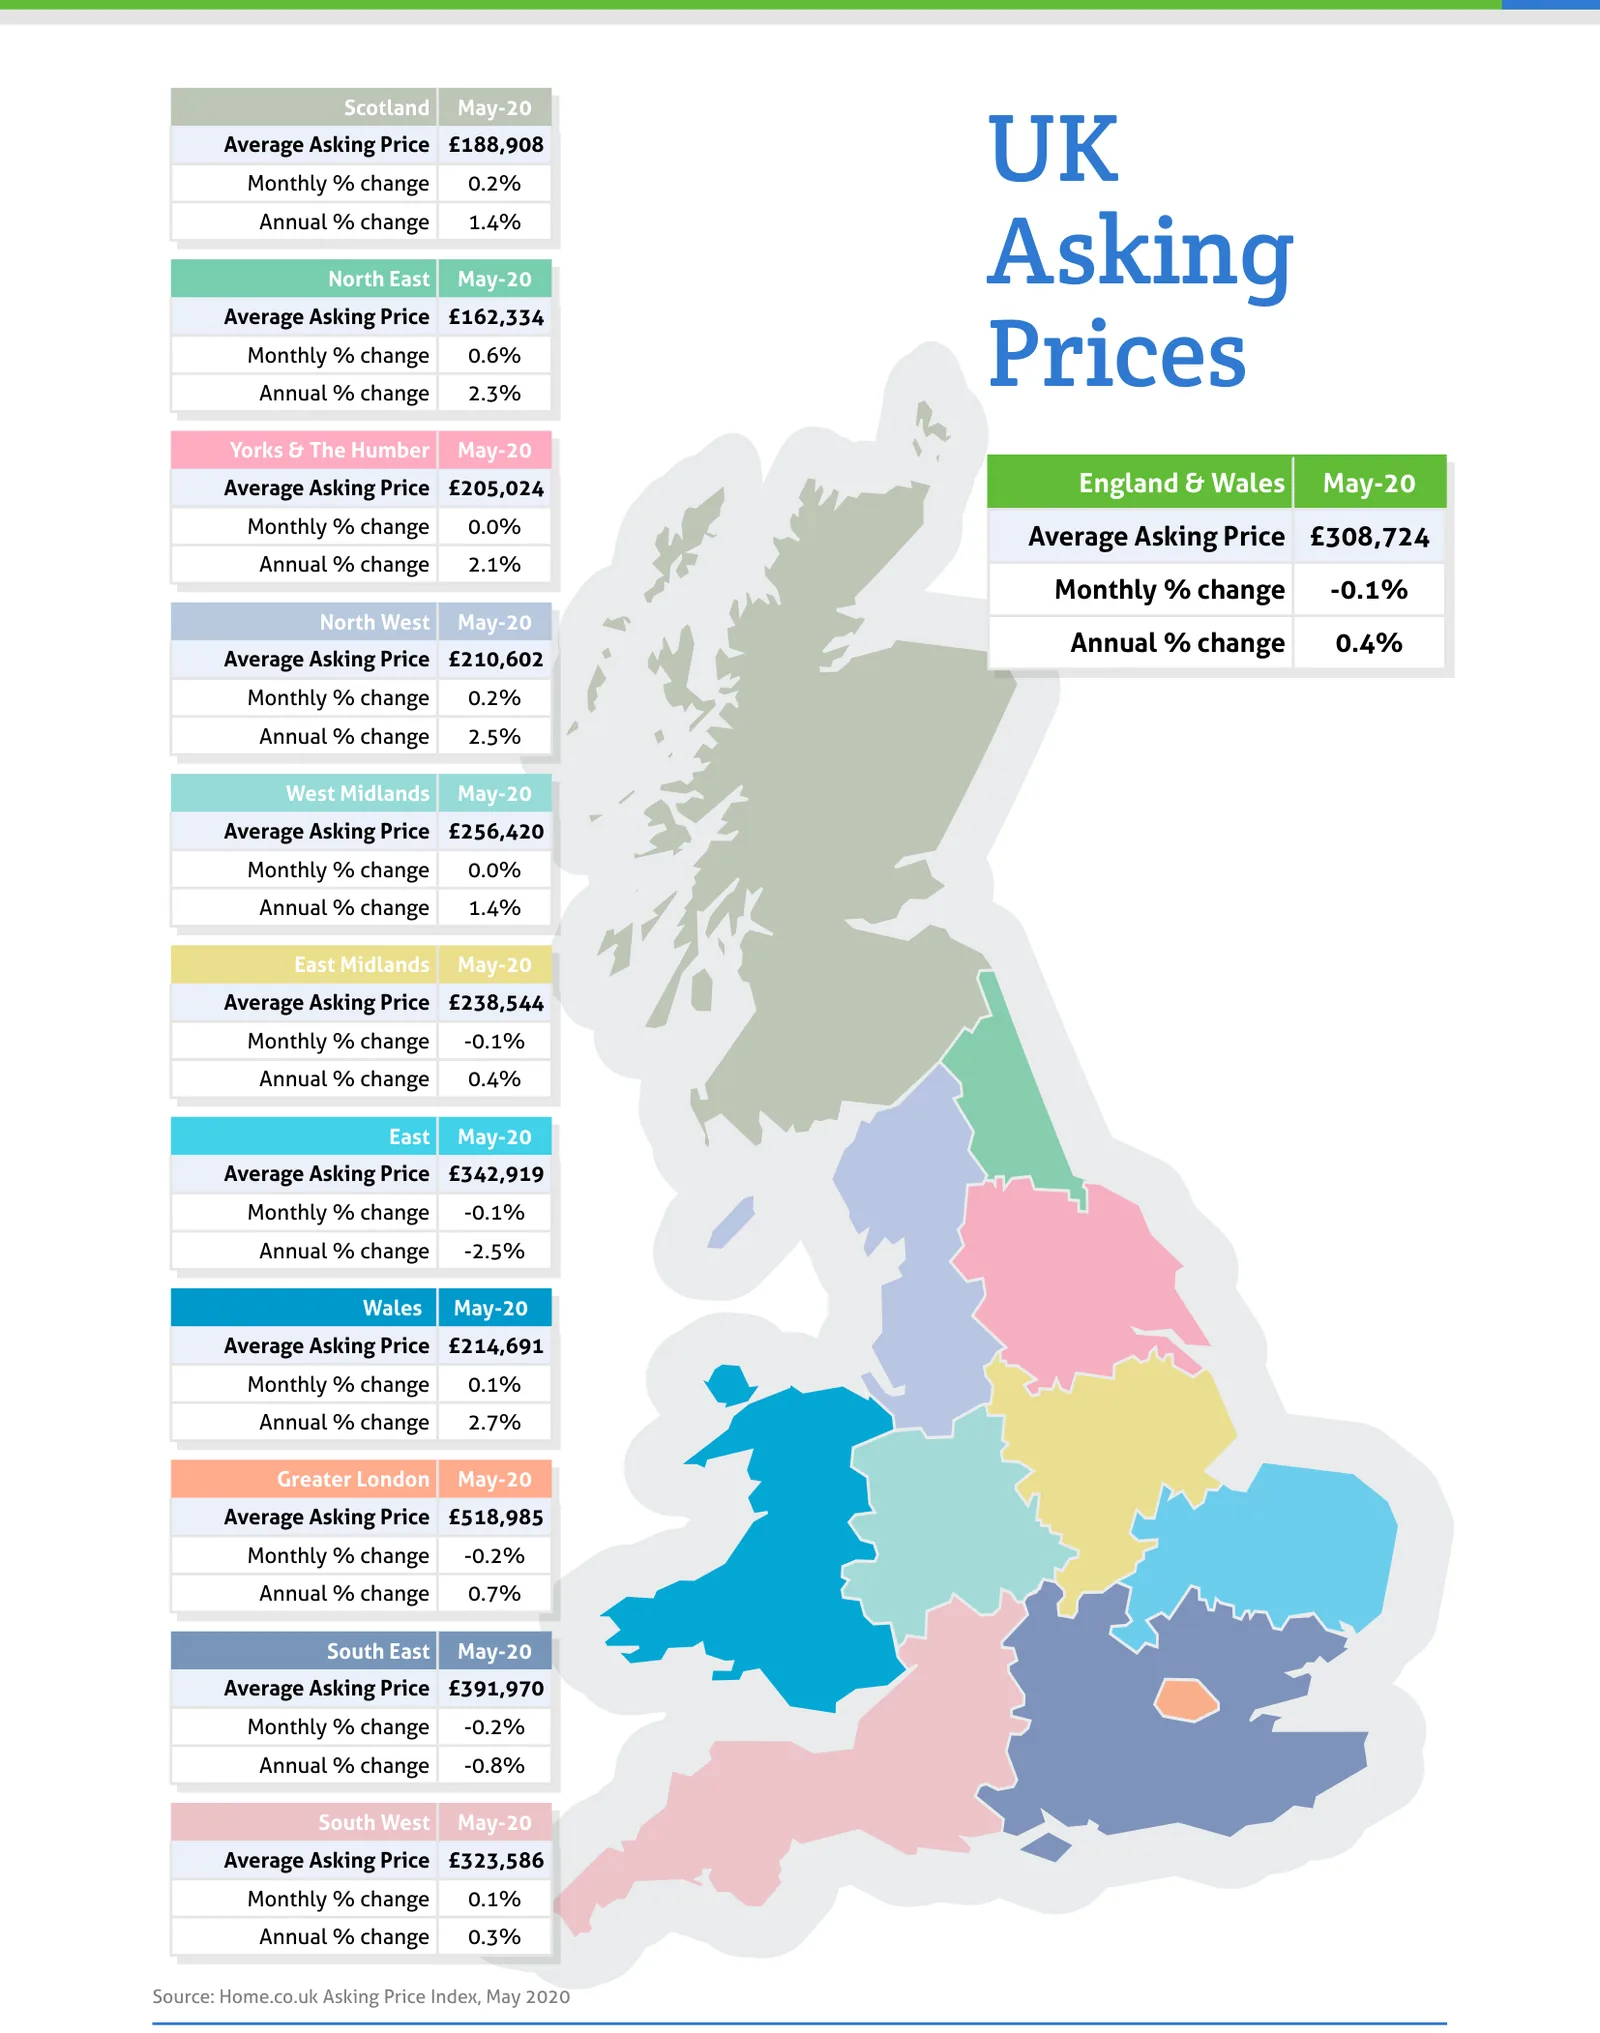
- Despite the pandemic, the best-performing regions, the North West, North East, Yorkshire and Wales - still show year-on-year price growth broadly in line with monetary inflation.
- The total sales stock on the market across England and Wales continues to melt away; down by 15.3% year-on-year, part of a longer-term trend.
- East of England remains the UK's worst-performing region with the average asking price 2.5% lower than twelve months ago.
- Already low, the supply in the rental sector across the UK has plummeted by 50% year-on-year.
- The trend of soaring rents in Greater London appears to have ceased for the time being although some boroughs, such as Hackney, still show double-digit rises over the last twelve months.
Summary
The measures imposed to curb the spread of the COVID-19 virus have devastated the housing market. The closure of estate agent offices has meant that new listings effectively ceased last month. Prices have dipped a little but such movements in these troubled times are essentially meaningless when the market is basically frozen. Forecasts of falling prices are simply more doom and gloom. All eyes are looking to when the restrictions are lifted…
Low and falling stock levels also characterised the Private Rented Sector (PRS) pre-pandemic, but it was more severe than in the sales market. We expect this to remain the case and for demand to soar once the restrictions are lifted. The lettings market had 50% less new rentals entering the market in April than in April 2019. This squeeze in supply will likely have a dramatic upward effect on rents going forward. Currently, the mix-adjusted average rent is 4.1% higher than it was a year ago.
The UK property market began the year in good shape and showed considerable potential for growth. Hence we expect that, when the coronavirus restrictions are lifted, significant activity will return although demand will certainly be tempered by the economic damage sustained by the lockdown. The most difficult question to answer is 'How strong will the rebound be?'
Key figures
| Measure | Figure |
|---|---|
| Average asking price (England & Wales) | £308,724 |
| Monthly change (England & Wales) | -0.1% |
| Annual change (England & Wales) | 0.4% |
| New instructions change (UK, year-on-year) | -85% |
| Total sales stock change (England & Wales, year-on-year) | -15.3% |
| Rental supply change (UK, year-on-year) | -50% |
| Average rent change (UK, year-on-year) | +4.1% |
Figures are for England and Wales unless the report states otherwise, as published in the edition.
Charts from the report
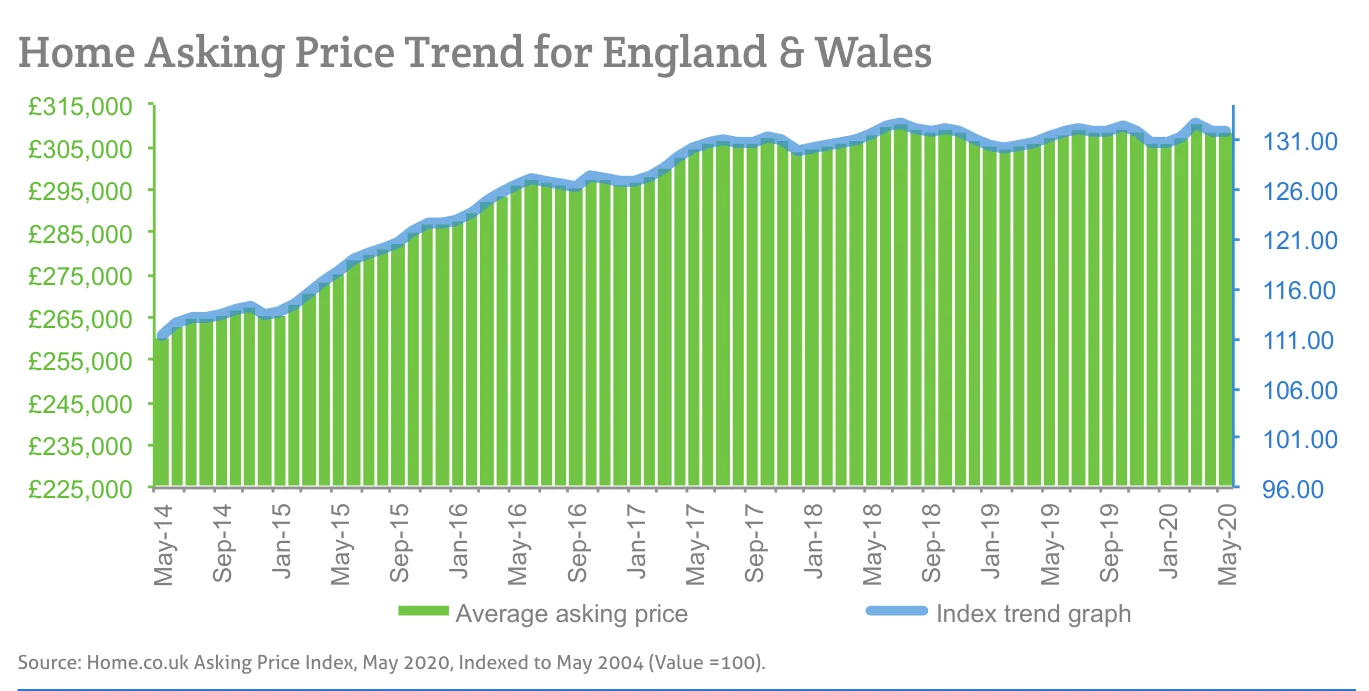
Source: Home.co.uk Asking Price Index, May 2020, Indexed to May 2004 (Value =100).
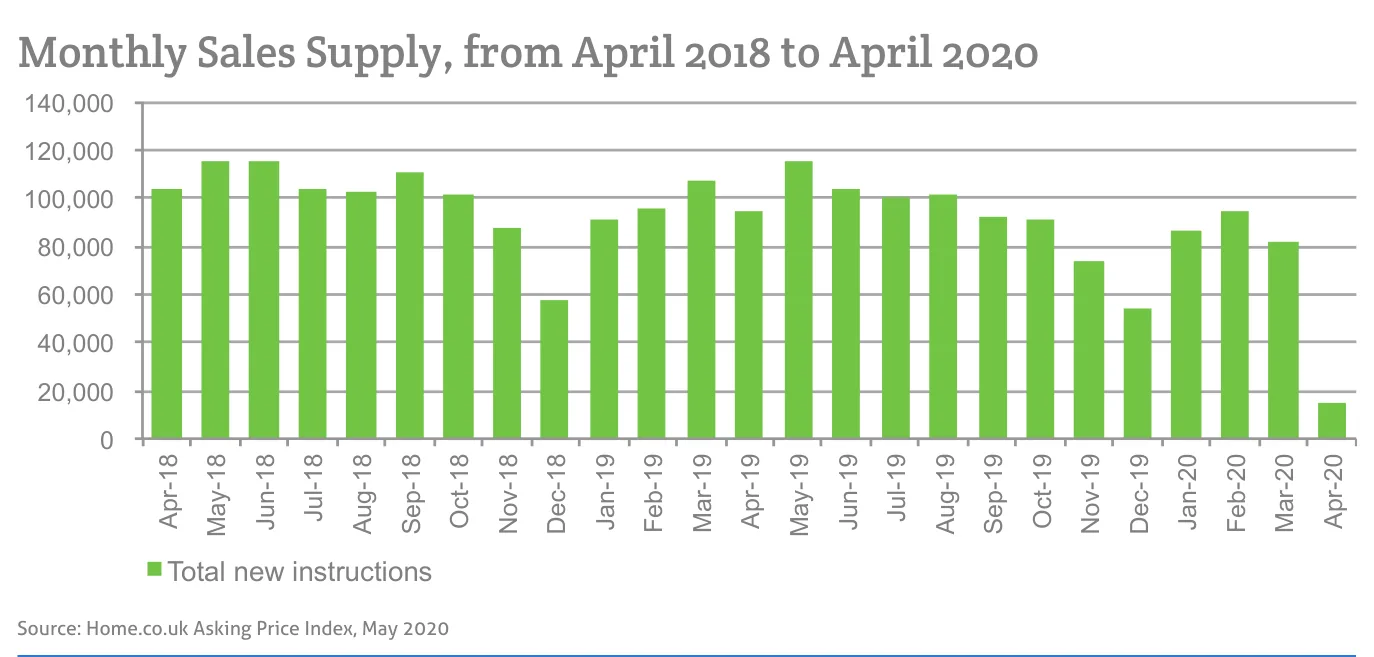
Source: Home.co.uk Asking Price Index, May 2020
Source: Home.co.uk Asking Price Index, May 2020
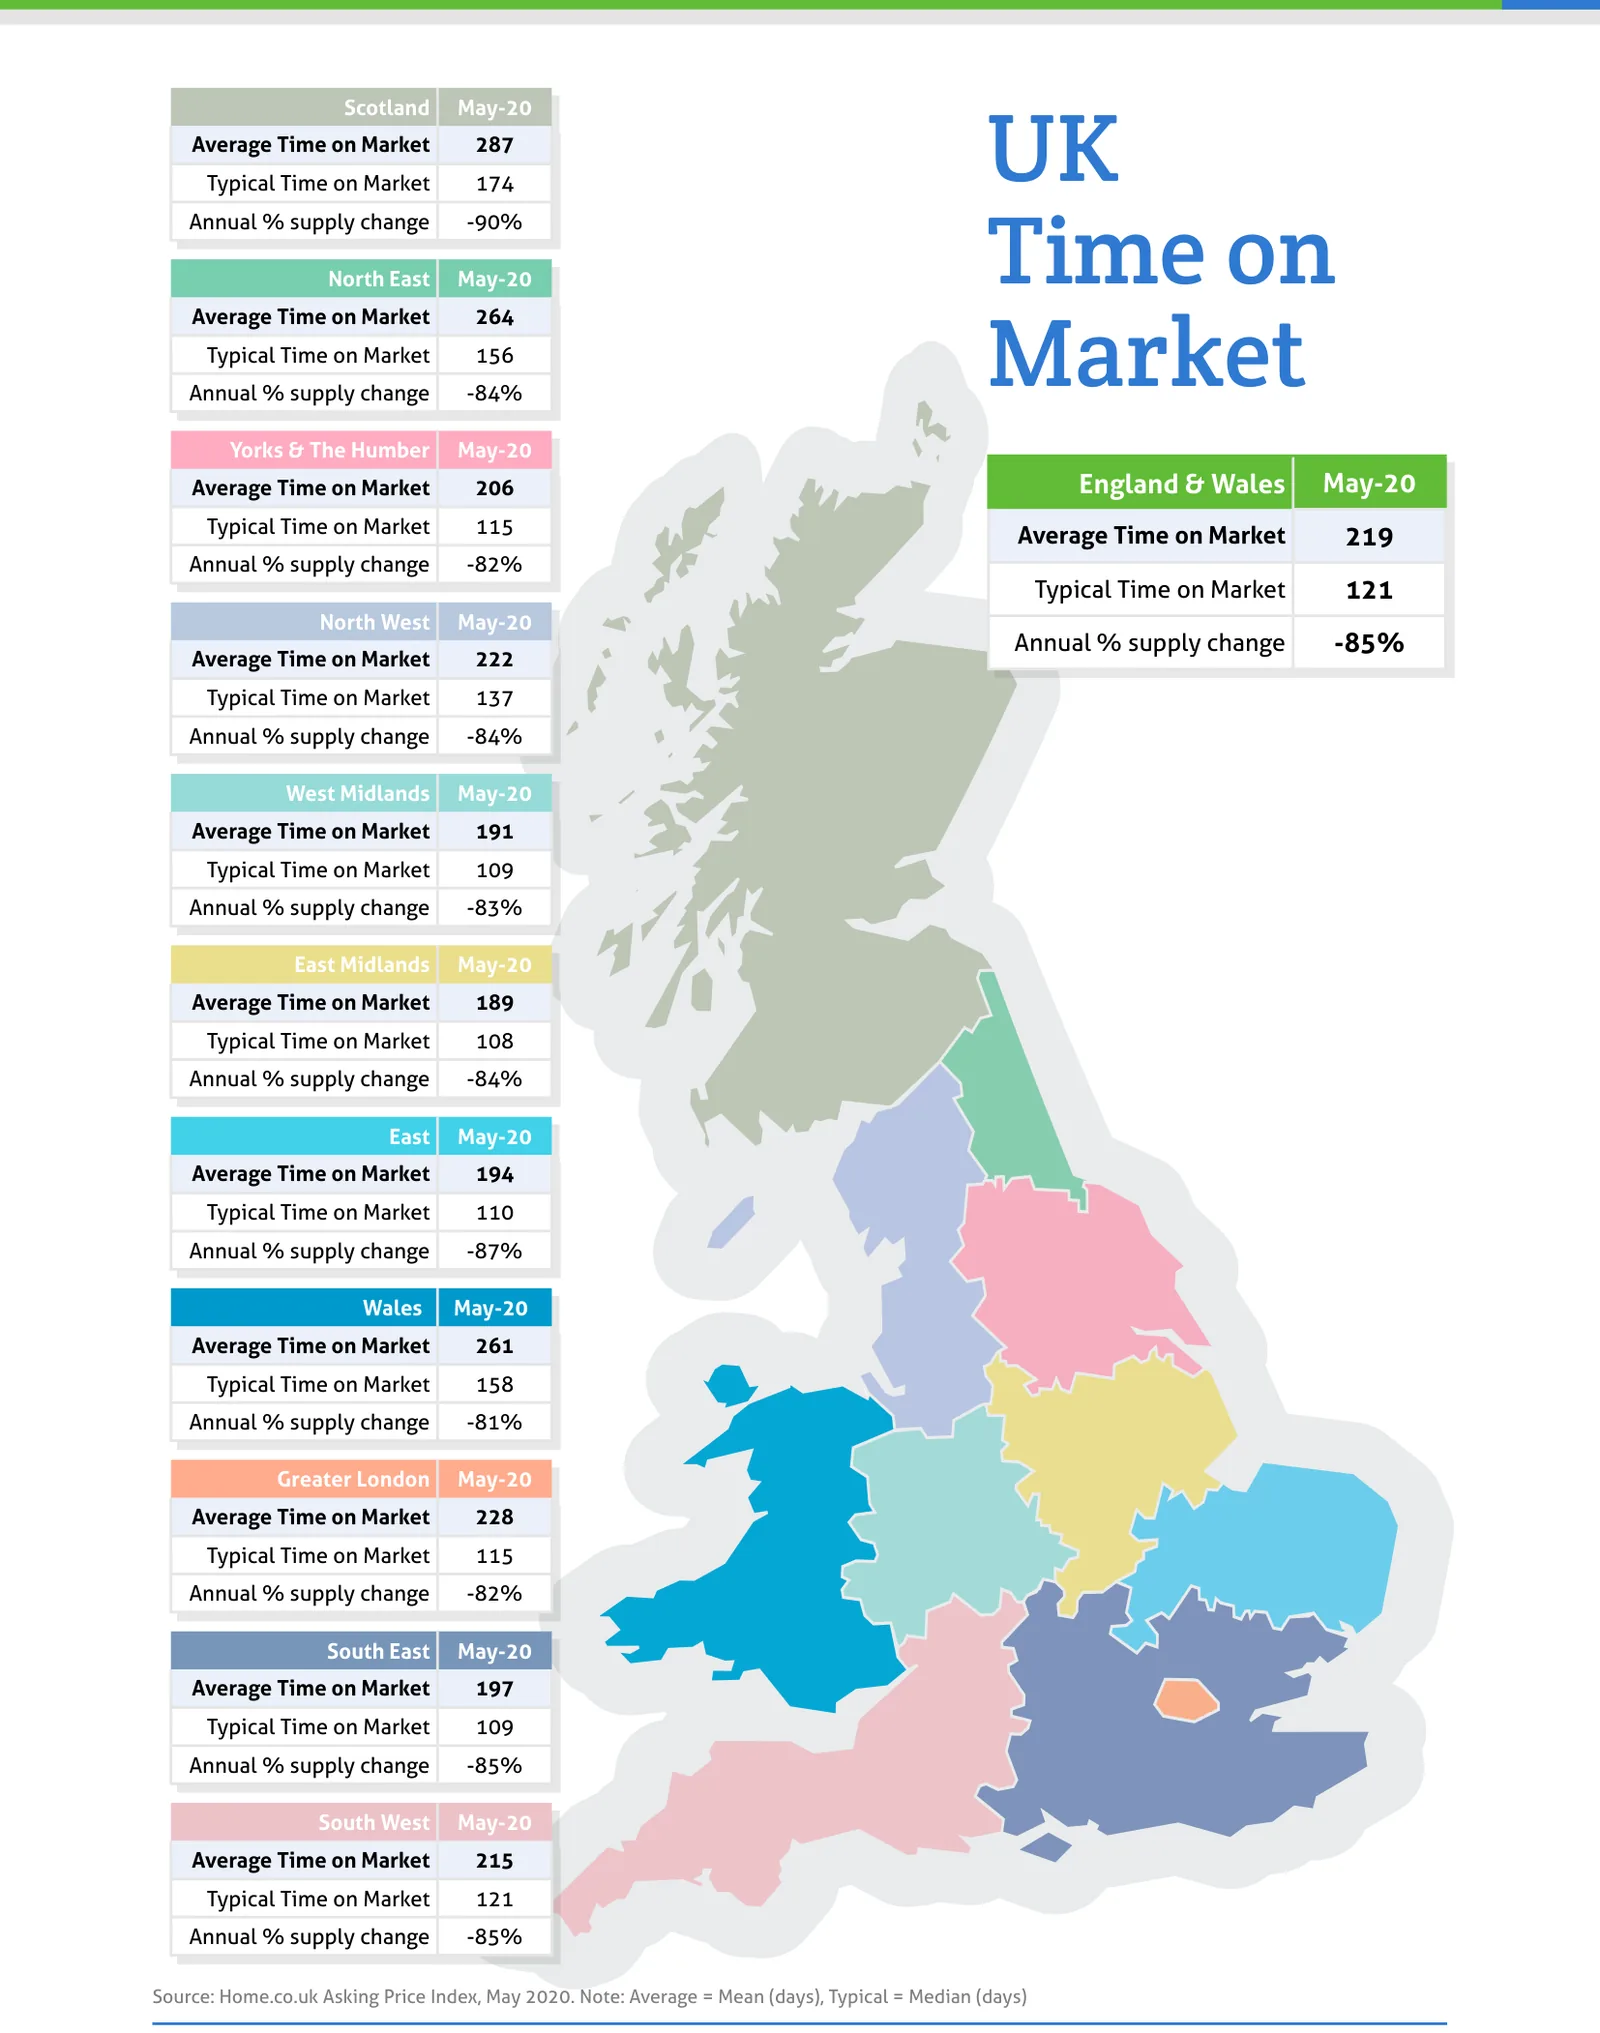
Source: Home.co.uk Asking Price Index, May 2020. Note: Average = Mean (days), Typical = Median (days)
Regional tables
UK Asking Prices, May-20
| Region | Average Asking Price | Monthly % change | Annual % change |
|---|---|---|---|
| Scotland | £188,908 | 0.2% | 1.4% |
| North East | £162,334 | 0.6% | 2.3% |
| Yorks & The Humber | £205,024 | 0.0% | 2.1% |
| England & Wales | £308,724 | -0.1% | 0.4% |
| North West | £210,602 | 0.2% | 2.5% |
| West Midlands | £256,420 | 0.0% | 1.4% |
| East Midlands | £238,544 | -0.1% | 0.4% |
| East | £342,919 | -0.1% | -2.5% |
| Wales | £214,691 | 0.1% | 2.7% |
| Greater London | £518,985 | -0.2% | 0.7% |
| South East | £391,970 | -0.2% | -0.8% |
| South West | £323,586 | 0.1% | 0.3% |
UK Time on Market, May-20
| Region | Average Time on Market | Typical Time on Market | Annual % supply change |
|---|---|---|---|
| Scotland | 287 | 174 | -90% |
| North East | 264 | 156 | -84% |
| Yorks & The Humber | 206 | 115 | -82% |
| England & Wales | 219 | 121 | -85% |
| North West | 222 | 137 | -84% |
| West Midlands | 191 | 109 | -83% |
| East Midlands | 189 | 108 | -84% |
| East | 194 | 110 | -87% |
| Wales | 261 | 158 | -81% |
| Greater London | 228 | 115 | -82% |
| South East | 197 | 109 | -85% |
| South West | 215 | 121 | -85% |
From the director's commentary
"I'm in the rather unusual position of writing about a property market that, for the time being, does not exist."
Doug Shephard, Director at Home.co.uk
Read the full May 2020 edition (PDF, 6 pages)
About the Home Asking Price Index
The Home Asking Price Index measures the change in the prices sellers ask for residential property across England, Wales and Scotland. Today it is computed every month from around half a million advertised homes and is mix-adjusted, so a change in what happens to be on the market does not move the figure; earlier editions state the sample they were built from. Because an asking price is set months before a sale completes, the index runs around five months ahead of completed-sale measures such as the UK House Price Index.
Every edition in the archive, back to October 2006, is listed on the index page. How we measure the UK property market explains the listing data behind it, and today's figures by area are on house prices and rental prices.
Text and figures above are quoted from the May 2020 edition as published, with punctuation normalised for the web, and are not revised. Later editions may restate them.
More in What is happening to house prices: the Home guide
Thinking about your next move?
See what your home's worth in seconds, with the UK's longest-running property data behind it.
Get an instant valuation