

























Home Asking Price Index, May 2013: regional markets show signs of genuine recovery
Average asking prices in England and Wales rose 0.7% to £238,721 in May 2013, with the typical time on market falling to 102 days.
This is the May 2013 edition of the Home Asking Price Index, released on 14 May 2013, under the headline:
Regional Markets Show Signs of Genuine Recovery
The headlines and summary below are the report's own words, with the key figures as it published them, followed by the report's charts and regional tables as printed.
Headlines
- Average asking prices across the nation rise 0.7%, a fourth consecutive monthly increase
- Price rises since last month in the South East, South West and Scotland show surprising vigour, even outperforming Greater London
- Prices in London begin to show signs of overheating with another 0.8% hike
Summary
Spring finally arrives and, most encouragingly, the property market is showing signs of growth that is not exclusively driven by the price of homes in Greater London. Average asking prices across the UK increased 0.7% in the last month, largely driven by the South East, South West and Scotland, each reporting rises of 1.0% or more. Prices in London also played their part, rising again last month by 0.8%, and given the restricted supply and high demand (as demonstrated by very short marketing times), the capital's property market is showing the early warning signs of overheating.
A combination of a reduction in the time on market for sales property and the subdued flow of new stock (down 4.0% on last year) will help support prices going forward and provide a further boost to vendors' confidence. The typical (median) time on market now stands at just 102 days (around 3.5 months) although there are still considerable regional differences.
Key figures
| Measure | Figure |
|---|---|
| Average asking price (England & Wales) | £238,721 |
| Monthly change (England & Wales) | 0.7% |
| Annual change (England & Wales) | 3.2% |
| Typical Time on Market (UK) | 102 days |
| Change in new instructions (year-on-year) | -4.0% |
| Change in new instructions vs April 2011 | -22% |
Figures are for England and Wales unless the report states otherwise, as published in the edition.
Charts from the report
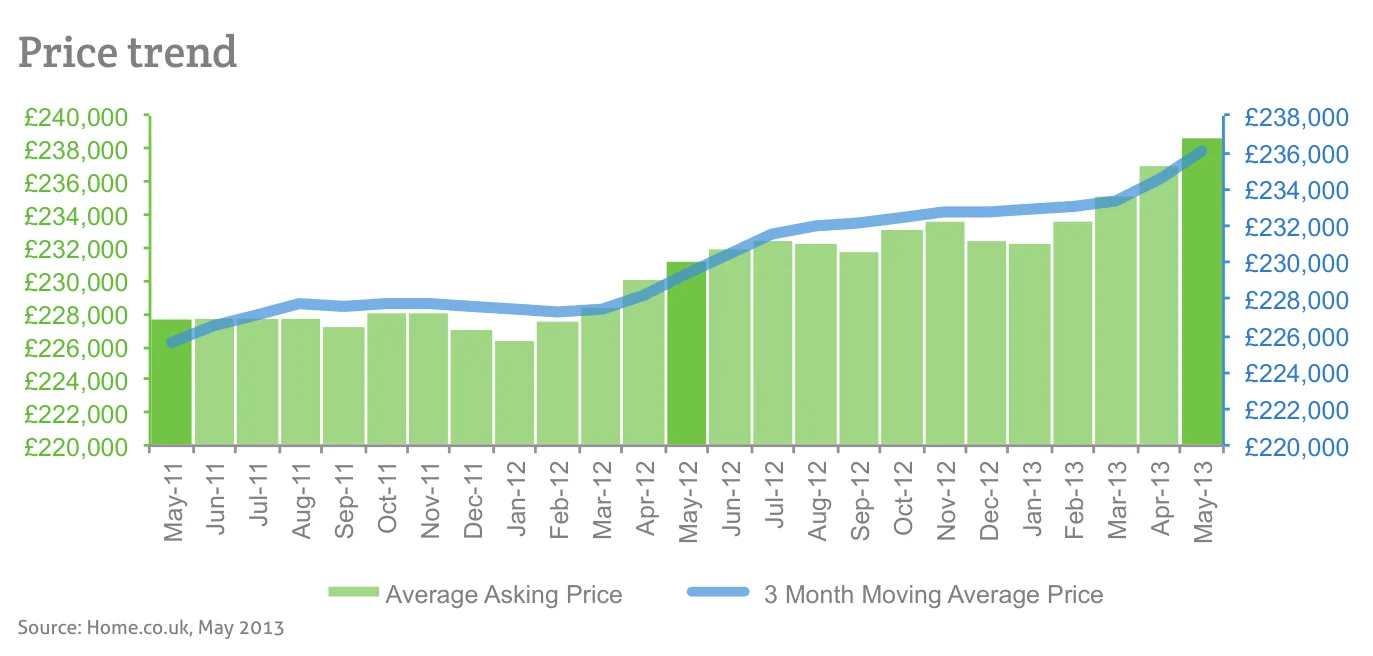
Source: Home.co.uk, May 2013
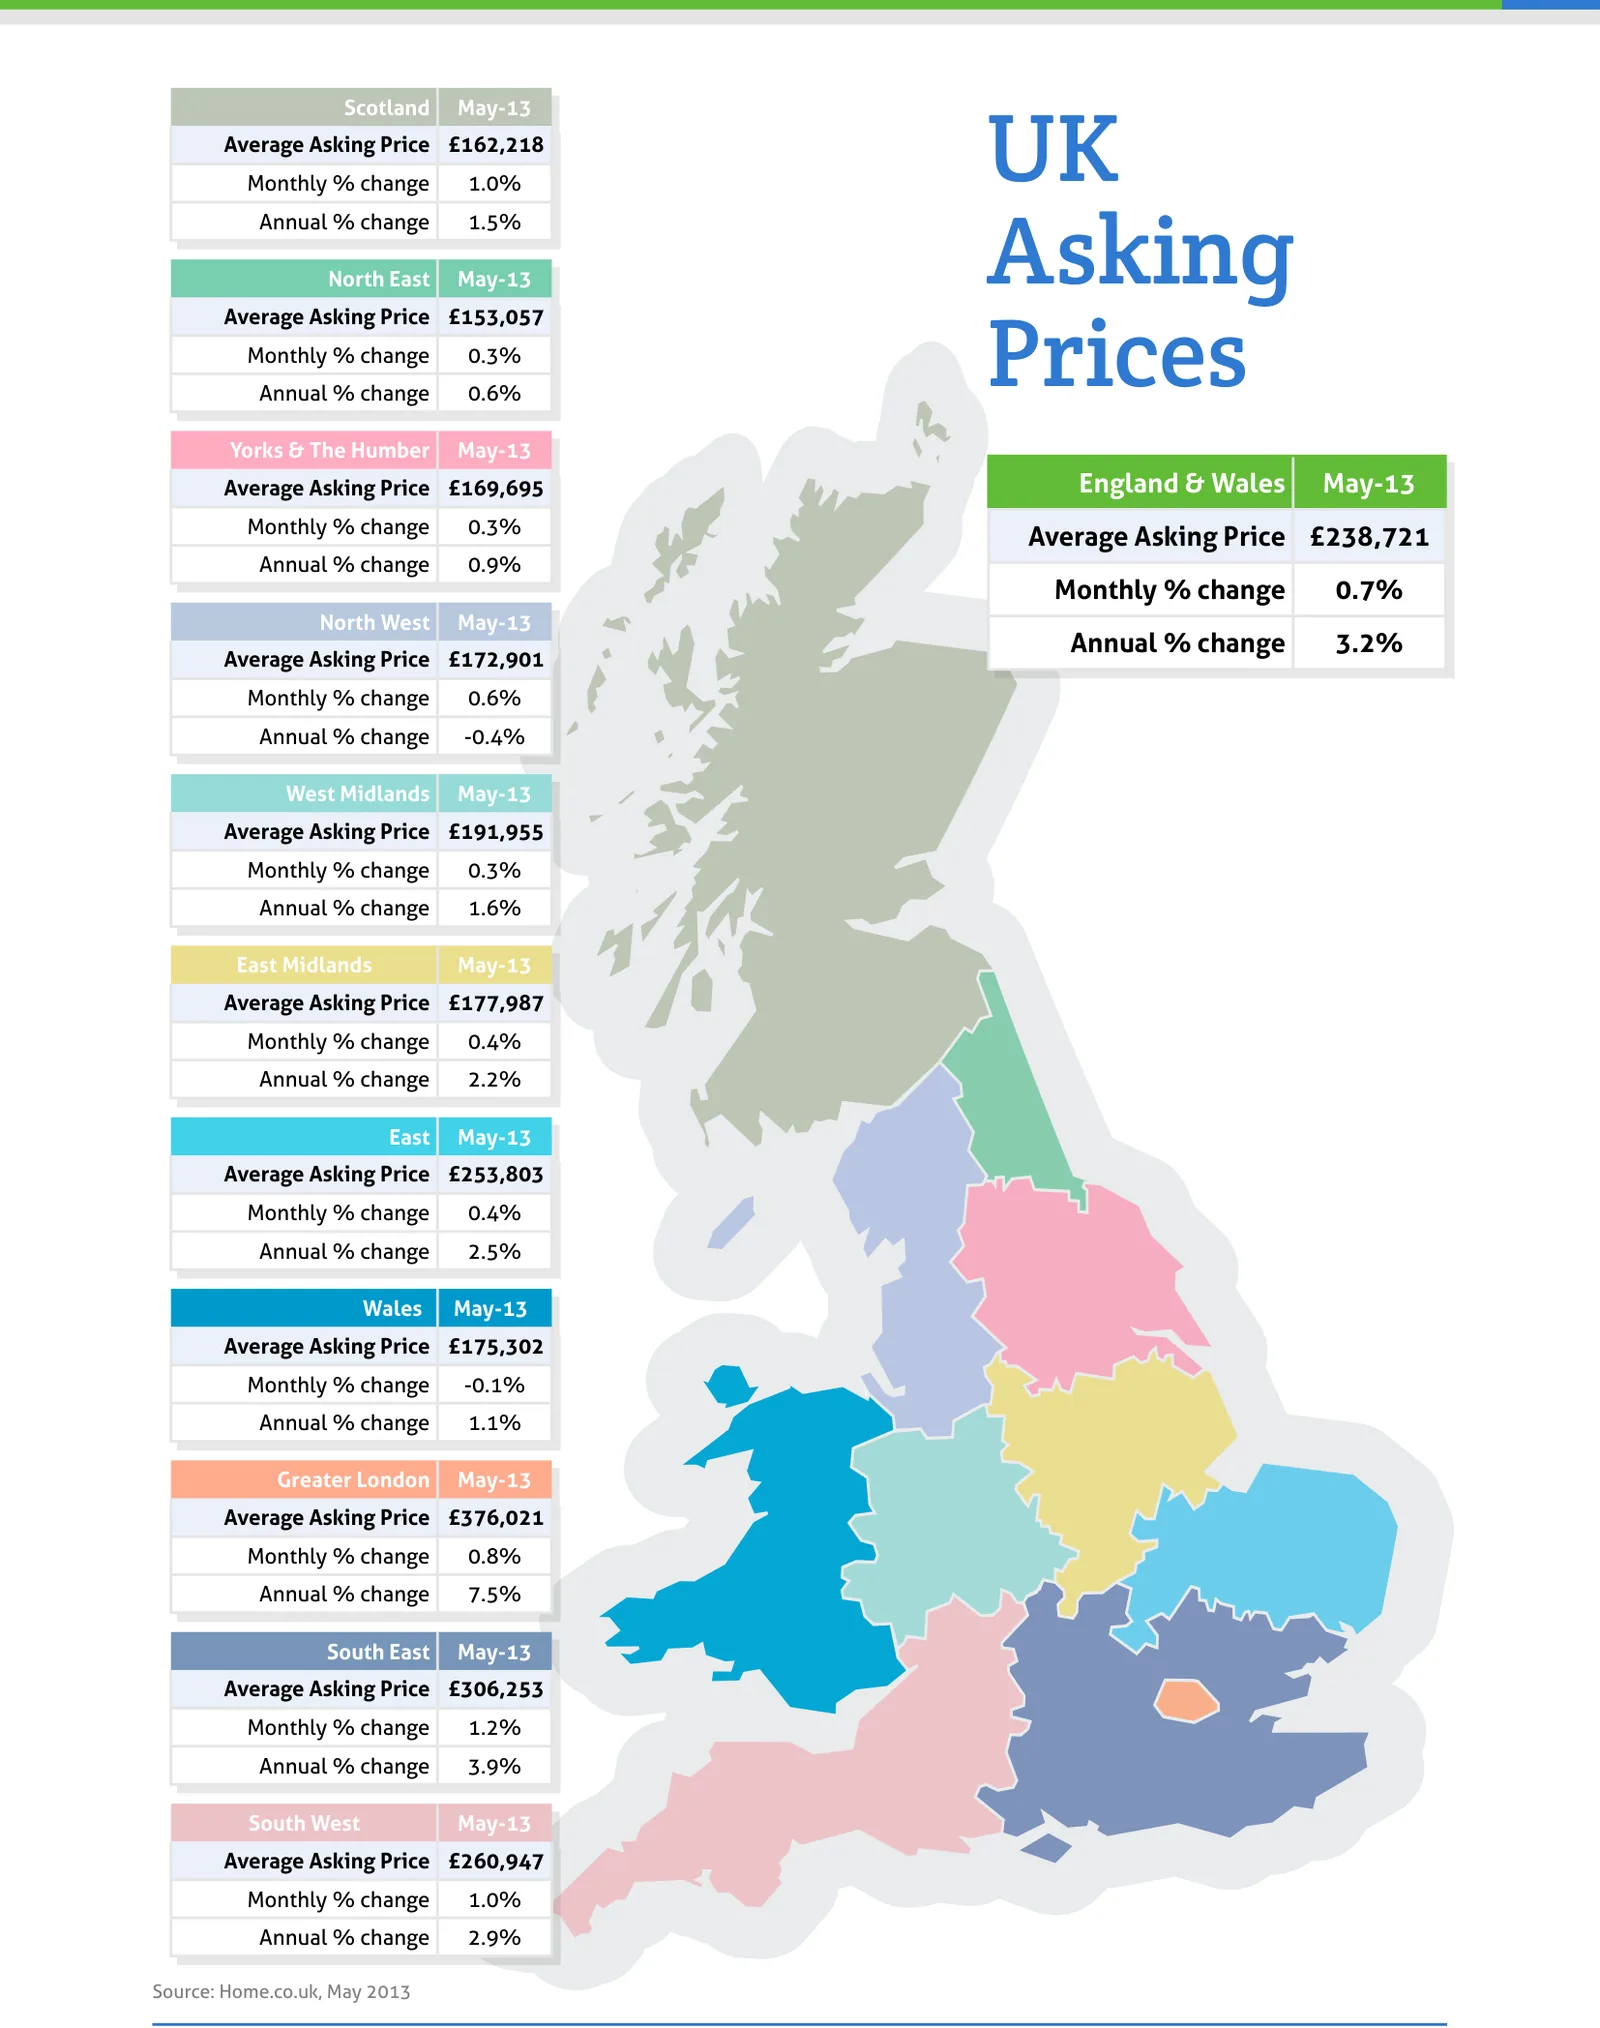
Source: Home.co.uk, May 2013
Regional tables
UK Asking Prices, May-13
| Region | Average Asking Price | Monthly % change | Annual % change |
|---|---|---|---|
| Scotland | £162,218 | 1.0% | 1.5% |
| North East | £153,057 | 0.3% | 0.6% |
| Yorks & The Humber | £169,695 | 0.3% | 0.9% |
| England & Wales | £238,721 | 0.7% | 3.2% |
| North West | £172,901 | 0.6% | -0.4% |
| West Midlands | £191,955 | 0.3% | 1.6% |
| East Midlands | £177,987 | 0.4% | 2.2% |
| East | £253,803 | 0.4% | 2.5% |
| Wales | £175,302 | -0.1% | 1.1% |
| Greater London | £376,021 | 0.8% | 7.5% |
| South East | £306,253 | 1.2% | 3.9% |
| South West | £260,947 | 1.0% | 2.9% |
Median (typical) Time on Market by region, May 2013
| Rank | Region | Typical Time on Market in May 2013 (days) | Change since May 2012 (days) |
|---|---|---|---|
| 1 | Greater London | 70 | -12 |
| 2 | South East | 74 | -8 |
| 3 | East | 82 | -8 |
| 4 | South West | 89 | -7 |
| 5 | West Midlands | 101 | -16 |
| 6 | East Midlands | 107 | -13 |
| 7 | Yorkshire & The Humber | 147 | -30 |
| 8 | North West | 155 | -4 |
| 9 | Scotland | 158 | -5 |
| 10 | Wales | 169 | -21 |
From the director's commentary
"Whilst marketing times are notoriously seasonal, the time taken to sell property is an important indication of the real health of the local market. This vital signal provides estate agents, buyers and vendors alike an insight into the fluidity of local markets and their ability to drive transactions."
Doug Shephard, Director at Home.co.uk
Read the full May 2013 edition (PDF, 5 pages)
About the Home Asking Price Index
The Home Asking Price Index measures the change in the prices sellers ask for residential property across England, Wales and Scotland. Today it is computed every month from around half a million advertised homes and is mix-adjusted, so a change in what happens to be on the market does not move the figure; earlier editions state the sample they were built from. Because an asking price is set months before a sale completes, the index runs around five months ahead of completed-sale measures such as the UK House Price Index.
Every edition in the archive, back to October 2006, is listed on the index page. How we measure the UK property market explains the listing data behind it, and today's figures by area are on house prices and rental prices.
Text and figures above are quoted from the May 2013 edition as published, with punctuation normalised for the web, and are not revised. Later editions may restate them.
More in What is happening to house prices: the Home guide
Thinking about your next move?
See what your home's worth in seconds, with the UK's longest-running property data behind it.
Get an instant valuation