

























Home Asking Price Index, March 2025: home prices leap ahead in the North and West Midlands
UK asking prices rose 0.5% in February, with Yorkshire leading regional growth at 5.4% year on year while the South East lagged at 0.3%.
This is the March 2025 edition of the Home Asking Price Index, released on 19 March 2025, under the headline:
Home Prices Leap Ahead in the North and West Midlands
The headlines and summary below are the report's own words, with the key figures as it published them, followed by the report's charts and regional tables as printed.
Headlines
- Asking prices rose in every English region, Scotland and Wales during February, making the national average rise by 0.5%. The rise is typical of seasonal trends and was bolstered by a moderation of supply. However, annualised home price growth across England and Wales remains below the level of inflation at just 1.8% overall.
- The huge surge in new instructions that occurred in January seems to have been transient. Supply of new sales properties entering the market during February 2025 was no more than during February 2024 overall, although there is regional variation, with minor increases still visible in London, the South East and the South West.
- The most bullish vendors are in the West Midlands, Yorkshire and the North West, posting the largest month-on-month gains of 1.0%, 0.9% and 0.9% respectively.
- Yorkshire retains the position of regional property market growth leader with an impressive year-on-year gain of 5.4%. Meanwhile, the South East retains its position as the worst regional performer with an annualised gain of just 0.3%.
- Sales market momentum shows a slight increase over March 2024. Property turnover is currently higher than any of the previous ten years of March readings, while Typical Time on Market remains the same as in March last year.
- The unsold sales stock count for England and Wales increased by just 6,000 properties during the last month, which is in line with seasonal expectations. The current total of 475,444 is relatively high and is the largest March figure since 2013.
- The annualised national growth in asking rents is now a mere 1.3% (while supply is up 16%), which is well below the rate of inflation. This national figure is significantly discounted by the negative performance of London, the UK's largest regional rental market (rents down 1.6% while the 12-month change in supply is up 9.0%). Meanwhile, regions showing exceptional performance are the East Midlands and Yorkshire, indicating rental growth of 9.2% and 7.6% respectively year-on-year.
- The City of London followed by Hackney indicate the largest declines in asking rents of all London boroughs, with annualised rental falls of 17.9% and 6.7% respectively. Meanwhile, the best performers are Westminster and Wandsworth, with rents increasing by 8.9% and 8.3% respectively.
Summary
Despite negative economic news regarding the wider UK economy, the UK property market retains significant optimism. The flow rate of properties moving through the sales market is relatively high, thanks to substantial demand. Rising asking prices during the last month were supported by seasonal optimism and a moderation in supply following the surge in new instructions seen in January.
Overall, the vital signs of the UK property sales market indicate a positive state of health, due mainly to continued demand in the North. However, vendors and agents alike understand that the current level of demand is unlikely to be sustained after the increase in stamp duty on April 1st. By how much buyer appetite is quenched is anyone's guess. Should demand fall significantly, the latter part of the year will be a miserable experience for the UK property market, given the vast amount of inventory already on the market.
Yorkshire remains the regional growth leader with the mix-adjusted average asking price now an impressive 5.4% higher than a year ago, while the South East shows a paltry 0.3% growth, just ahead of the East of England at 0.4%.
Key figures
| Measure | Figure |
|---|---|
| Monthly change in asking prices | +0.5% |
| Annual change in asking prices | 1.8% |
| Total unsold stock | 475,444 |
| Annualised national growth in asking rents | 1.3% |
| Annual change in rental supply | +16% |
| Annualised mix-adjusted average asking price growth | 1.9% |
Figures are for England and Wales unless the report states otherwise, as published in the edition.
Charts from the report
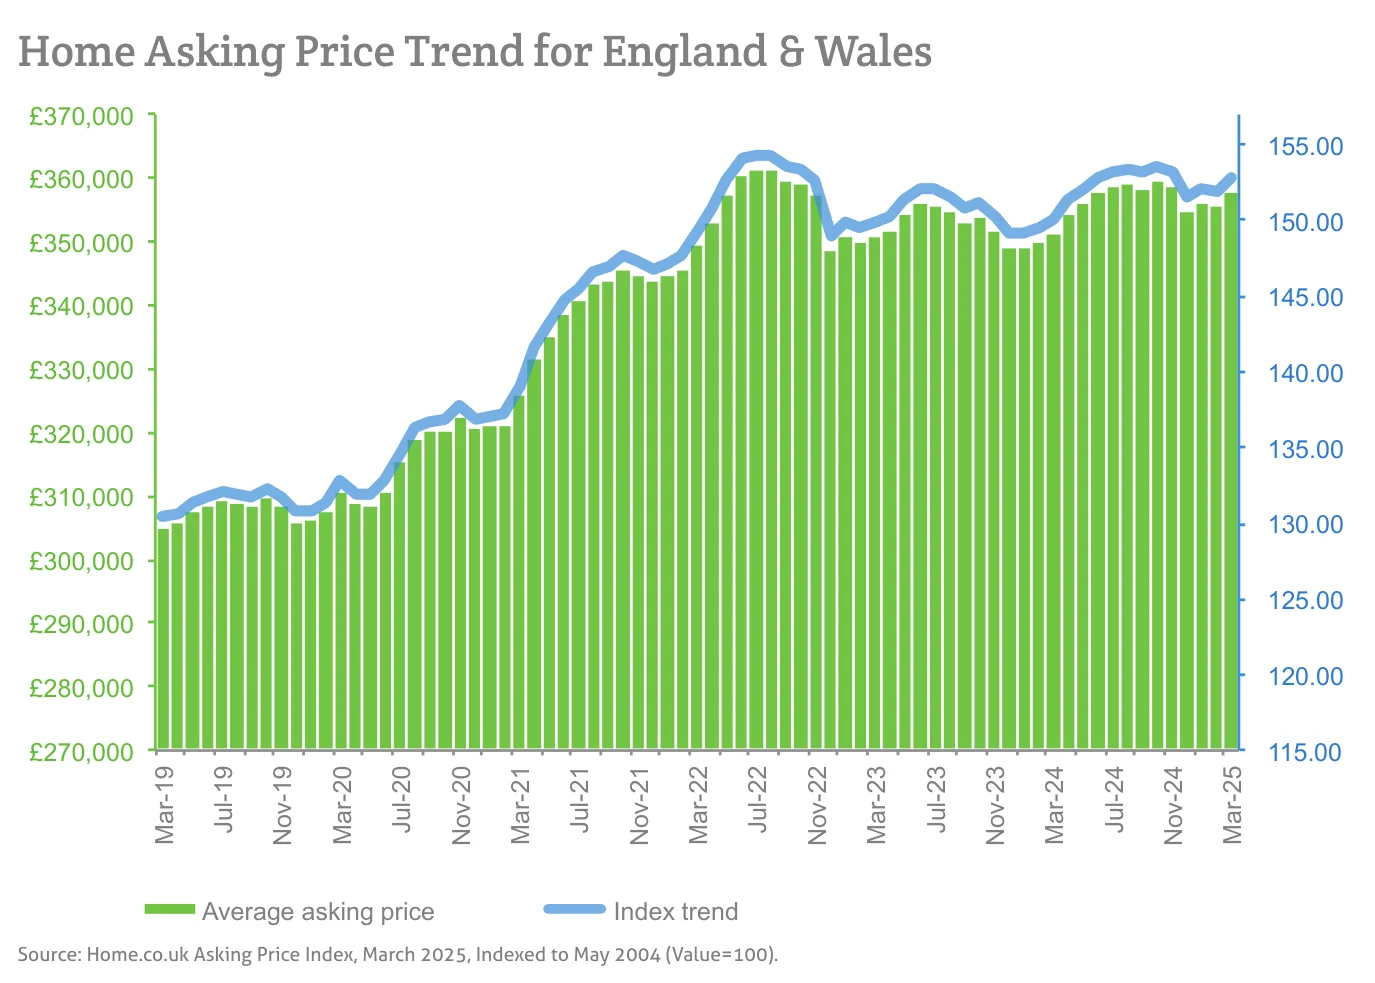
Source: Home.co.uk Asking Price Index, March 2025, Indexed to May 2004 (Value=100).
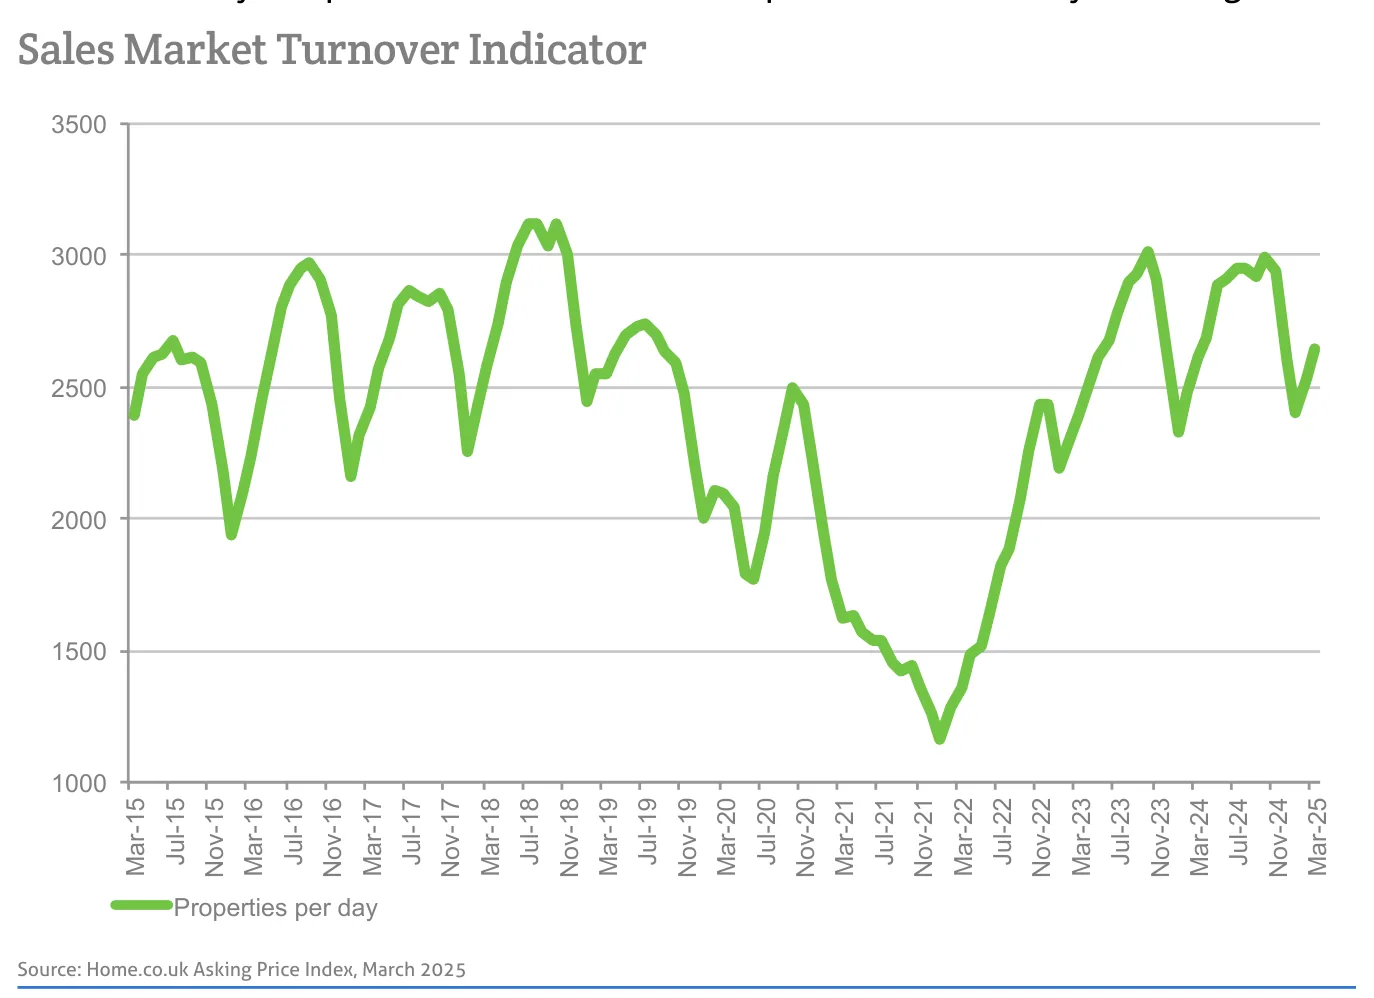
Source: Home.co.uk Asking Price Index, March 2025
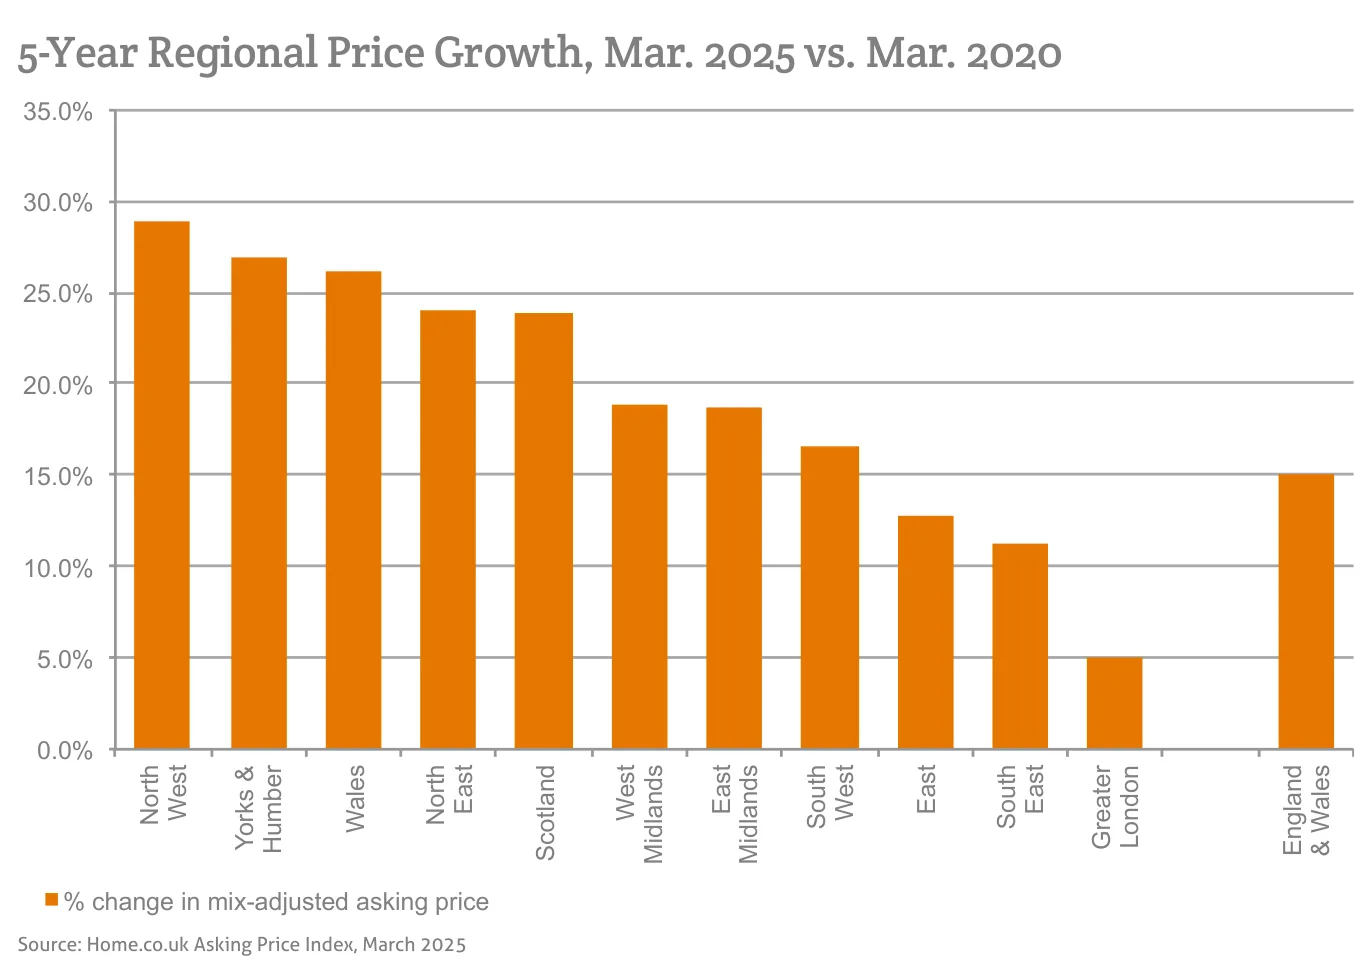
Source: Home.co.uk Asking Price Index, March 2025
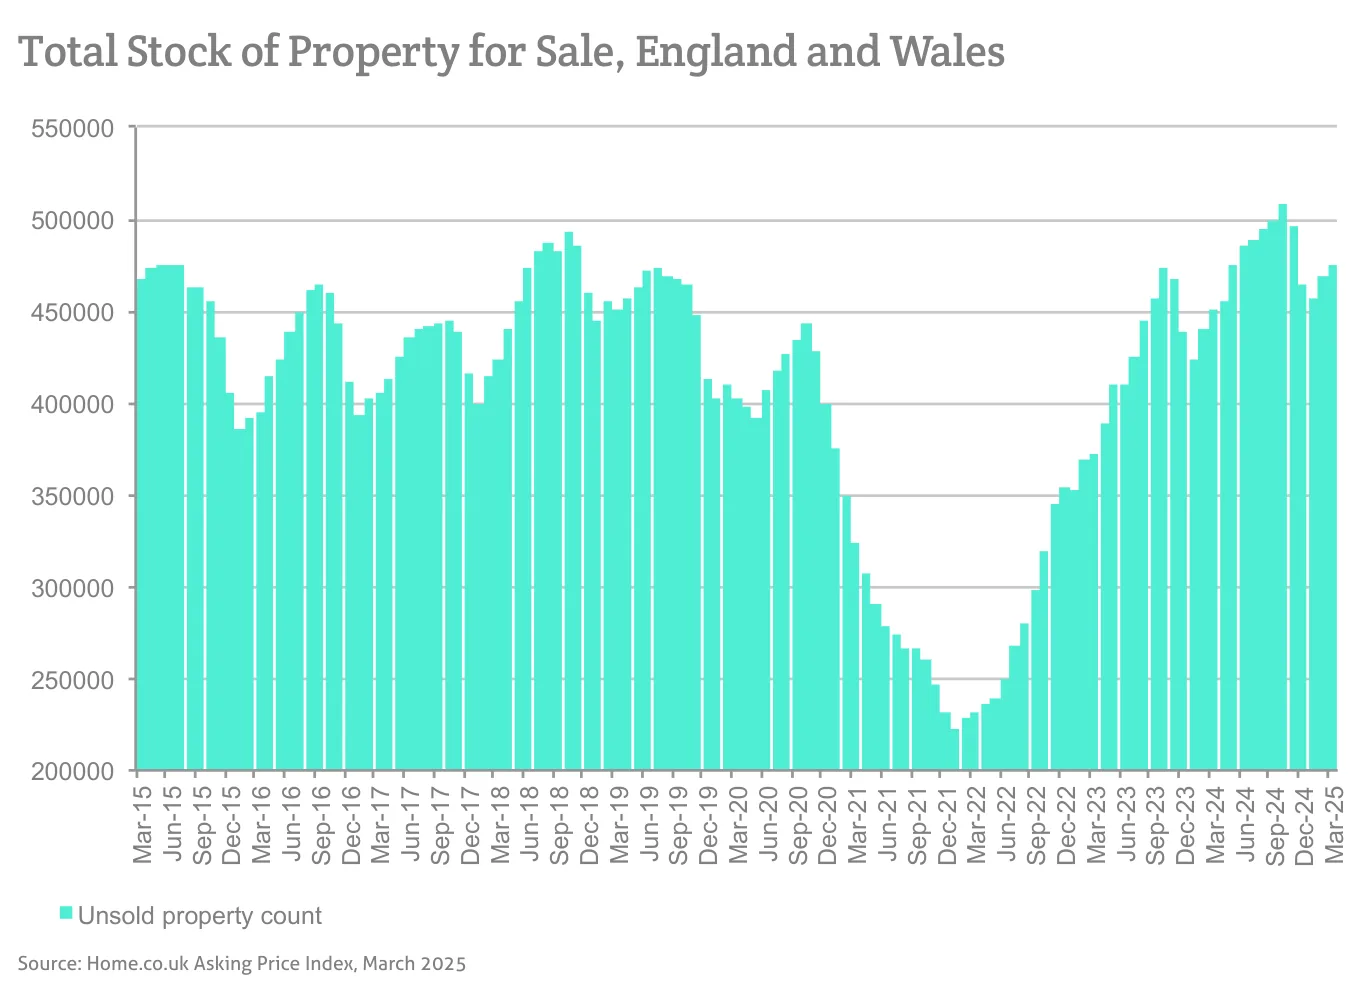
Source: Home.co.uk Asking Price Index, March 2025
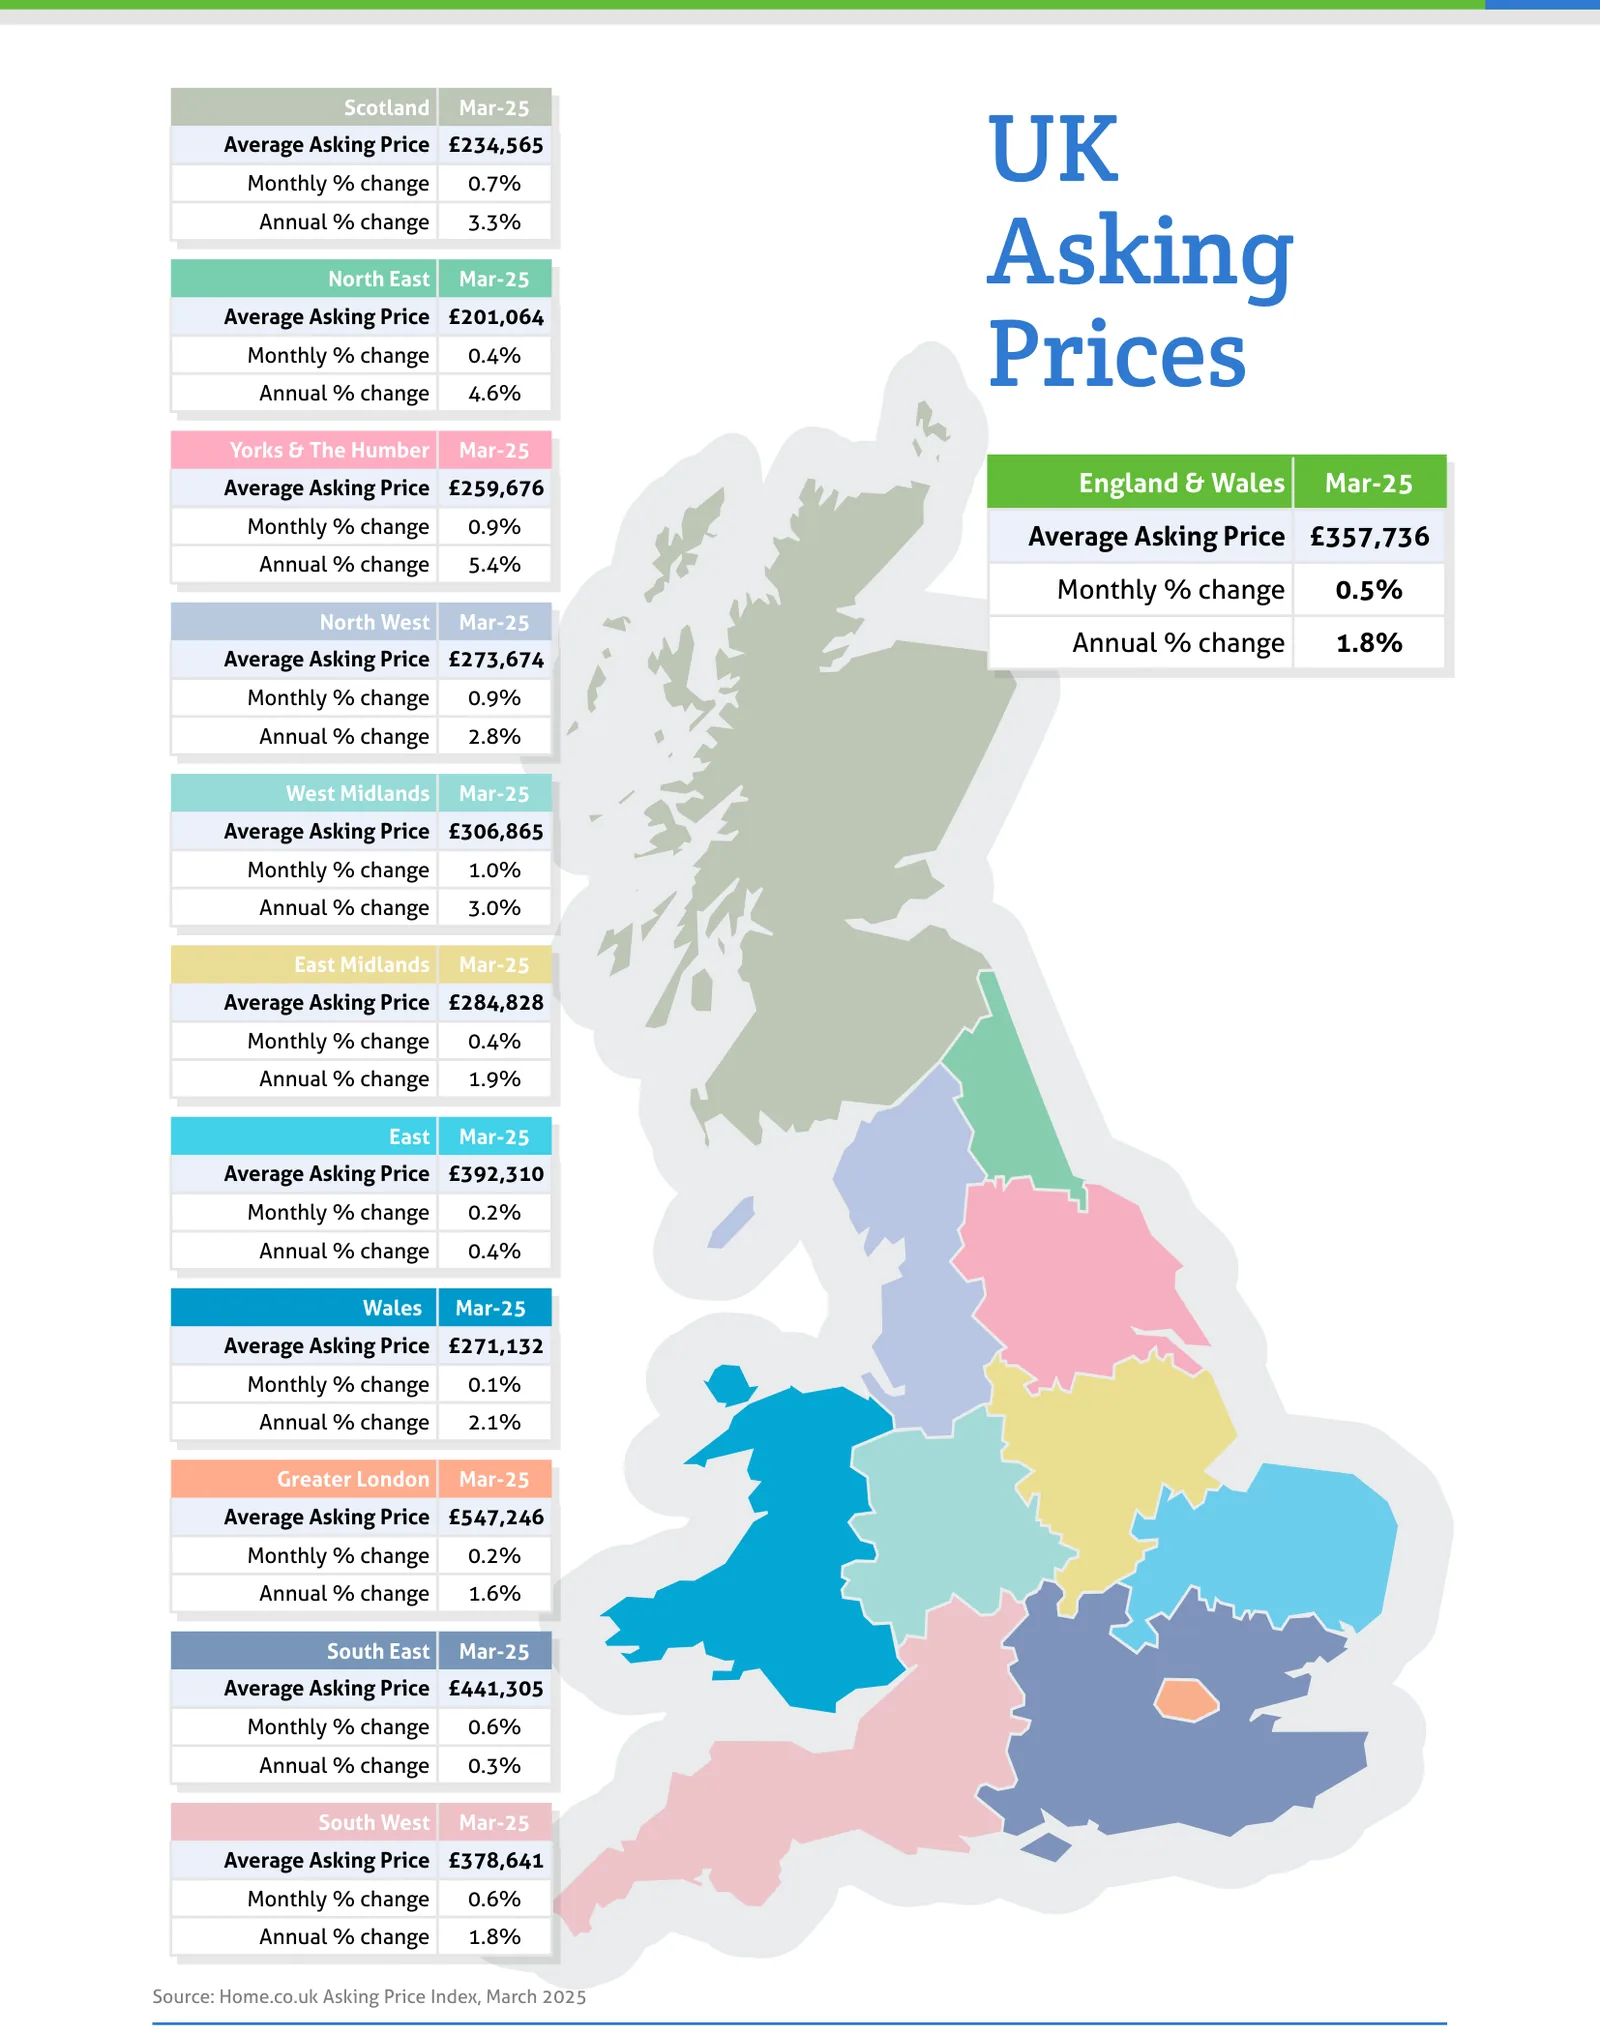
Source: Home.co.uk Asking Price Index, March 2025
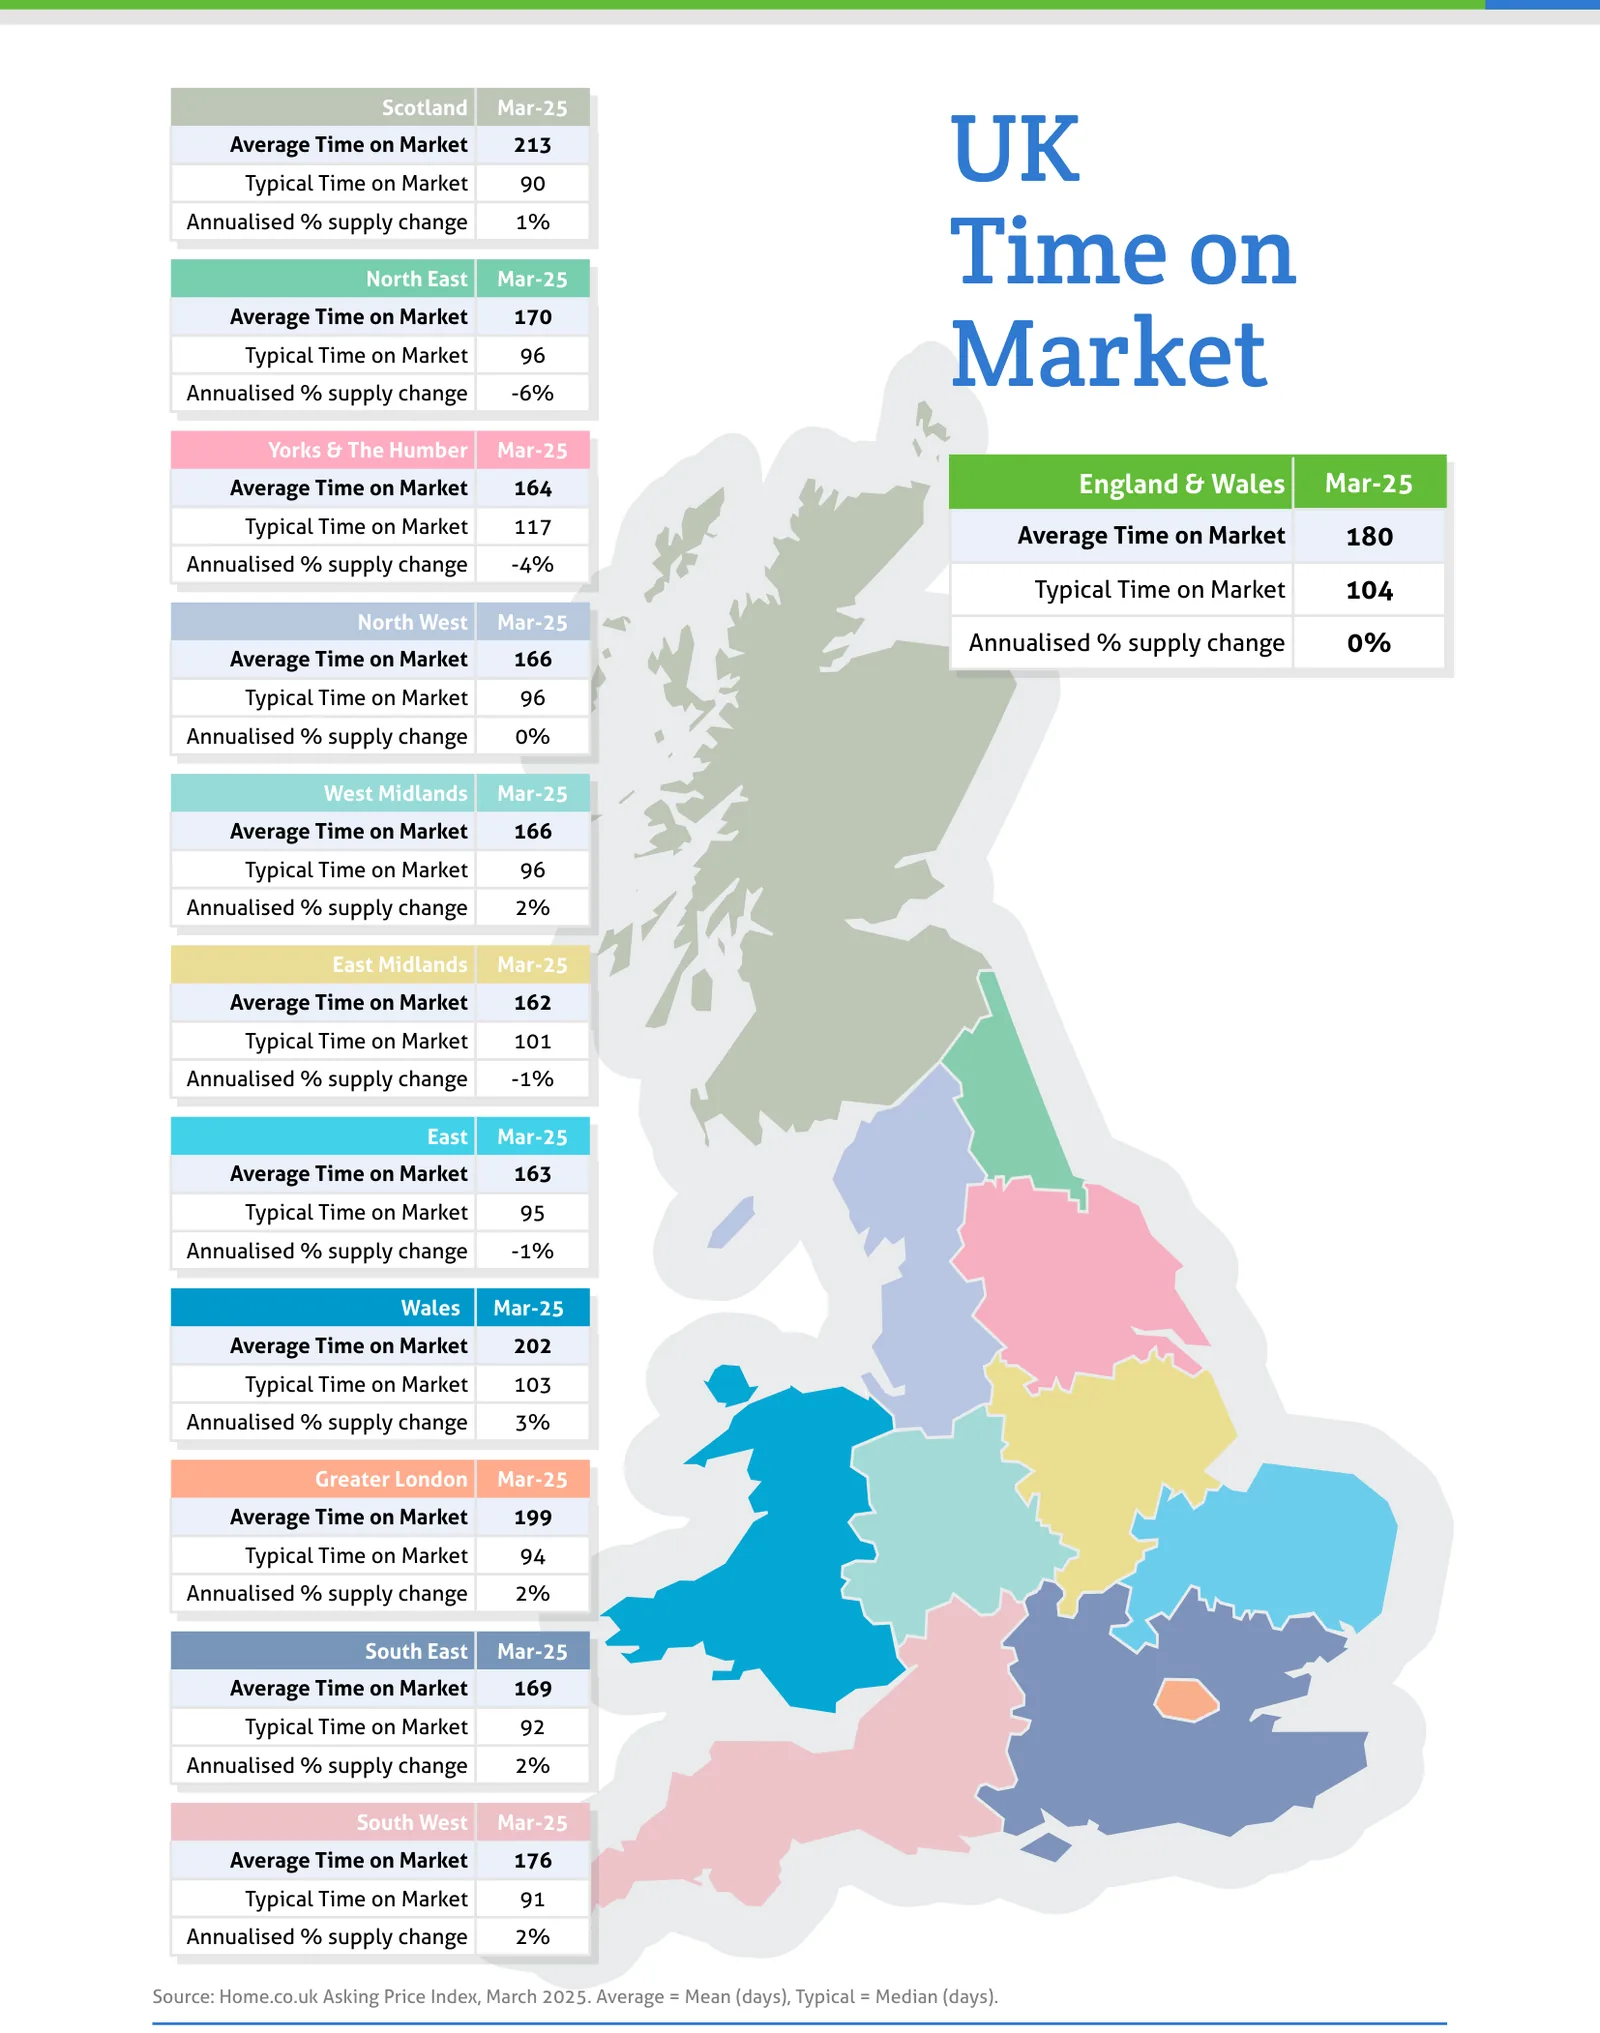
Source: Home.co.uk Asking Price Index, March 2025. Average = Mean (days), Typical = Median (days).
Regional tables
UK Asking Prices, Mar-25
| Region | Average Asking Price | Monthly % change | Annual % change |
|---|---|---|---|
| Scotland | £234,565 | 0.7% | 3.3% |
| North East | £201,064 | 0.4% | 4.6% |
| Yorks & The Humber | £259,676 | 0.9% | 5.4% |
| England & Wales | £357,736 | 0.5% | 1.8% |
| North West | £273,674 | 0.9% | 2.8% |
| West Midlands | £306,865 | 1.0% | 3.0% |
| East Midlands | £284,828 | 0.4% | 1.9% |
| East | £392,310 | 0.2% | 0.4% |
| Wales | £271,132 | 0.1% | 2.1% |
| Greater London | £547,246 | 0.2% | 1.6% |
| South East | £441,305 | 0.6% | 0.3% |
| South West | £378,641 | 0.6% | 1.8% |
UK Time on Market, Mar-25
| Region | Average Time on Market | Typical Time on Market | Annualised % supply change |
|---|---|---|---|
| Scotland | 213 | 90 | 1% |
| North East | 170 | 96 | -6% |
| Yorks & The Humber | 164 | 117 | -4% |
| England & Wales | 180 | 104 | 0% |
| North West | 166 | 96 | 0% |
| West Midlands | 166 | 96 | 2% |
| East Midlands | 162 | 101 | -1% |
| East | 163 | 95 | -1% |
| Wales | 202 | 103 | 3% |
| Greater London | 199 | 94 | 2% |
| South East | 169 | 92 | 2% |
| South West | 176 | 91 | 2% |
From the director's commentary
"It's pretty simple really: an economy overburdened by taxation will fall into recession."
Doug Shephard, Director at Home.co.uk
Read the full March 2025 edition (PDF, 9 pages)
About the Home Asking Price Index
The Home Asking Price Index measures the change in the prices sellers ask for residential property across England, Wales and Scotland. Today it is computed every month from around half a million advertised homes and is mix-adjusted, so a change in what happens to be on the market does not move the figure; earlier editions state the sample they were built from. Because an asking price is set months before a sale completes, the index runs around five months ahead of completed-sale measures such as the UK House Price Index.
Every edition in the archive, back to October 2006, is listed on the index page. How we measure the UK property market explains the listing data behind it, and today's figures by area are on house prices and rental prices.
Text and figures above are quoted from the March 2025 edition as published, with punctuation normalised for the web, and are not revised. Later editions may restate them.
More in What is happening to house prices: the Home guide
Thinking about your next move?
See what your home's worth in seconds, with the UK's longest-running property data behind it.
Get an instant valuation