

























Home Asking Price Index, March 2024: prices up in all regions as the market picks up pace
Asking prices rose 0.4% in February, edging up 0.1% year on year, while unsold stock reached 451,185 across England and Wales.
This is the March 2024 edition of the Home Asking Price Index, released on 13 March 2024, under the headline:
Prices Up in All Regions as the Market Picks Up Pace
The headlines and summary below are the report's own words, with the key figures as it published them, followed by the report's charts and regional tables as printed.
Headlines
- Asking prices continue their upward trajectory, adding 0.4% since last month across England and Wales, and are now up year-on-year by 0.1% vs. March 2023.
- Most notably, prices rose in ALL English regions, Scotland and Wales during the last month, indicating nationwide positive sentiment.
- The Typical Time on Market for unsold property in England and Wales has dropped eight days since February as market momentum increases. The current median is 104 days; in pre-COVID March 2019, the same measure was 111 days.
- The total sales stock count for England and Wales continues to rise in line with seasonal expectations. The current total of unsold property is 451,185, around 11,000 more than last month and approximately the same total as registered in March 2019.
- The number of new instructions entering the market during February 2024 was 13% more than during February 2023. This significant increase indicates greater vendor optimism vis-a-vis the market hesitancy triggered by the Truss-Kwarteng mini-budget fiasco. Compared to pre-COVID February 2019, supply is up only 8%.
- Scotland replaces the North West as the regional property market growth league table leader with a year-on-year gain of 4.2%. The East of England replaces the East Midlands as the worst performing region over the same period at -1.7%.
- UK rent growth overall continues to slow, dragged down by London, reducing the annualised change to a mere 2.1%. The North East remains the regional leader in rental growth at +15.1% year-on-year. Greater London rents continue to plunge (-6.9%), making it by far the worst performing region due to a vast oversupply of property to let.
- Rents continue to slide most in the more expensive central London boroughs. Growth has become increasingly negative overall and a total of eighteen prime boroughs now show year-on-year falls in asking rents, up from thirteen last month. The worst performer remains Kensington and Chelsea, extending its decline with a year-on-year drop of 14.4%.
Summary
The UK property market steps up a gear this month, with vendor optimism vastly improved compared to March last year. There is also good news for buyers, with the market offering much more choice and lower pricing (particularly in London, East Midlands, East and the South West) when compared to the peak in July 2022. Buyers are also increasingly confident that price corrections due to higher interest rates have worked through the market and that future price falls appear less likely in the near term. With an air of 'business as usual' pervading the market, slightly more vendors than usual have committed to sell, although stock levels are still comparable to pre-pandemic levels. Currently, there is no excess of property on the market that would inevitably put downward pressure on prices. Moreover, time on market figures (both mean and median) are falling as properties begin to move through the market more quickly. Current Typical Time on Market figures are consistent with pre-COVID years and we anticipate further reductions in marketing times in April and perhaps May.
Key figures
| Measure | Figure |
|---|---|
| Monthly change in asking prices | +0.4% |
| Annual change in asking prices | +0.1% |
| Typical Time on Market | 104 days |
| Change in Typical Time on Market since February | -8 days |
| Total unsold stock | 451,185 |
| New instructions change (year-on-year) | +13% |
| UK rent growth (annualised) | +2.1% |
| Supply change vs pre-COVID Feb 2019 | +8% |
Figures are for England and Wales unless the report states otherwise, as published in the edition.
Charts from the report
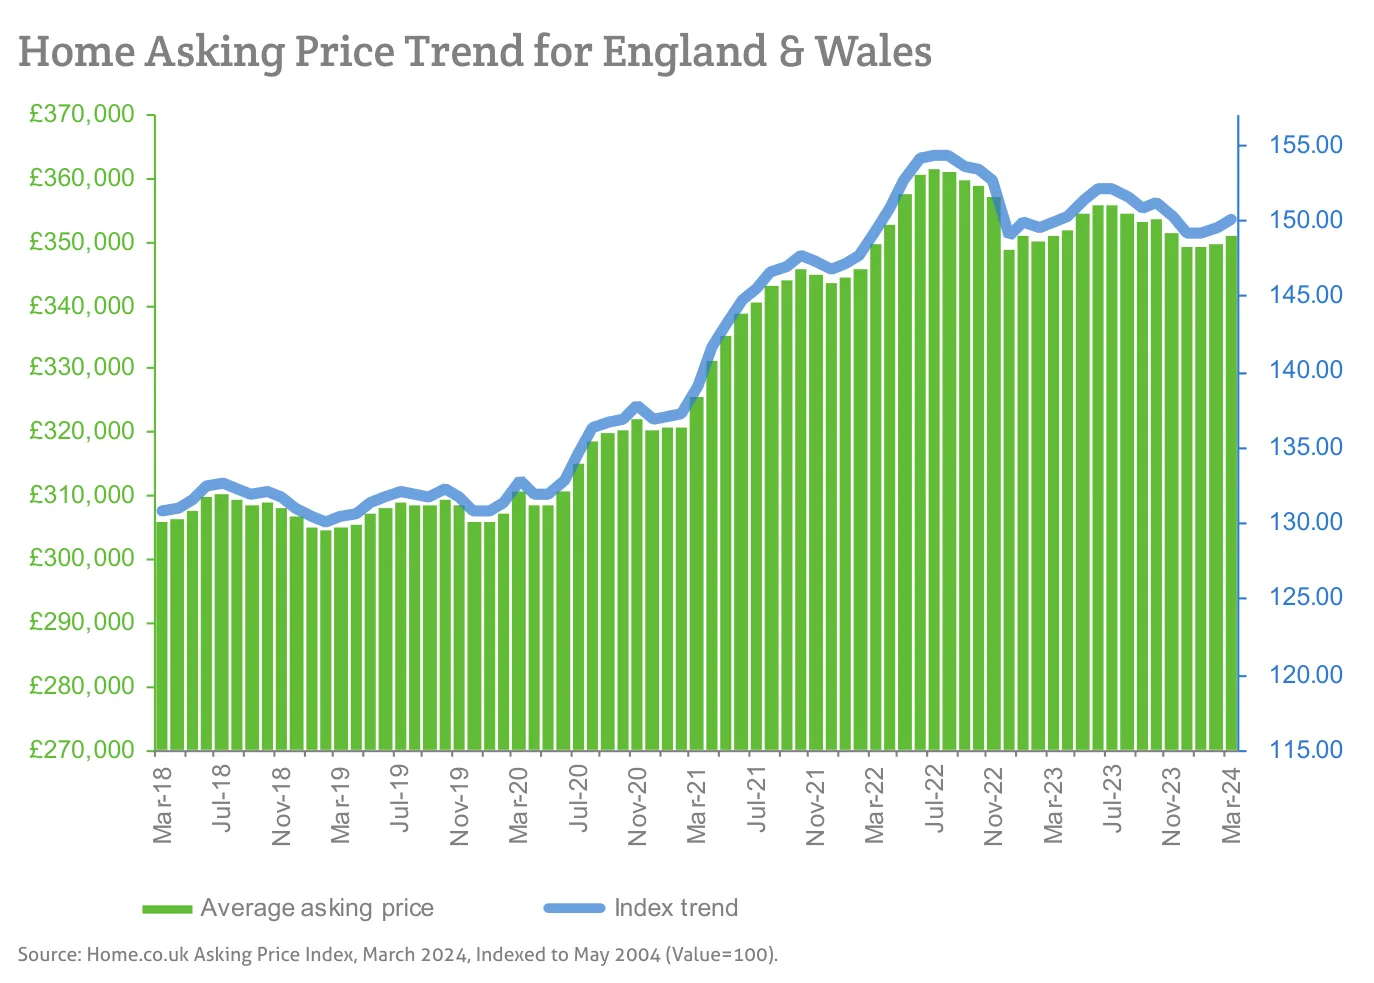
Source: Home.co.uk Asking Price Index, March 2024, Indexed to May 2004 (Value=100).
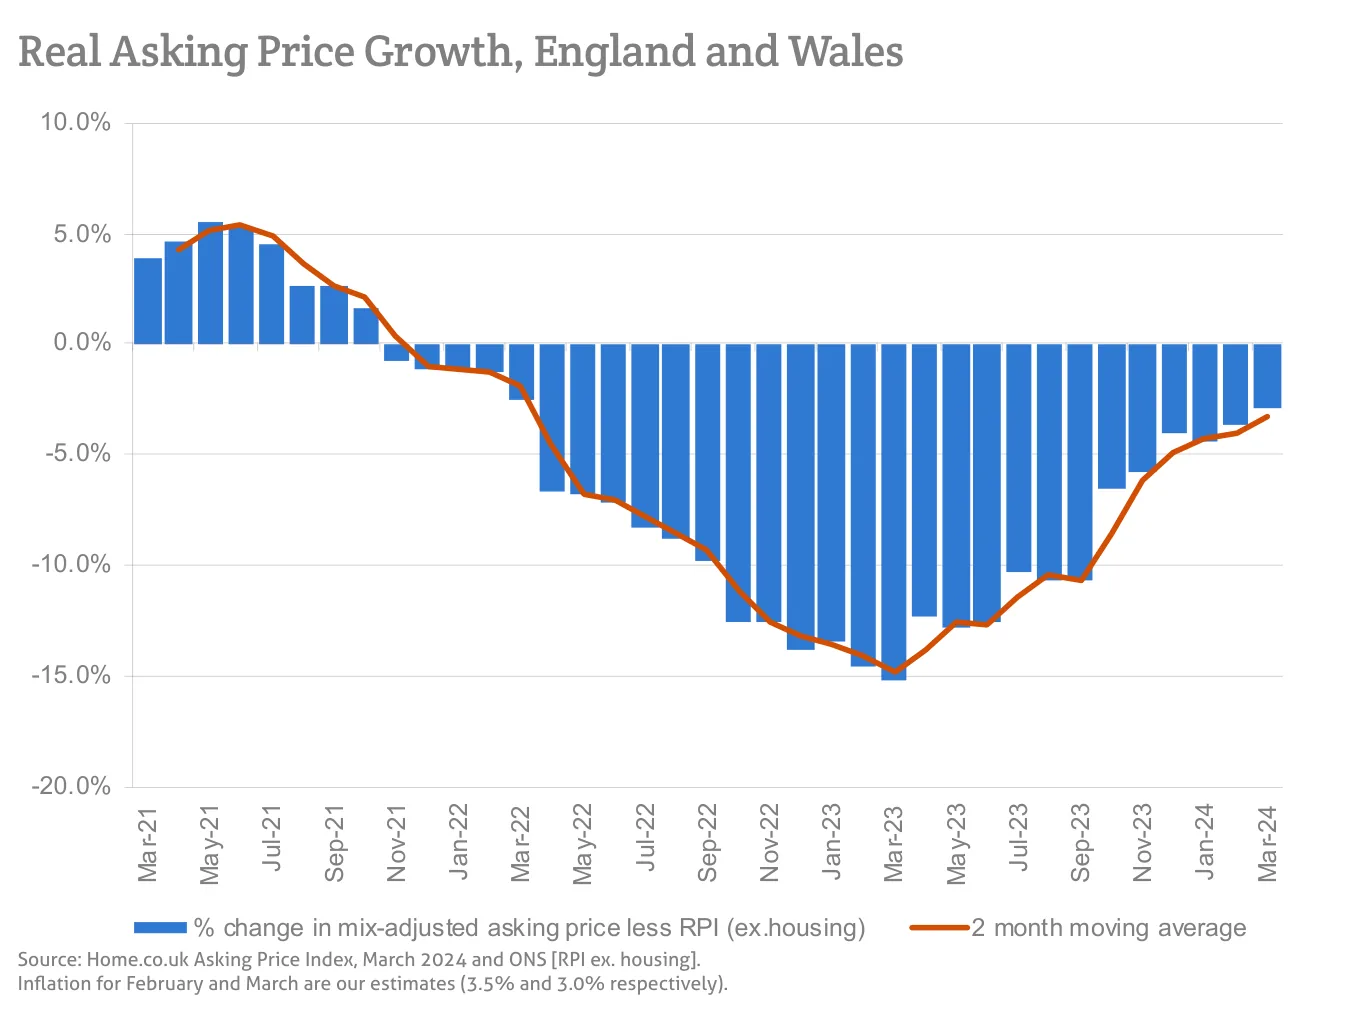
Source: Home.co.uk Asking Price Index, March 2024 and ONS [RPI ex. housing].
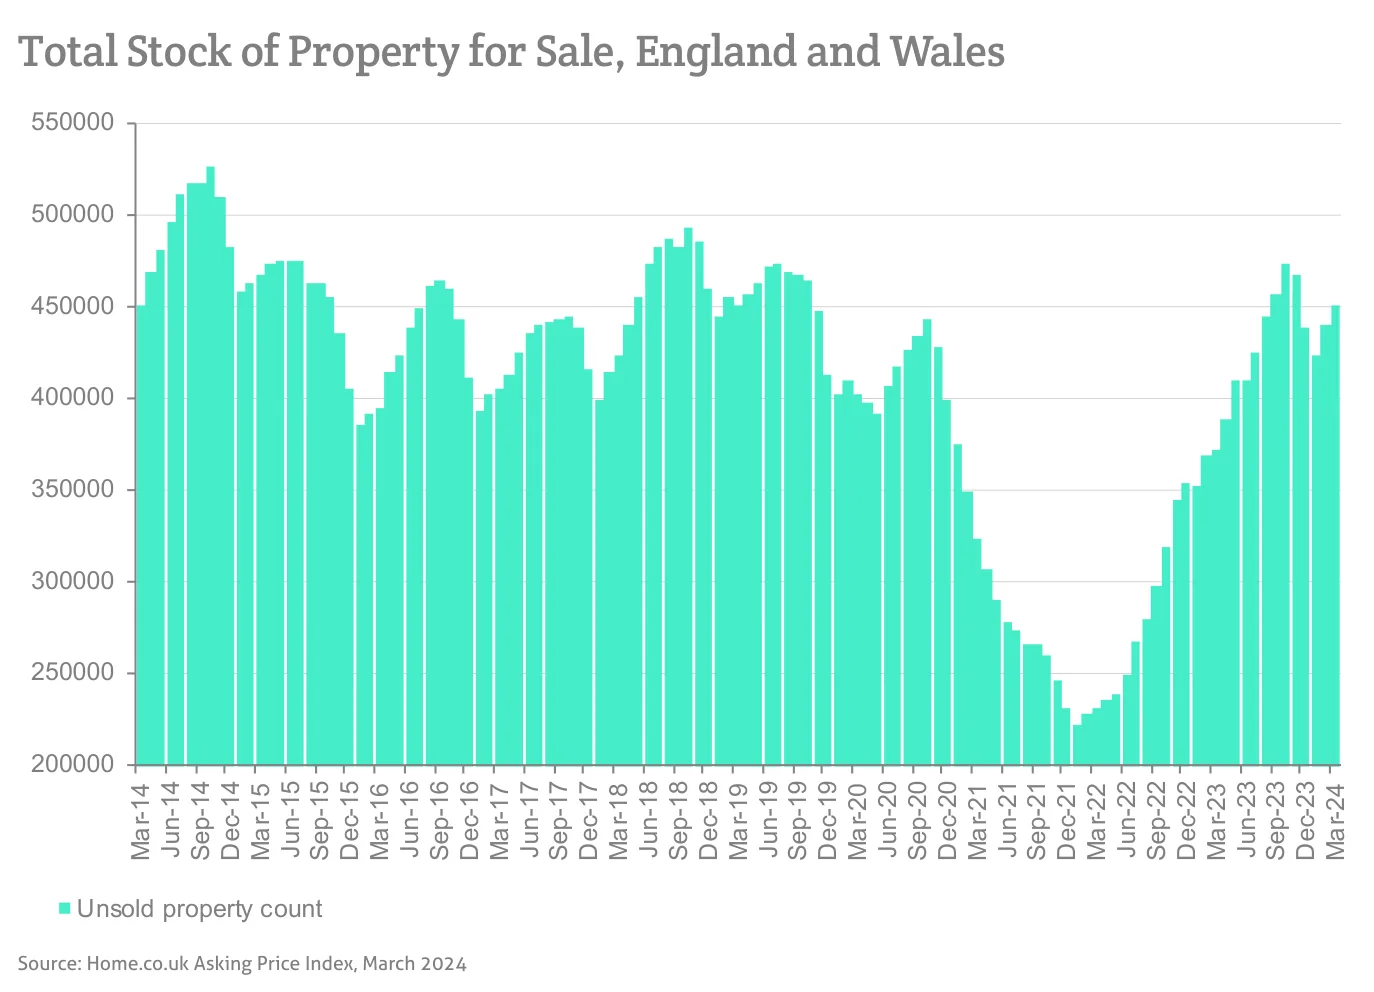
Source: Home.co.uk Asking Price Index, March 2024
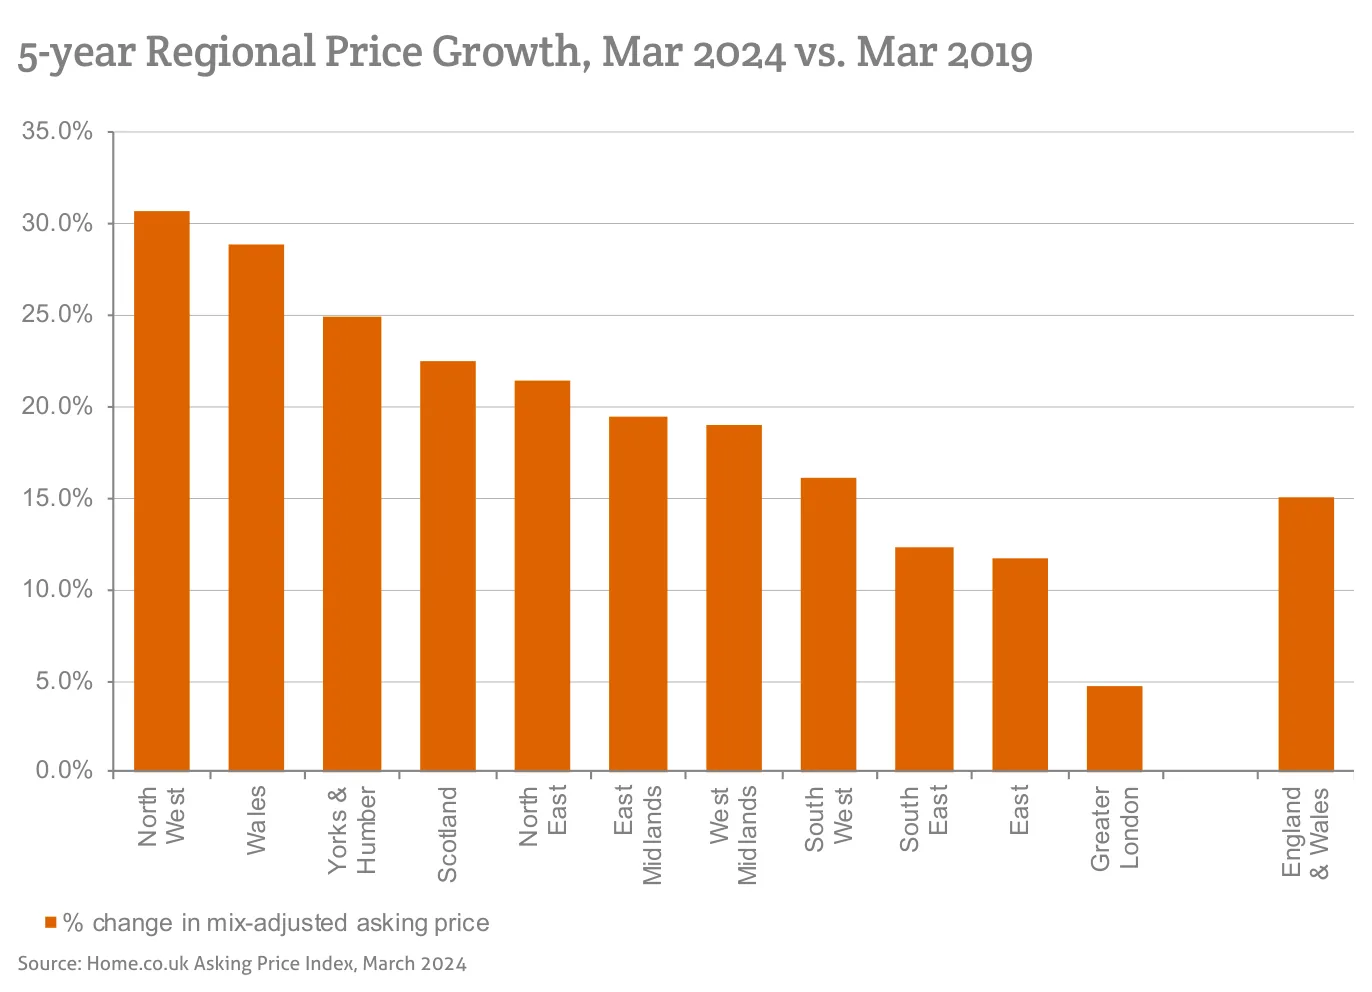
Source: Home.co.uk Asking Price Index, March 2024
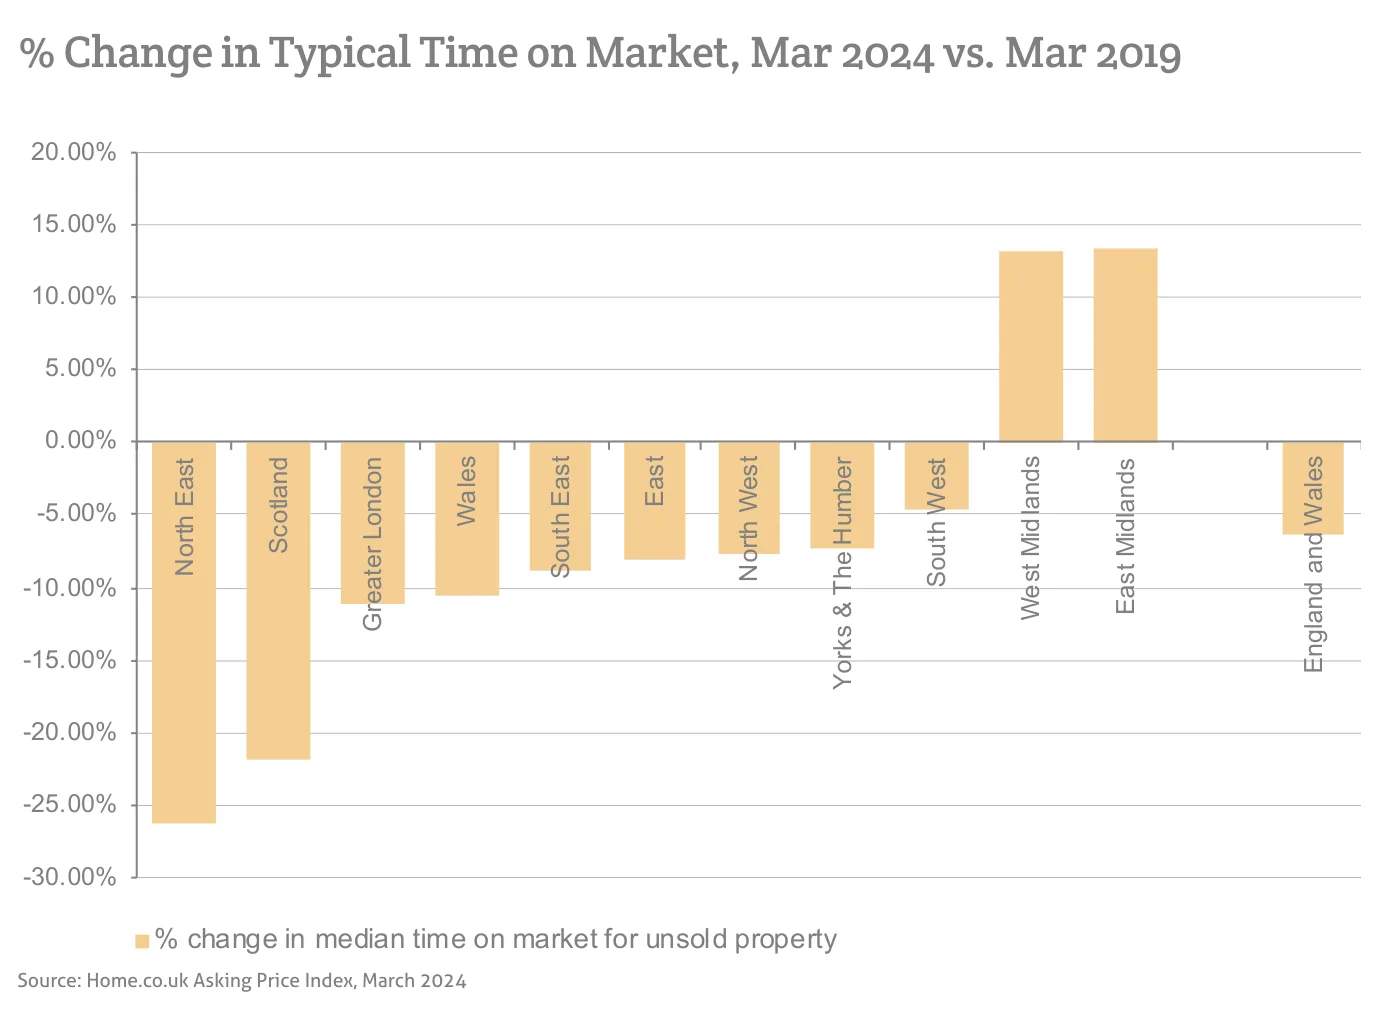
Source: Home.co.uk Asking Price Index, March 2024
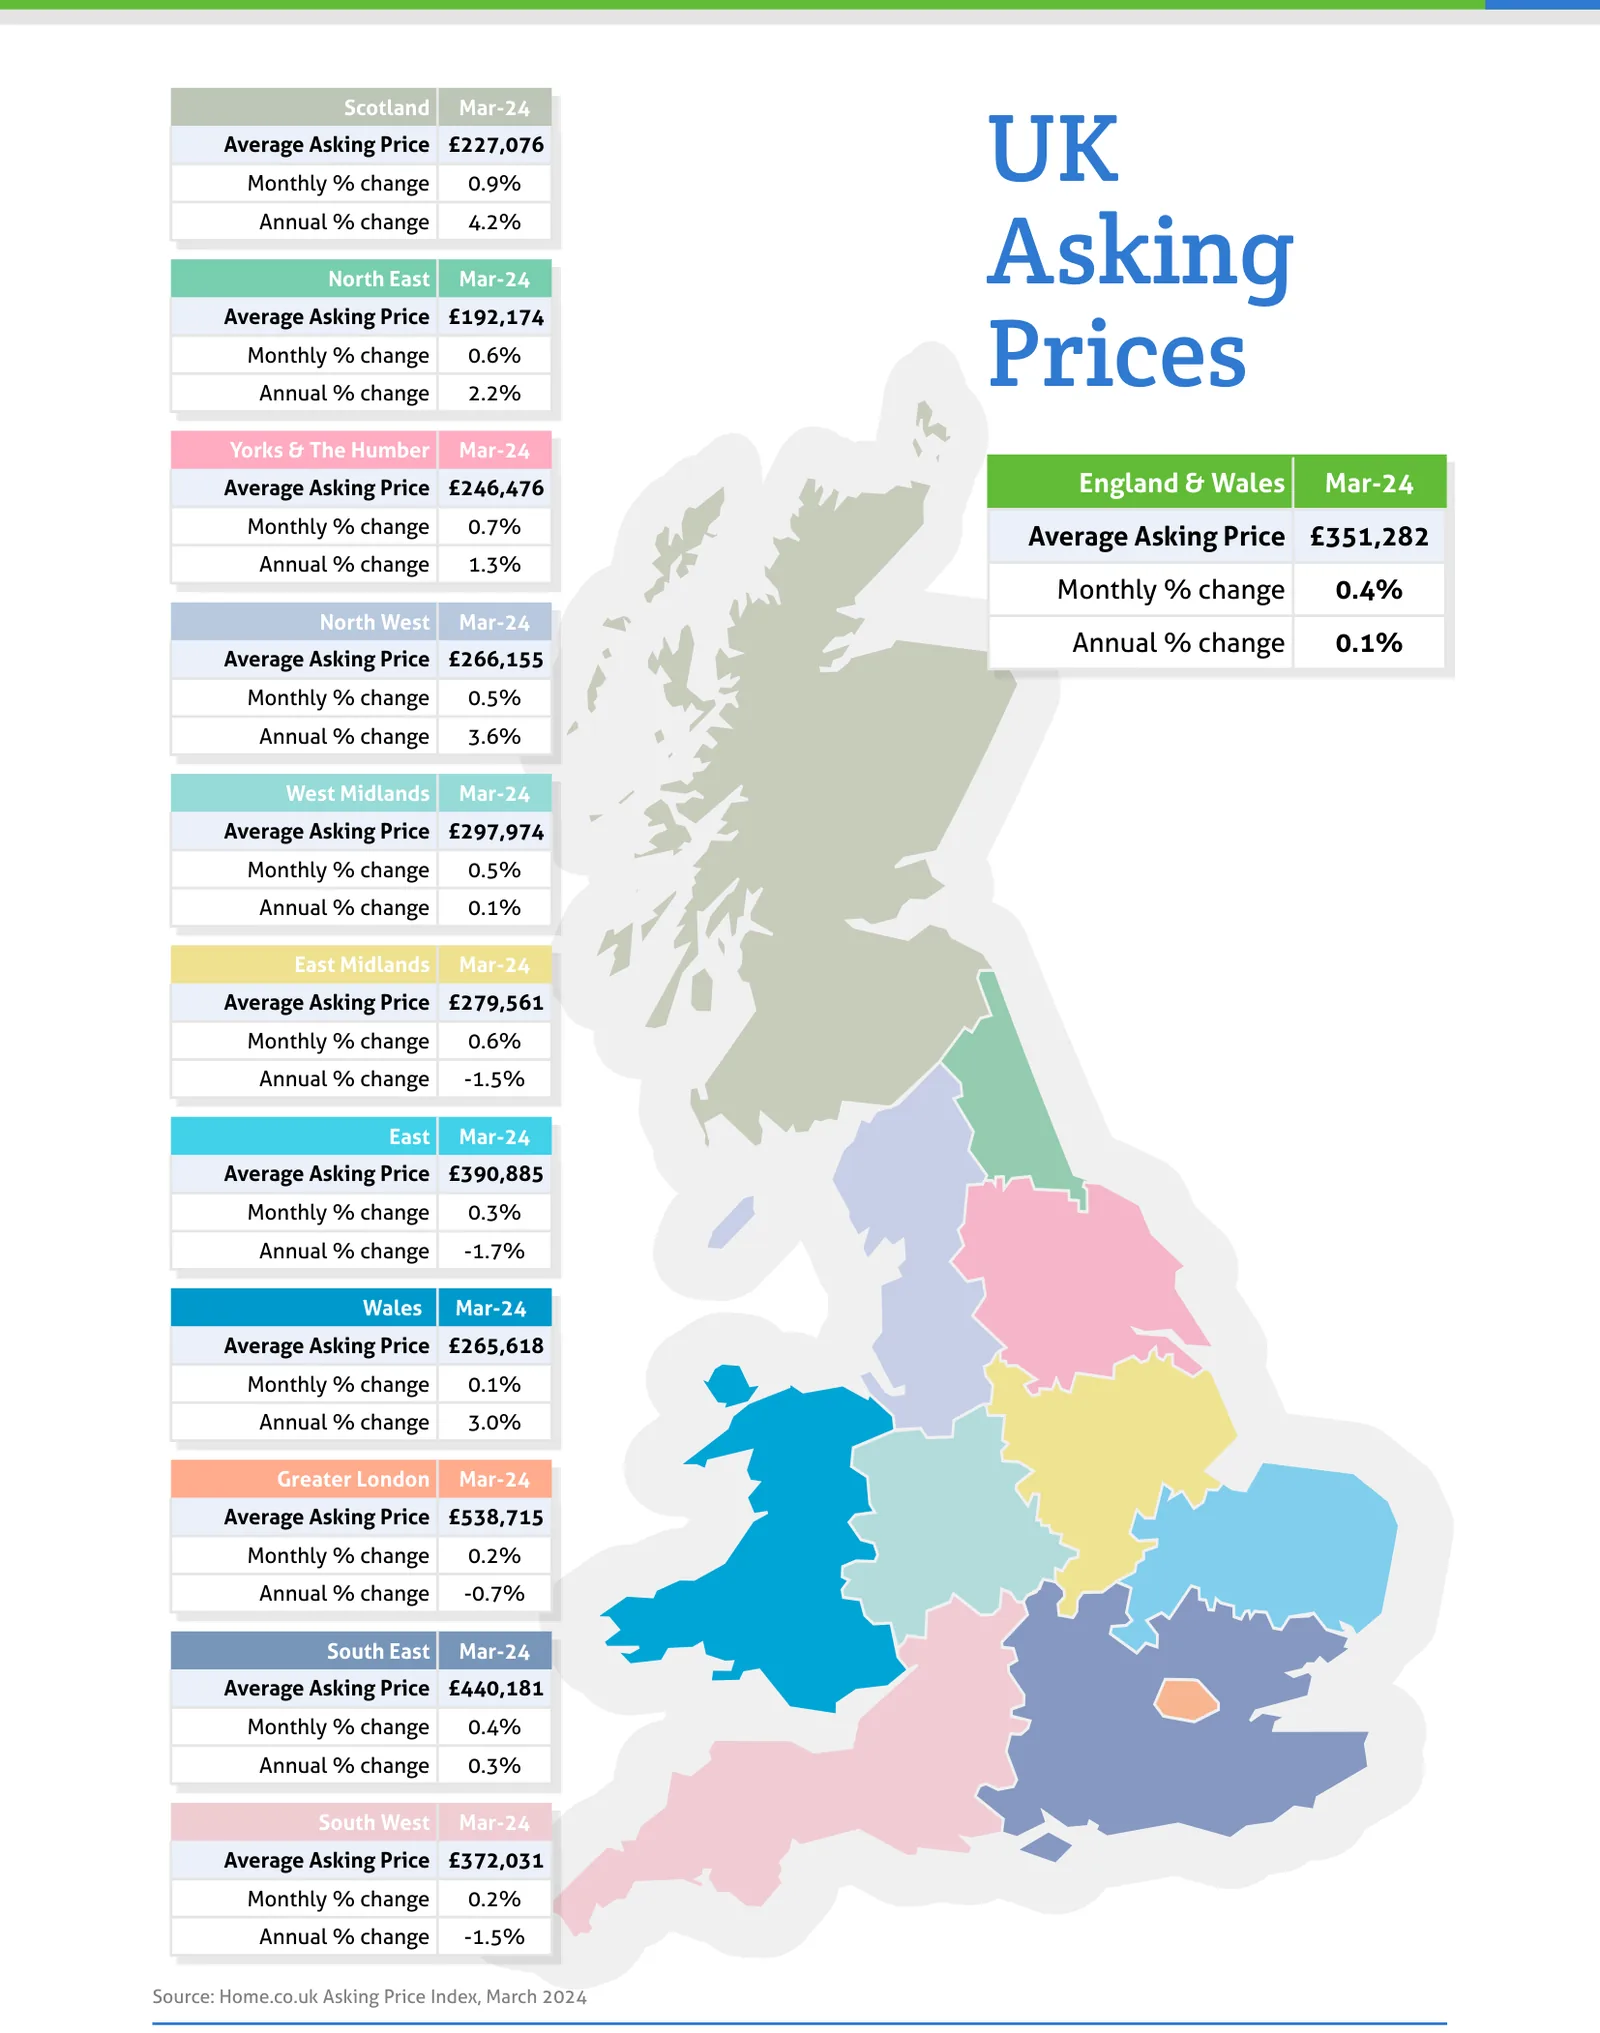
Source: Home.co.uk Asking Price Index, March 2024
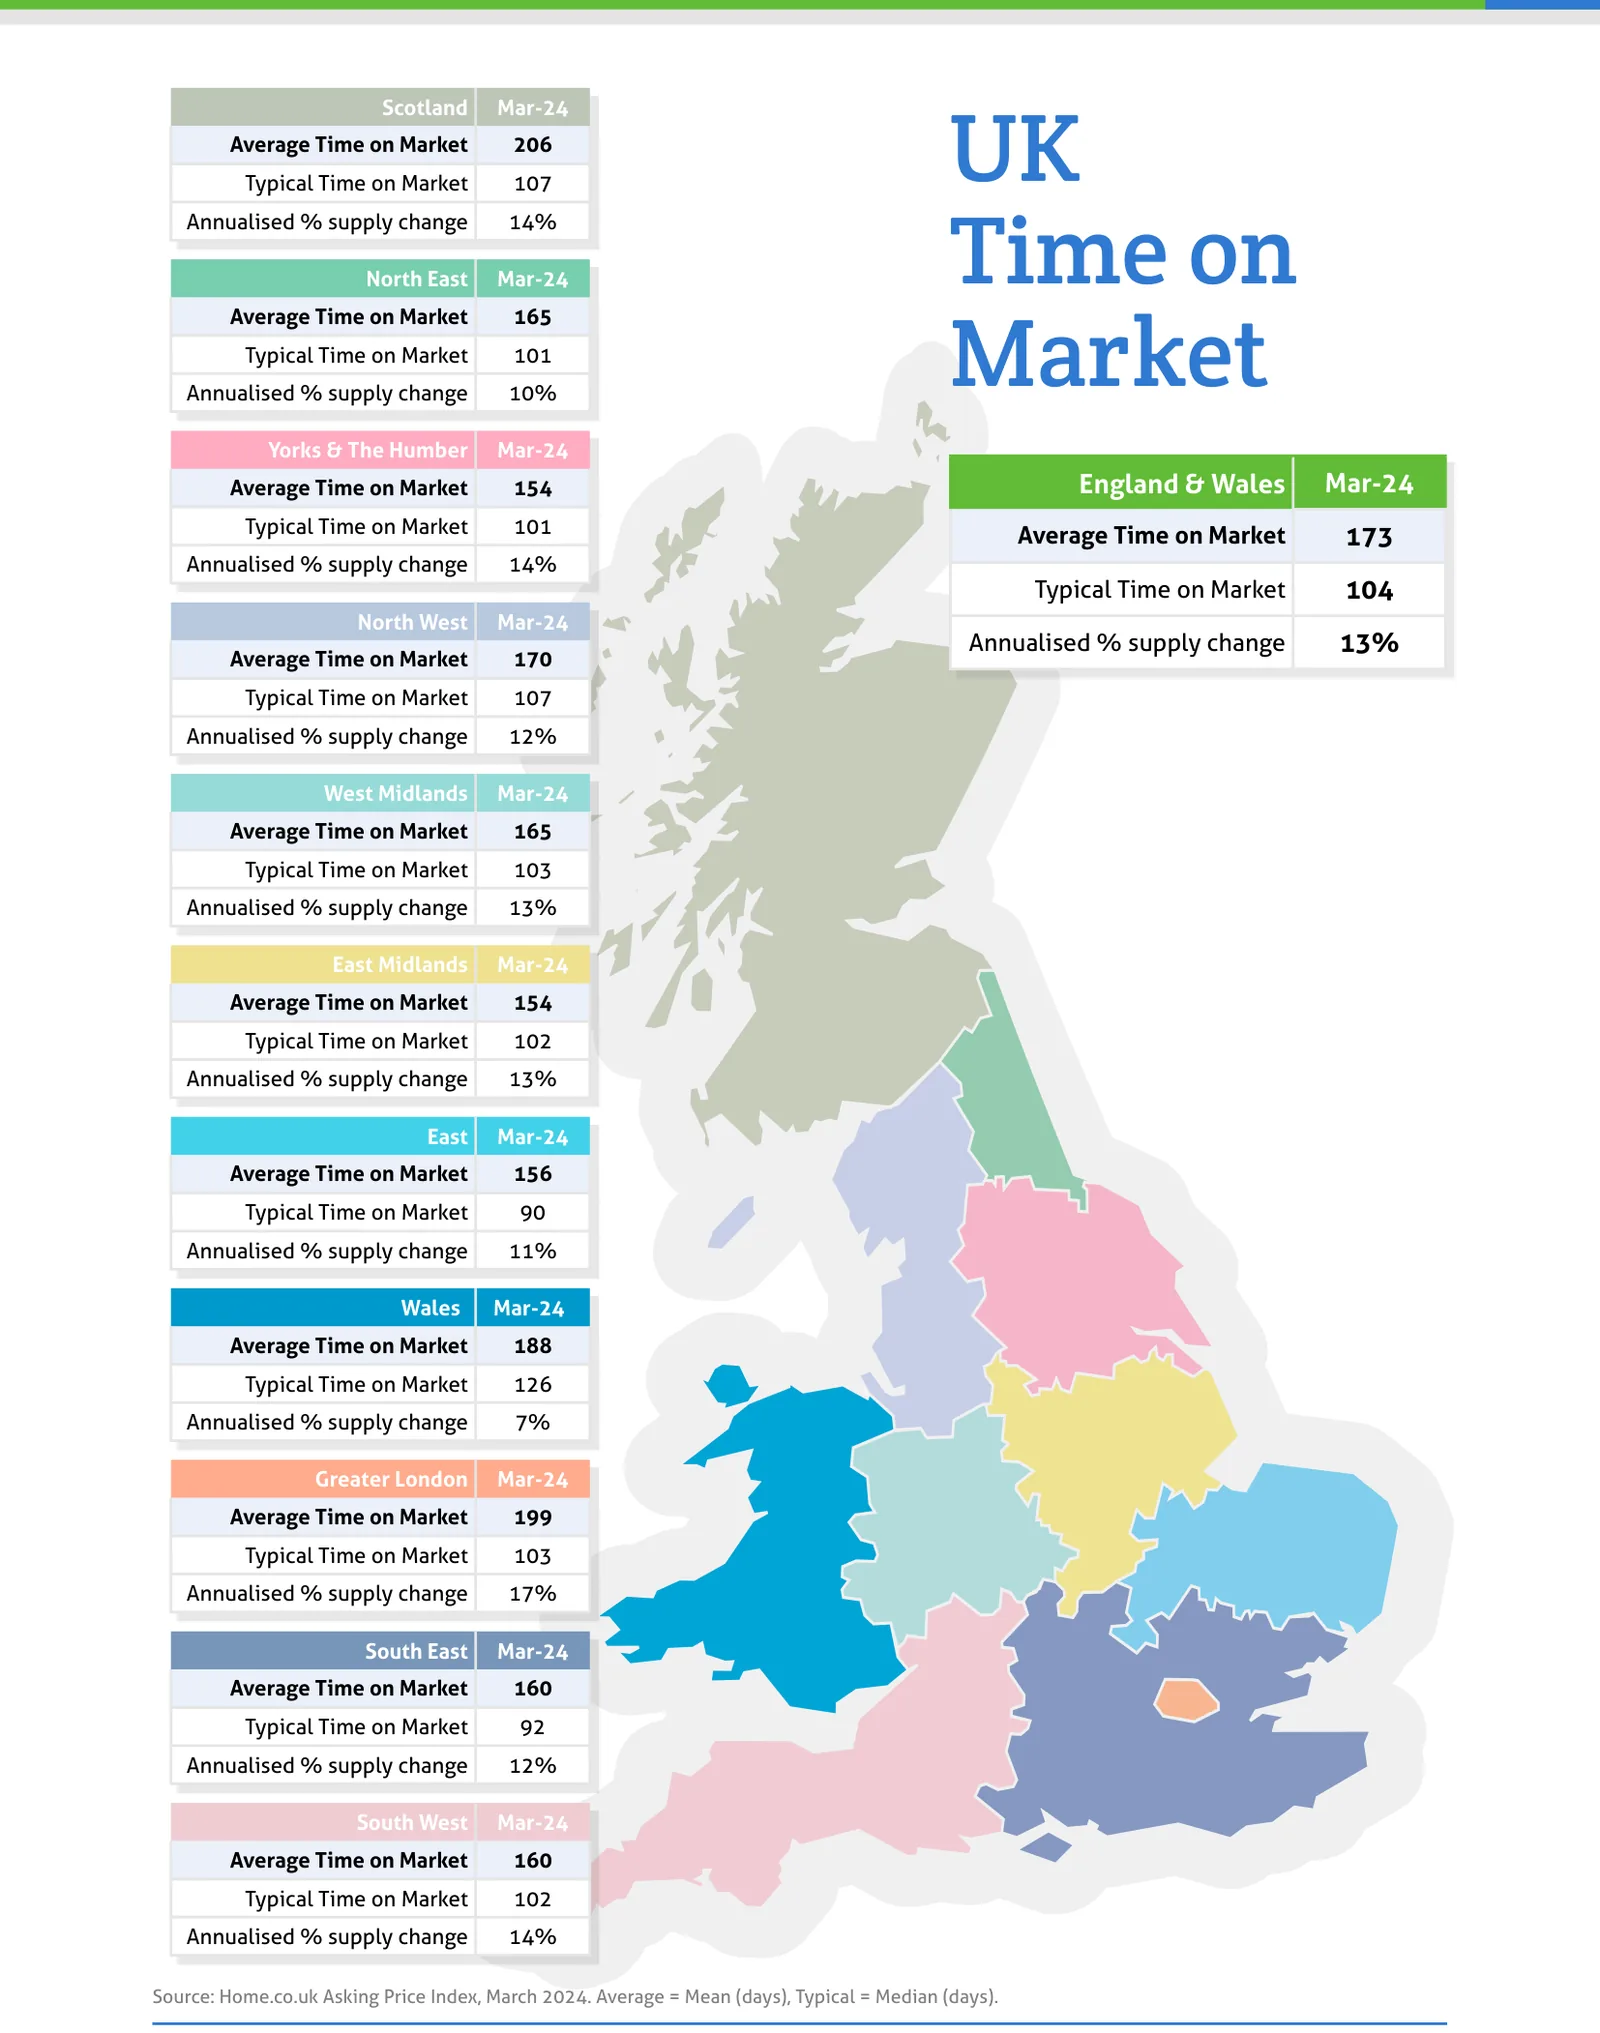
Source: Home.co.uk Asking Price Index, March 2024. Average = Mean (days), Typical = Median (days).
Regional tables
UK Asking Prices, Mar-24
| Region | Average Asking Price | Monthly % change | Annual % change |
|---|---|---|---|
| Scotland | £227,076 | 0.9% | 4.2% |
| North East | £192,174 | 0.6% | 2.2% |
| Yorks & The Humber | £246,476 | 0.7% | 1.3% |
| England & Wales | £351,282 | 0.4% | 0.1% |
| North West | £266,155 | 0.5% | 3.6% |
| West Midlands | £297,974 | 0.5% | 0.1% |
| East Midlands | £279,561 | 0.6% | -1.5% |
| East | £390,885 | 0.3% | -1.7% |
| Wales | £265,618 | 0.1% | 3.0% |
| Greater London | £538,715 | 0.2% | -0.7% |
| South East | £440,181 | 0.4% | 0.3% |
| South West | £372,031 | 0.2% | -1.5% |
UK Time on Market, Mar-24
| Region | Average Time on Market | Typical Time on Market | Annualised % supply change |
|---|---|---|---|
| Scotland | 206 | 107 | 14% |
| North East | 165 | 101 | 10% |
| Yorks & The Humber | 154 | 101 | 14% |
| England & Wales | 173 | 104 | 13% |
| North West | 170 | 107 | 12% |
| West Midlands | 165 | 103 | 13% |
| East Midlands | 154 | 102 | 13% |
| East | 156 | 90 | 11% |
| Wales | 188 | 126 | 7% |
| Greater London | 199 | 103 | 17% |
| South East | 160 | 92 | 12% |
| South West | 160 | 102 | 14% |
From the director's commentary
"Time will tell, of course, but if the BoE has inadvertently locked the UK into a sustained period of higher interest rates and possibly an economic depression, the UK property market will not return to significant growth any time soon."
Doug Shephard, Director at Home.co.uk
Read the full March 2024 edition (PDF, 10 pages)
About the Home Asking Price Index
The Home Asking Price Index measures the change in the prices sellers ask for residential property across England, Wales and Scotland. Today it is computed every month from around half a million advertised homes and is mix-adjusted, so a change in what happens to be on the market does not move the figure; earlier editions state the sample they were built from. Because an asking price is set months before a sale completes, the index runs around five months ahead of completed-sale measures such as the UK House Price Index.
Every edition in the archive, back to October 2006, is listed on the index page. How we measure the UK property market explains the listing data behind it, and today's figures by area are on house prices and rental prices.
Text and figures above are quoted from the March 2024 edition as published, with punctuation normalised for the web, and are not revised. Later editions may restate them.
More in What is happening to house prices: the Home guide
Thinking about your next move?
See what your home's worth in seconds, with the UK's longest-running property data behind it.
Get an instant valuation