

























Home Asking Price Index, March 2023: lower pricing triggers uptick in demand
Asking prices in England and Wales fell 0.6% in February, turning annual growth negative for the first time since December 2019, while Typical Time on Market fell to 95 days.
This is the March 2023 edition of the Home Asking Price Index, released on 15 March 2023, under the headline:
Lower Pricing Triggers Uptick in Demand
The headlines and summary below are the report's own words, with the key figures as it published them, followed by the report's charts and regional tables as printed.
Headlines
- Asking prices across England and Wales slipped a further 0.6% during February, making the year-on-year growth negative (-0.5%) for the first time since Dec 2019.
- The Typical Time on Market for unsold property in England and Wales dropped by five days during February to make the median 95 days, showing that the market is picking up pace as demand increases.
- Asking prices in February fell in Wales, Scotland and all English regions except the North West and West Midlands where there was no change.
- The total sales stock count for England and Wales increased in February by just 3,585 to reach 372,638, indicating that property remains scarce relative to the 10-year average of 422,668.
- The supply rate of new instructions remains subdued, dipping 1% last month compared to February 2022.
- The East of England shows a remarkable drop in Typical Time on Market from 91 to 78 days, which is considerably lower than it was in February 2019.
- The Scottish property market falls into second place in terms of annualised regional price growth (4.0%), behind the North West at 4.1%.
- Rents across Greater London continue to rise, up 21.4% year-on-year. Low supply is still a persistent problem although the pace of the rent hikes in the more central boroughs has slowed somewhat over recent months.
- The current new growth leaders in asking rents are the outer London boroughs of Brent, Harrow and Ealing (+35%, +34% and +32% annualised respectively).
Summary
Fears of a flood of panic sales prove to be unfounded as supply remains restrained. In fact, the monthly rate of new instructions is slightly down on February 2022. Meanwhile, the total stock of unsold property on the market is still below pre-COVID levels despite having recovered significantly following the unprecedented buyer frenzy of 2020/21.
Demand is supported by the mortgage market which currently offers many fixed-rate deals at 4% or less. Moreover, for those that can afford a deposit, real mortgage rates remain negative by quite a margin, irrespective of the measure of inflation (RPI or CPI) you prefer. Additionally, pay growth at 7.3% helps support lending based on earnings multiples.
Lower prices and lower mortgage rates have piqued buyer appetite. Returning buyer demand has reduced the Typical Time on Market by five days since last month and is a sure sign that the market is picking up pace in the wake of the Truss-Kwarteng debacle. This renewed momentum came at the cost of a price correction, effectively writing off all the gains of 2022 and a little more. However, with the froth of the COVID boom cleared from the market, UK home prices look set to consolidate over the coming months as demand and supply find a new equilibrium.
Key figures
| Measure | Figure |
|---|---|
| Monthly asking price change | -0.6% |
| Annual asking price change | -0.5% |
| Typical Time on Market | 95 days |
| Total unsold stock | 372,638 |
| Change in new instructions | -1% |
| Asking rent annual change (UK) | just over 17% |
| Fall from peak (national average) | 3.7% |
Figures are for England and Wales unless the report states otherwise, as published in the edition.
Charts from the report
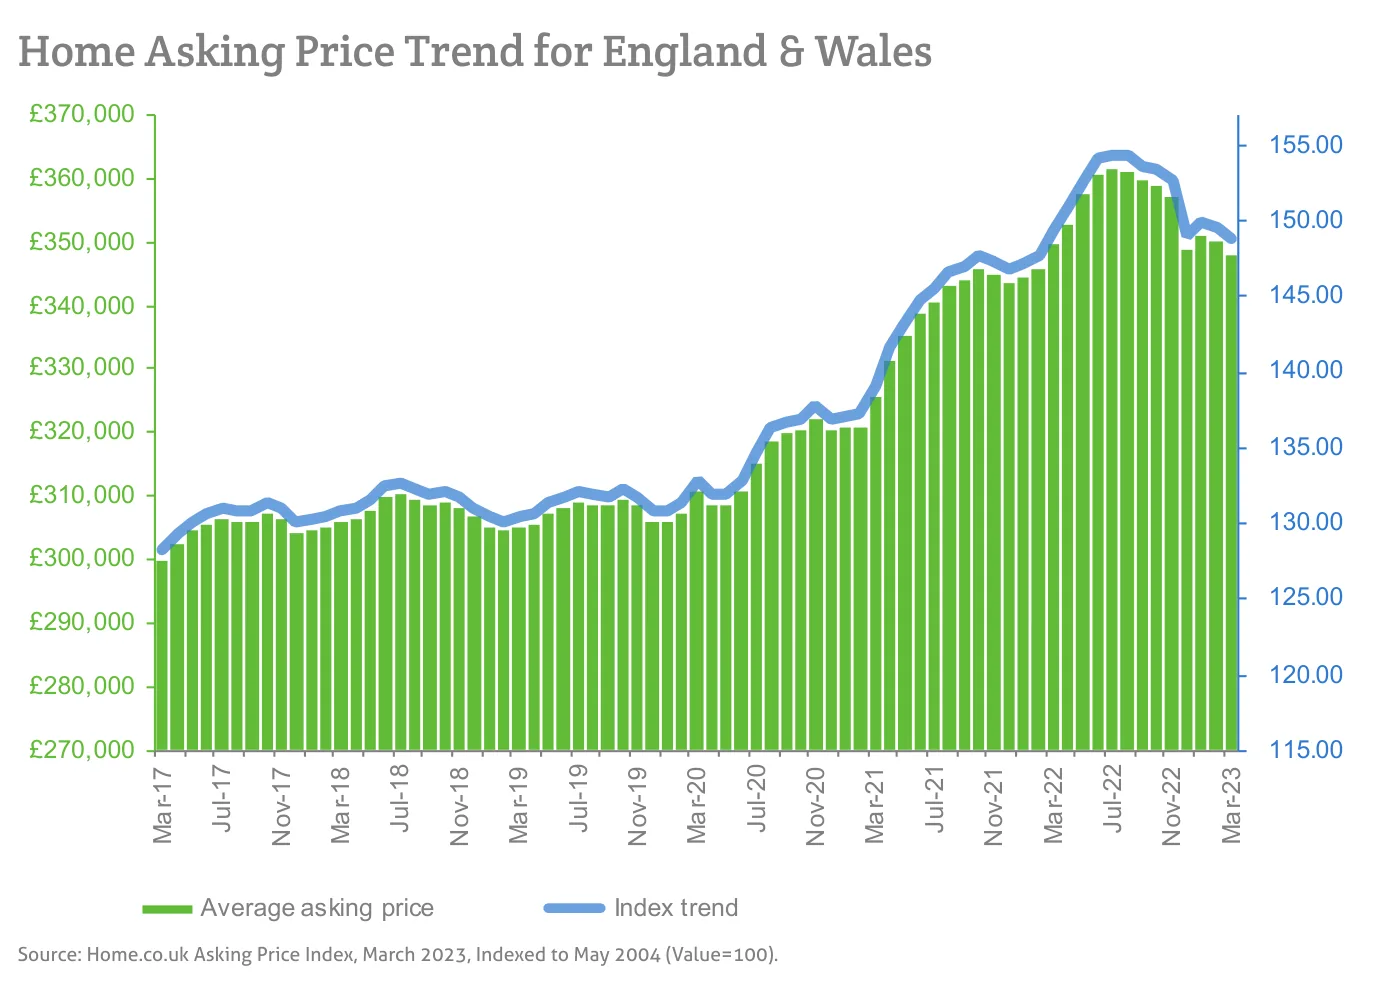
Source: Home.co.uk Asking Price Index, March 2023, Indexed to May 2004 (Value=100).
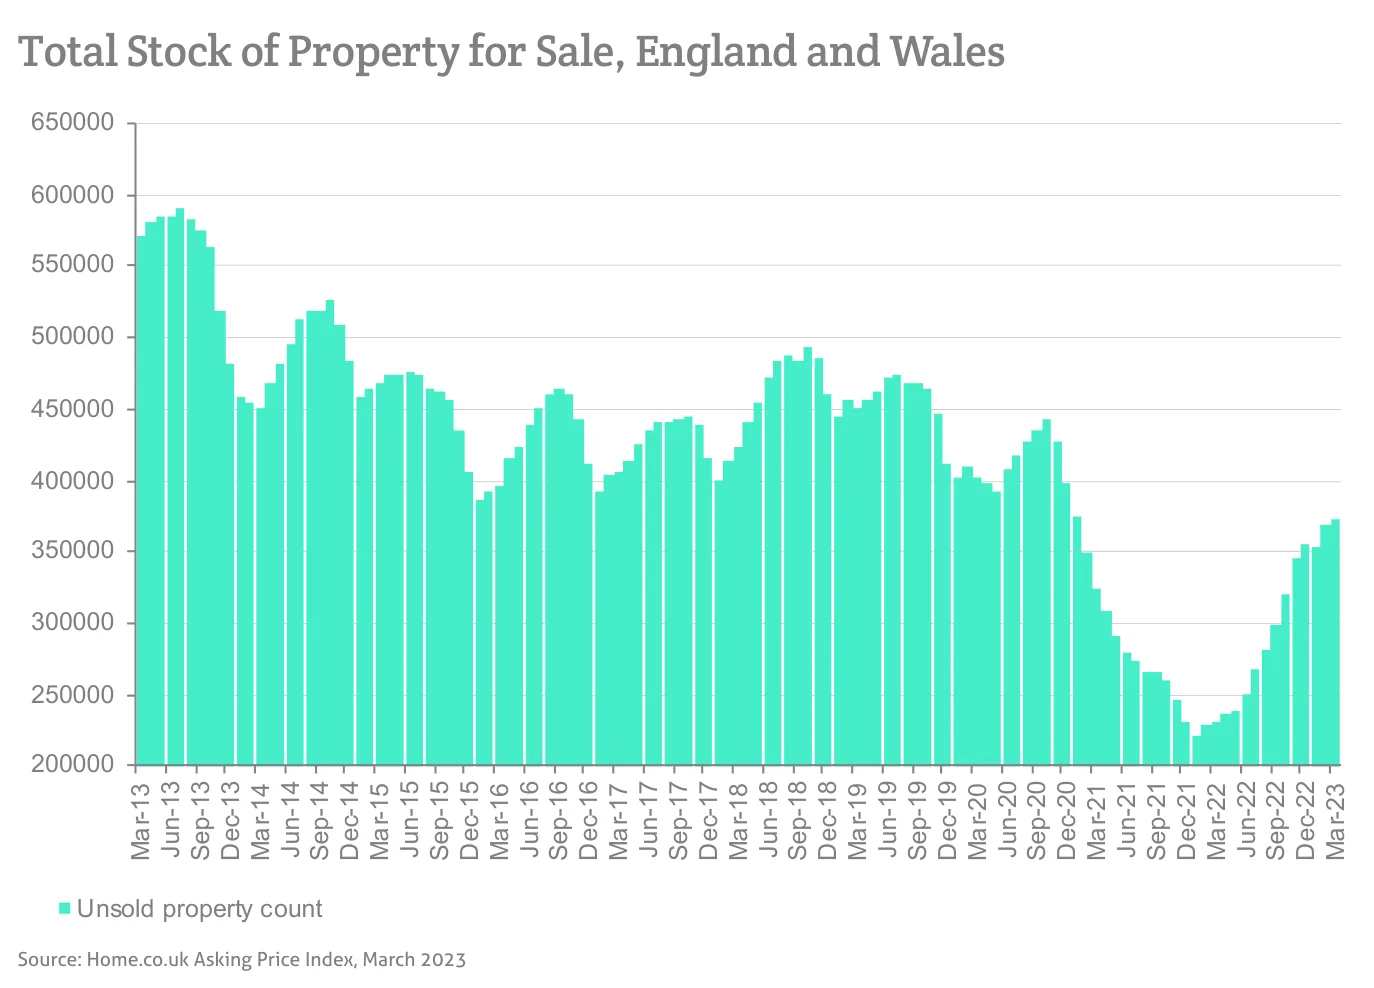
Source: Home.co.uk Asking Price Index, March 2023
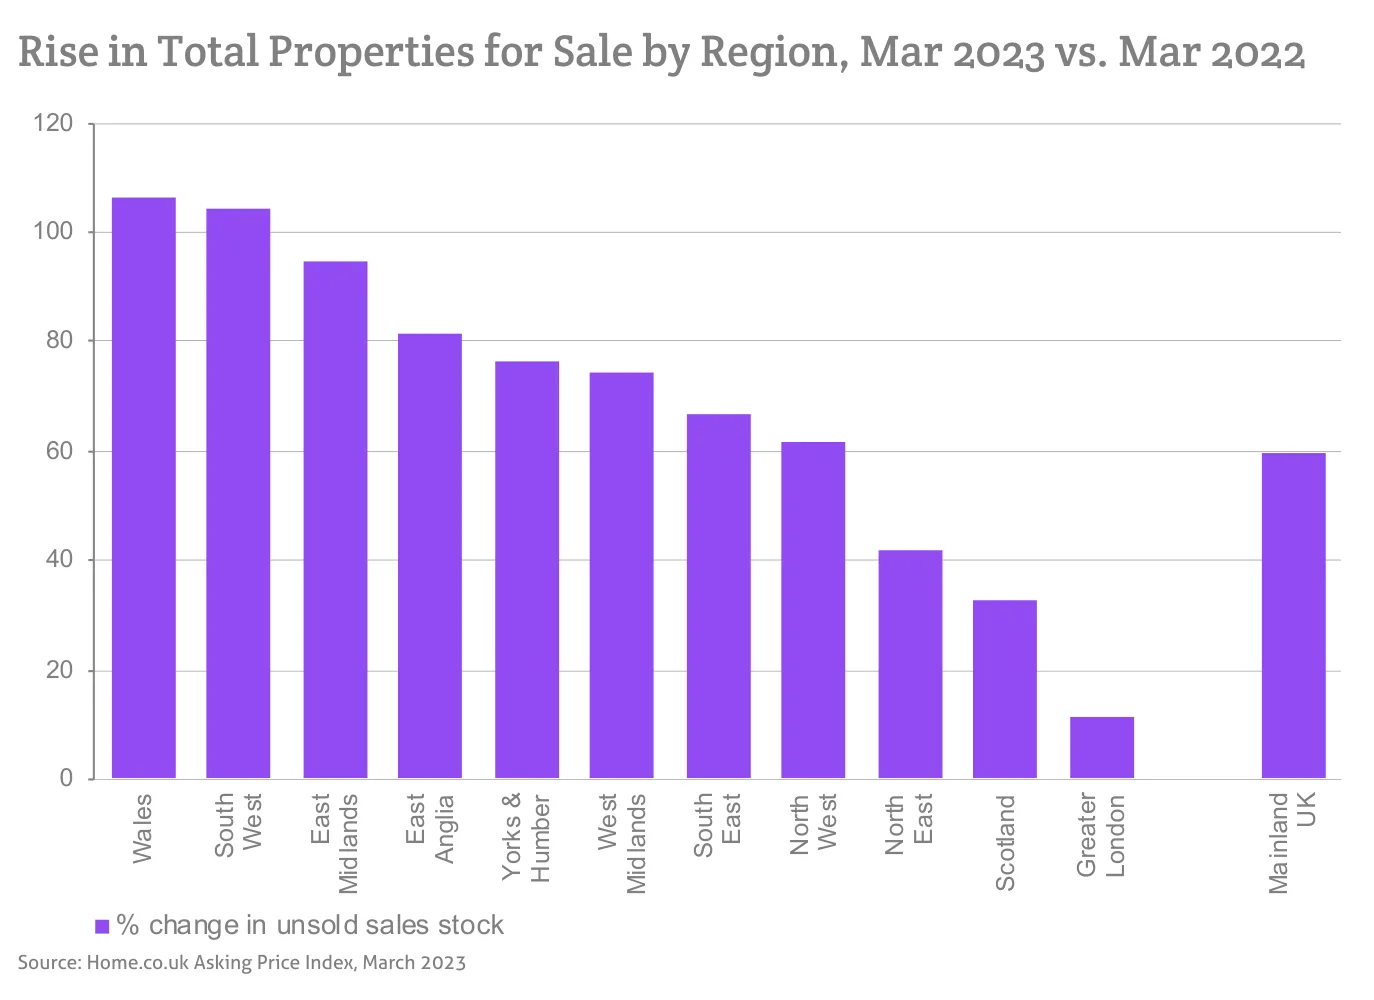
Source: Home.co.uk Asking Price Index, March 2023
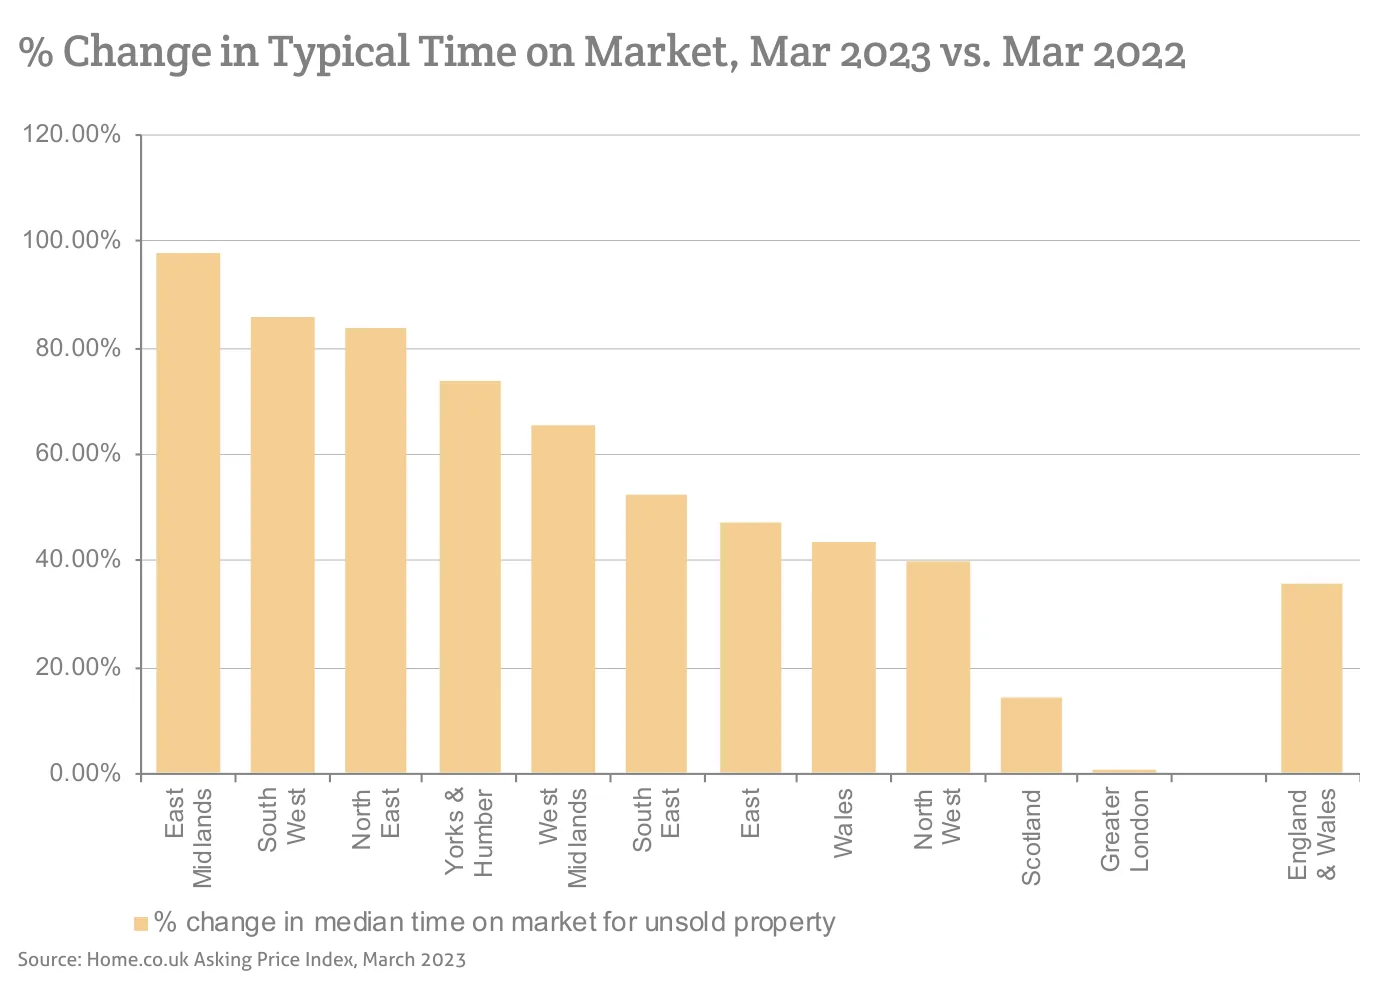
Source: Home.co.uk Asking Price Index, March 2023
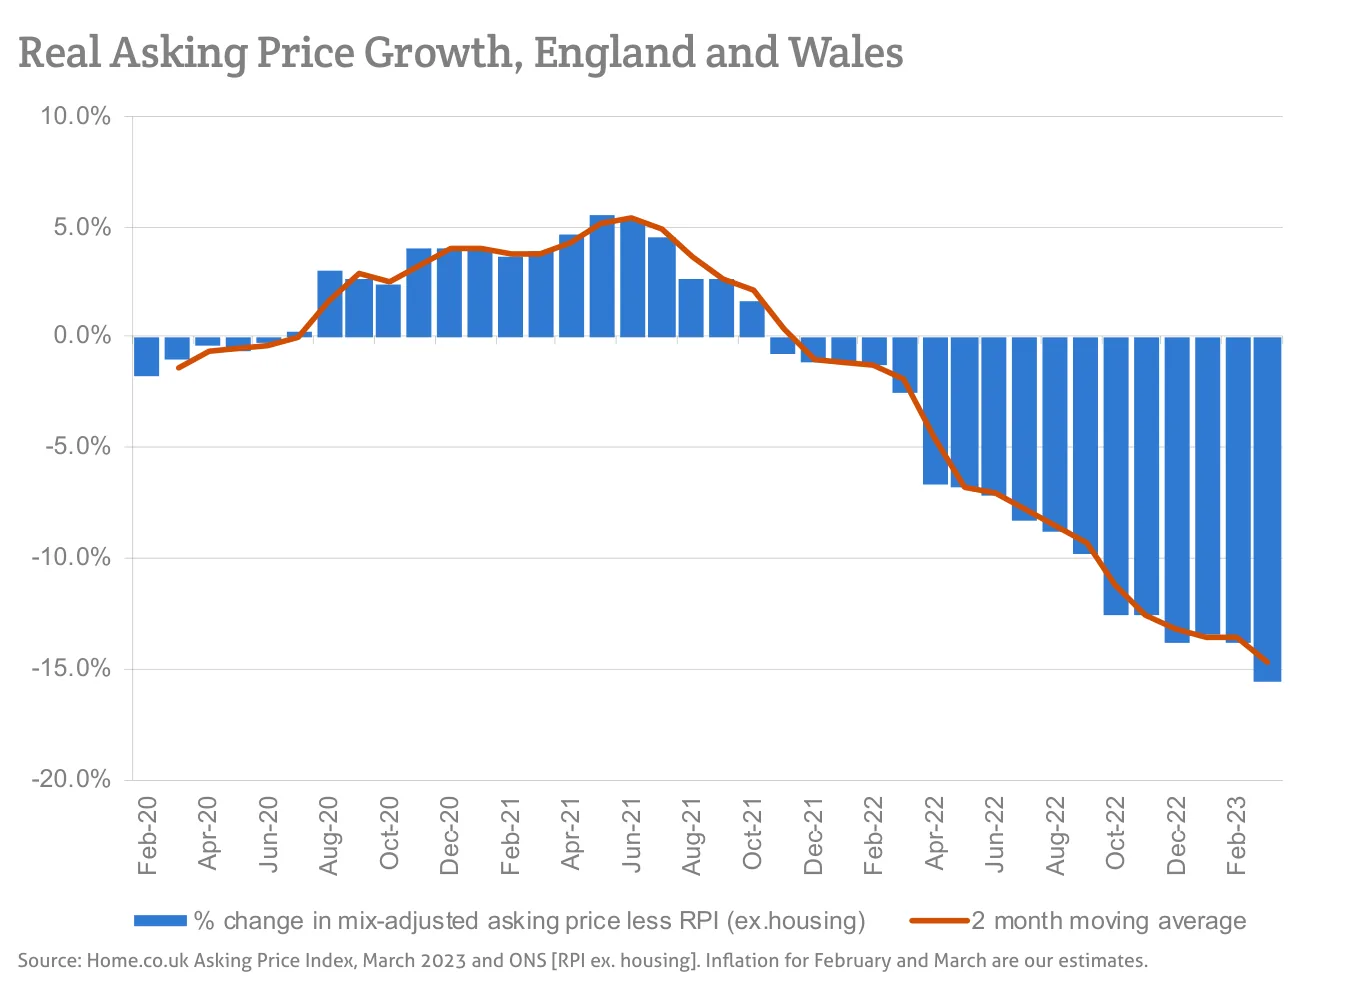
Source: Home.co.uk Asking Price Index, March 2023 and ONS [RPI ex. housing]. Inflation for February and March are our estimates.
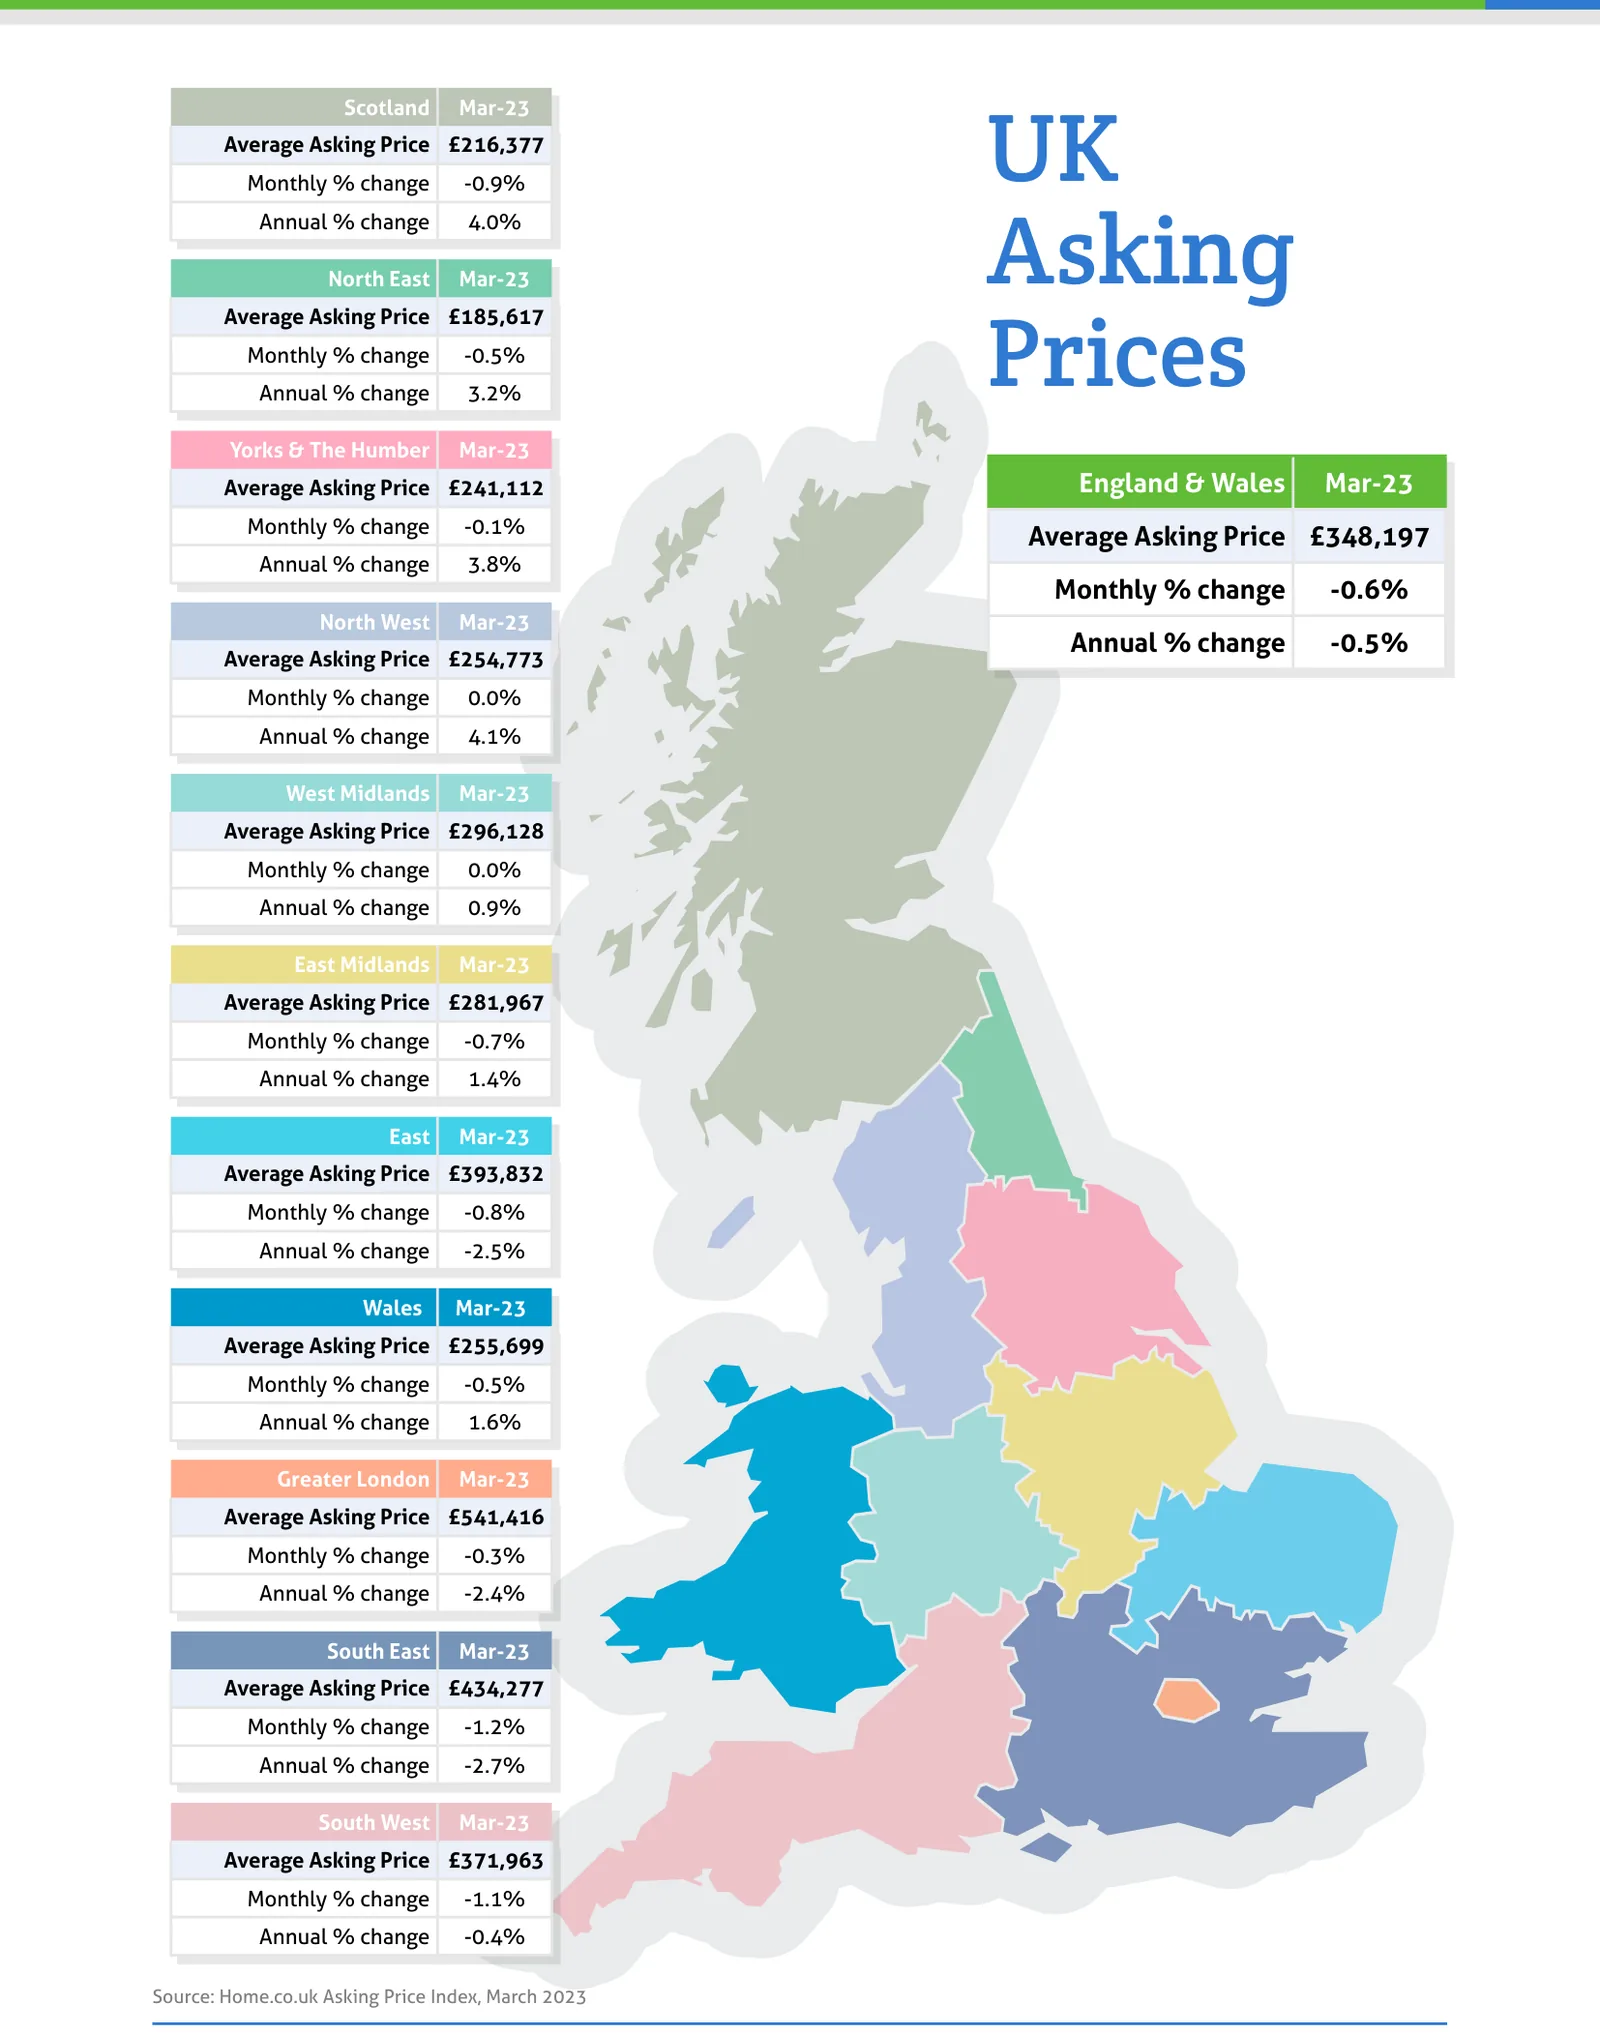
Source: Home.co.uk Asking Price Index, March 2023
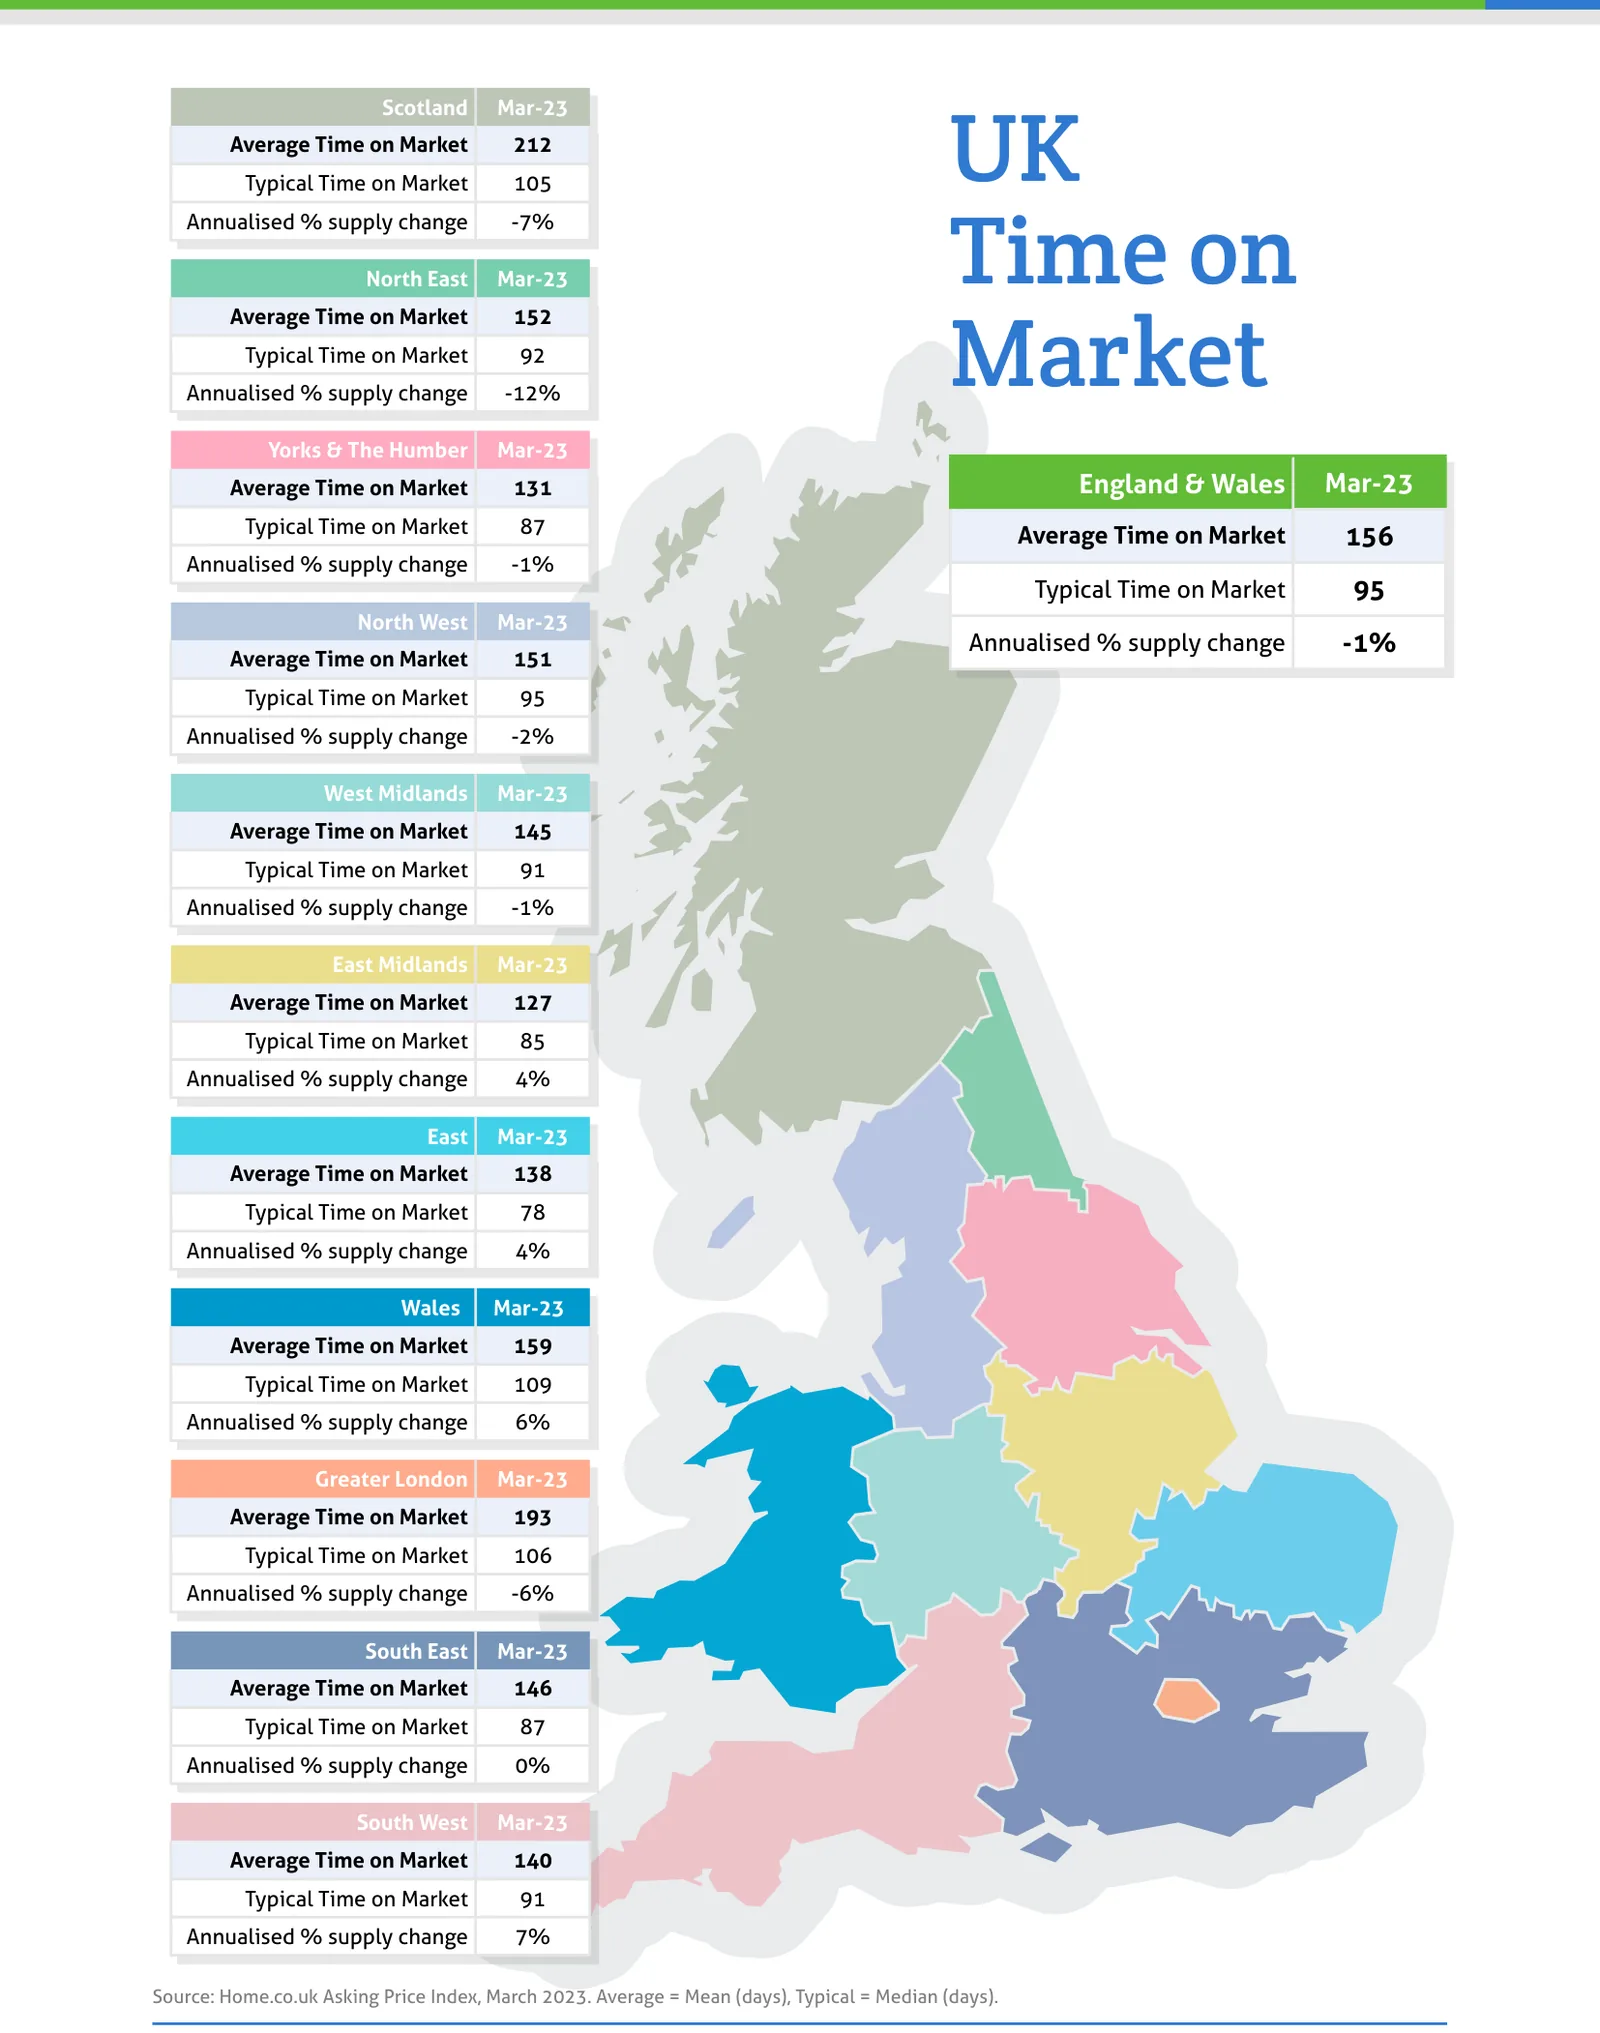
Source: Home.co.uk Asking Price Index, March 2023. Average = Mean (days), Typical = Median (days).
Regional tables
UK Asking Prices, Mar-23
| Region | Average Asking Price | Monthly % change | Annual % change |
|---|---|---|---|
| Scotland | £216,377 | -0.9% | 4.0% |
| North East | £185,617 | -0.5% | 3.2% |
| Yorks & The Humber | £241,112 | -0.1% | 3.8% |
| England & Wales | £348,197 | -0.6% | -0.5% |
| North West | £254,773 | 0.0% | 4.1% |
| West Midlands | £296,128 | 0.0% | 0.9% |
| East Midlands | £281,967 | -0.7% | 1.4% |
| East | £393,832 | -0.8% | -2.5% |
| Wales | £255,699 | -0.5% | 1.6% |
| Greater London | £541,416 | -0.3% | -2.4% |
| South East | £434,277 | -1.2% | -2.7% |
| South West | £371,963 | -1.1% | -0.4% |
UK Time on Market, Mar-23
| Region | Average Time on Market | Typical Time on Market | Annualised % supply change |
|---|---|---|---|
| Scotland | 212 | 105 | -7% |
| North East | 152 | 92 | -12% |
| Yorks & The Humber | 131 | 87 | -1% |
| England & Wales | 156 | 95 | -1% |
| North West | 151 | 95 | -2% |
| West Midlands | 145 | 91 | -1% |
| East Midlands | 127 | 85 | 4% |
| East | 138 | 78 | 4% |
| Wales | 159 | 109 | 6% |
| Greater London | 193 | 106 | -6% |
| South East | 146 | 87 | 0% |
| South West | 140 | 91 | 7% |
From the director's commentary
"Increased availability of mortgage credit and fixed-rate deals at below the Bank of England base rate have had the effect of reanimating UK home sales. Our key observation is not pricing but Typical Time on Market for unsold property."
Doug Shephard, Director at Home.co.uk
Read the full March 2023 edition (PDF, 10 pages)
About the Home Asking Price Index
The Home Asking Price Index measures the change in the prices sellers ask for residential property across England, Wales and Scotland. Today it is computed every month from around half a million advertised homes and is mix-adjusted, so a change in what happens to be on the market does not move the figure; earlier editions state the sample they were built from. Because an asking price is set months before a sale completes, the index runs around five months ahead of completed-sale measures such as the UK House Price Index.
Every edition in the archive, back to October 2006, is listed on the index page. How we measure the UK property market explains the listing data behind it, and today's figures by area are on house prices and rental prices.
Text and figures above are quoted from the March 2023 edition as published, with punctuation normalised for the web, and are not revised. Later editions may restate them.
More in What is happening to house prices: the Home guide
Thinking about your next move?
See what your home's worth in seconds, with the UK's longest-running property data behind it.
Get an instant valuation