

























Home Asking Price Index, March 2021: home prices and rents leap amidst property drought
Asking prices across England and Wales rose 1.4% in February, pushing annual growth to 4.8%, while new instructions fell 27% year-on-year to a record low.
This is the March 2021 edition of the Home Asking Price Index, released on 12 March 2021, under the headline:
Home Prices and Rents Leap Amidst Property Drought
The headlines and summary below are the report's own words, with the key figures as it published them, followed by the report's charts and regional tables as printed.
Headlines
- Asking prices across England and Wales surge 1.4% since last month pushing annualised growth up to 4.8%.
- February indicated a further dramatic shortfall in new sales listings due to the latest COVID lockdown. New instructions were down 27% year-on-year (same as in January) and again gave a new record low for the month in the history of this Index.
- Supply is down as much as 36% in some regions (East of England and the South West) but Greater London is the exception with new listings down a mere 2% compared to February 2020.
- Correspondingly, the total stock of property for sale in England and Wales has again fallen to set a further record low, 19.4% lower than in March 2020.
- Lack of supply has pushed up prices in every English region and Scotland and Wales since last month, with the largest hike in the South East; a massive 2.5%.
- The northern property markets continue to lead the 12-month regional growth chart, with Yorkshire and Humber showing a remarkable price rise of 9.1%.
- Welsh home prices have rallied the most over the last six months, boosting the annualised growth to 7.9%.
- Greater London is currently the UK's worst-performing region with only 2.7% annualised growth. Next is the South West where prices have risen only 3.7% over the last twelve months.
- The lockdown has meant market momentum has slowed a little with the Typical Time on Market for unsold property in England and Wales rising two days since last month to 113 days, counter to the normal seasonal trend. This figure is just two days more than in March 2020.
- Rents continue to crash in the Greater London lettings market due to oversupply, down 18.6% year-on-year overall compared to 2020, although several more central boroughs registered reductions in the average rent of around 30%.
- By contrast, unprecedented scarcity is evident in all other English regions, Scotland and Wales, thereby driving up rents. Some regions such as the East Midlands indicate drops of over 50% in the total of newly available rental properties entering the market compared to a year ago.
- The largest annualised rent hikes are in the South West (+17.8%) and the West Midlands (+20.5%).
Summary
The headline growth figure of 4.8%, whilst both remarkable and reassuring given these turbulent times, is a national average. To glean a more detailed understanding of the current market dynamic, we must drill down to the regional level. Supply, of course, is a fundamental indicator and the last two months' data show that the latest lockdown has had a highly disproportionate effect.
London prices are already on the back foot. Overall averages for Greater London hide the fact that the median flat price within a 10-mile radius of the centre has fallen 7% over the last twelve months, while in prime central areas such as Belgravia the median asking price has dropped as much as 15%. We expect prices in central areas of the capital to continue to slide as rental yields collapse despite the recently announced market stimulus measures.
Sales stock shortages are now forcing up prices outside of London. Moreover, given the Stamp Duty holiday extension (till the end of June) and the government's pledge to back 95% mortgages, home prices look set to go ballistic in the regions as demand looks set to completely overwhelm the little supply there is.
Key figures
| Measure | Figure |
|---|---|
| Monthly asking price change | +1.4% |
| Annual asking price growth | +4.8% |
| New instructions change (year-on-year) | -27% |
| Total unsold stock vs March 2020 | -19.4% |
| Typical Time on Market | 113 days |
| Annual growth in March 2020 (comparison) | 1.8% |
Figures are for England and Wales unless the report states otherwise, as published in the edition.
Charts from the report
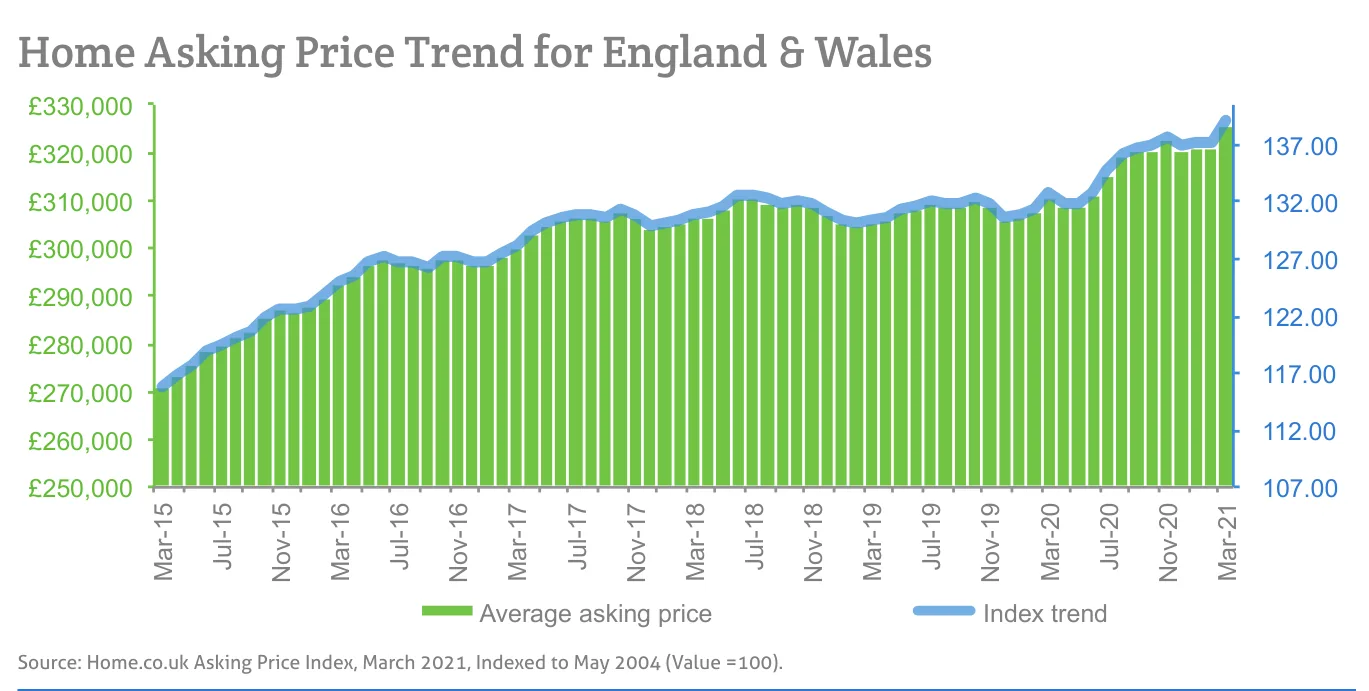
Source: Home.co.uk Asking Price Index, March 2021, Indexed to May 2004 (Value =100).
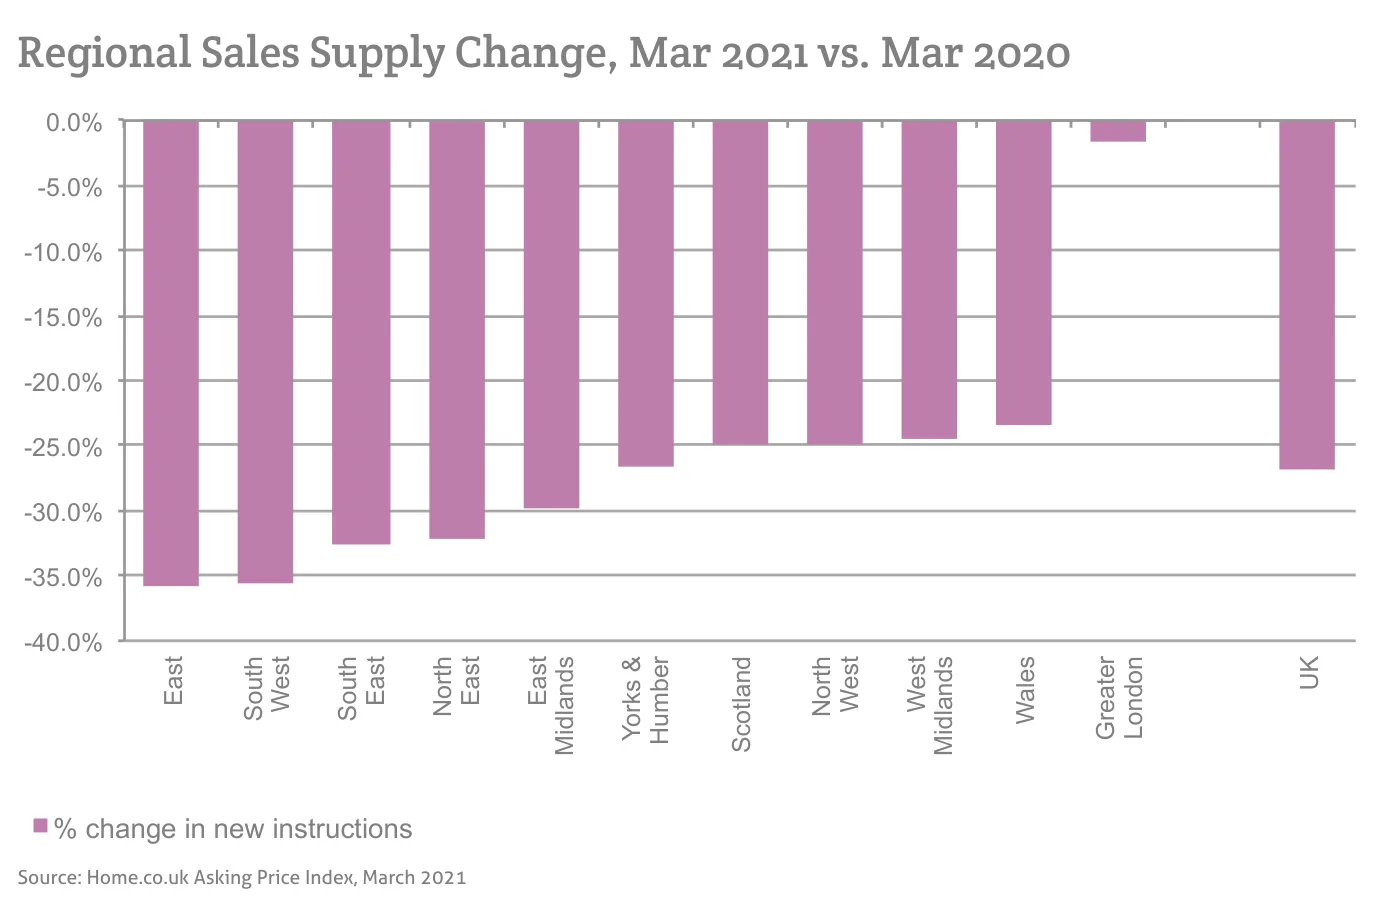
Source: Home.co.uk Asking Price Index, March 2021
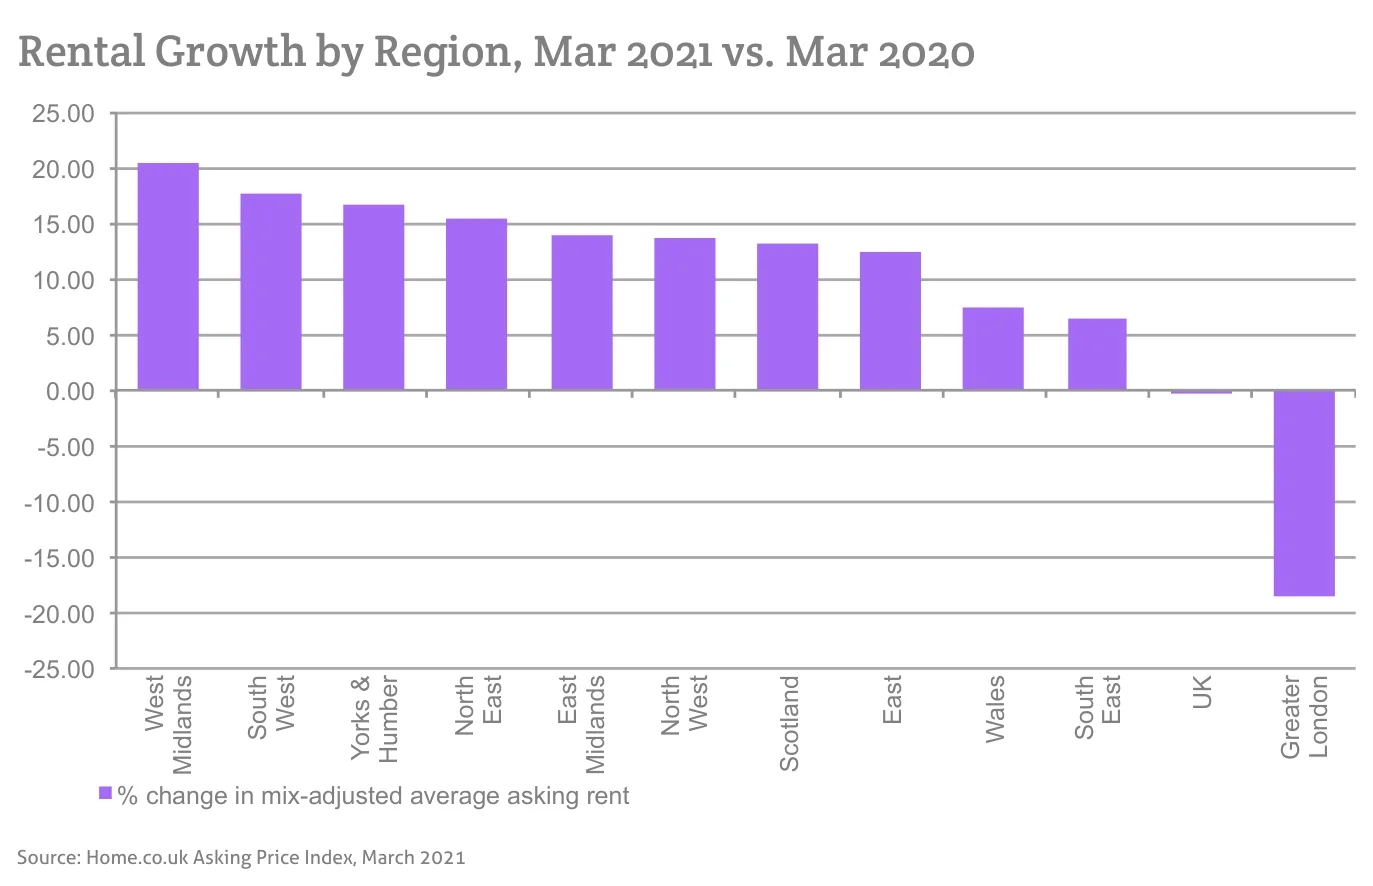
Source: Home.co.uk Asking Price Index, March 2021
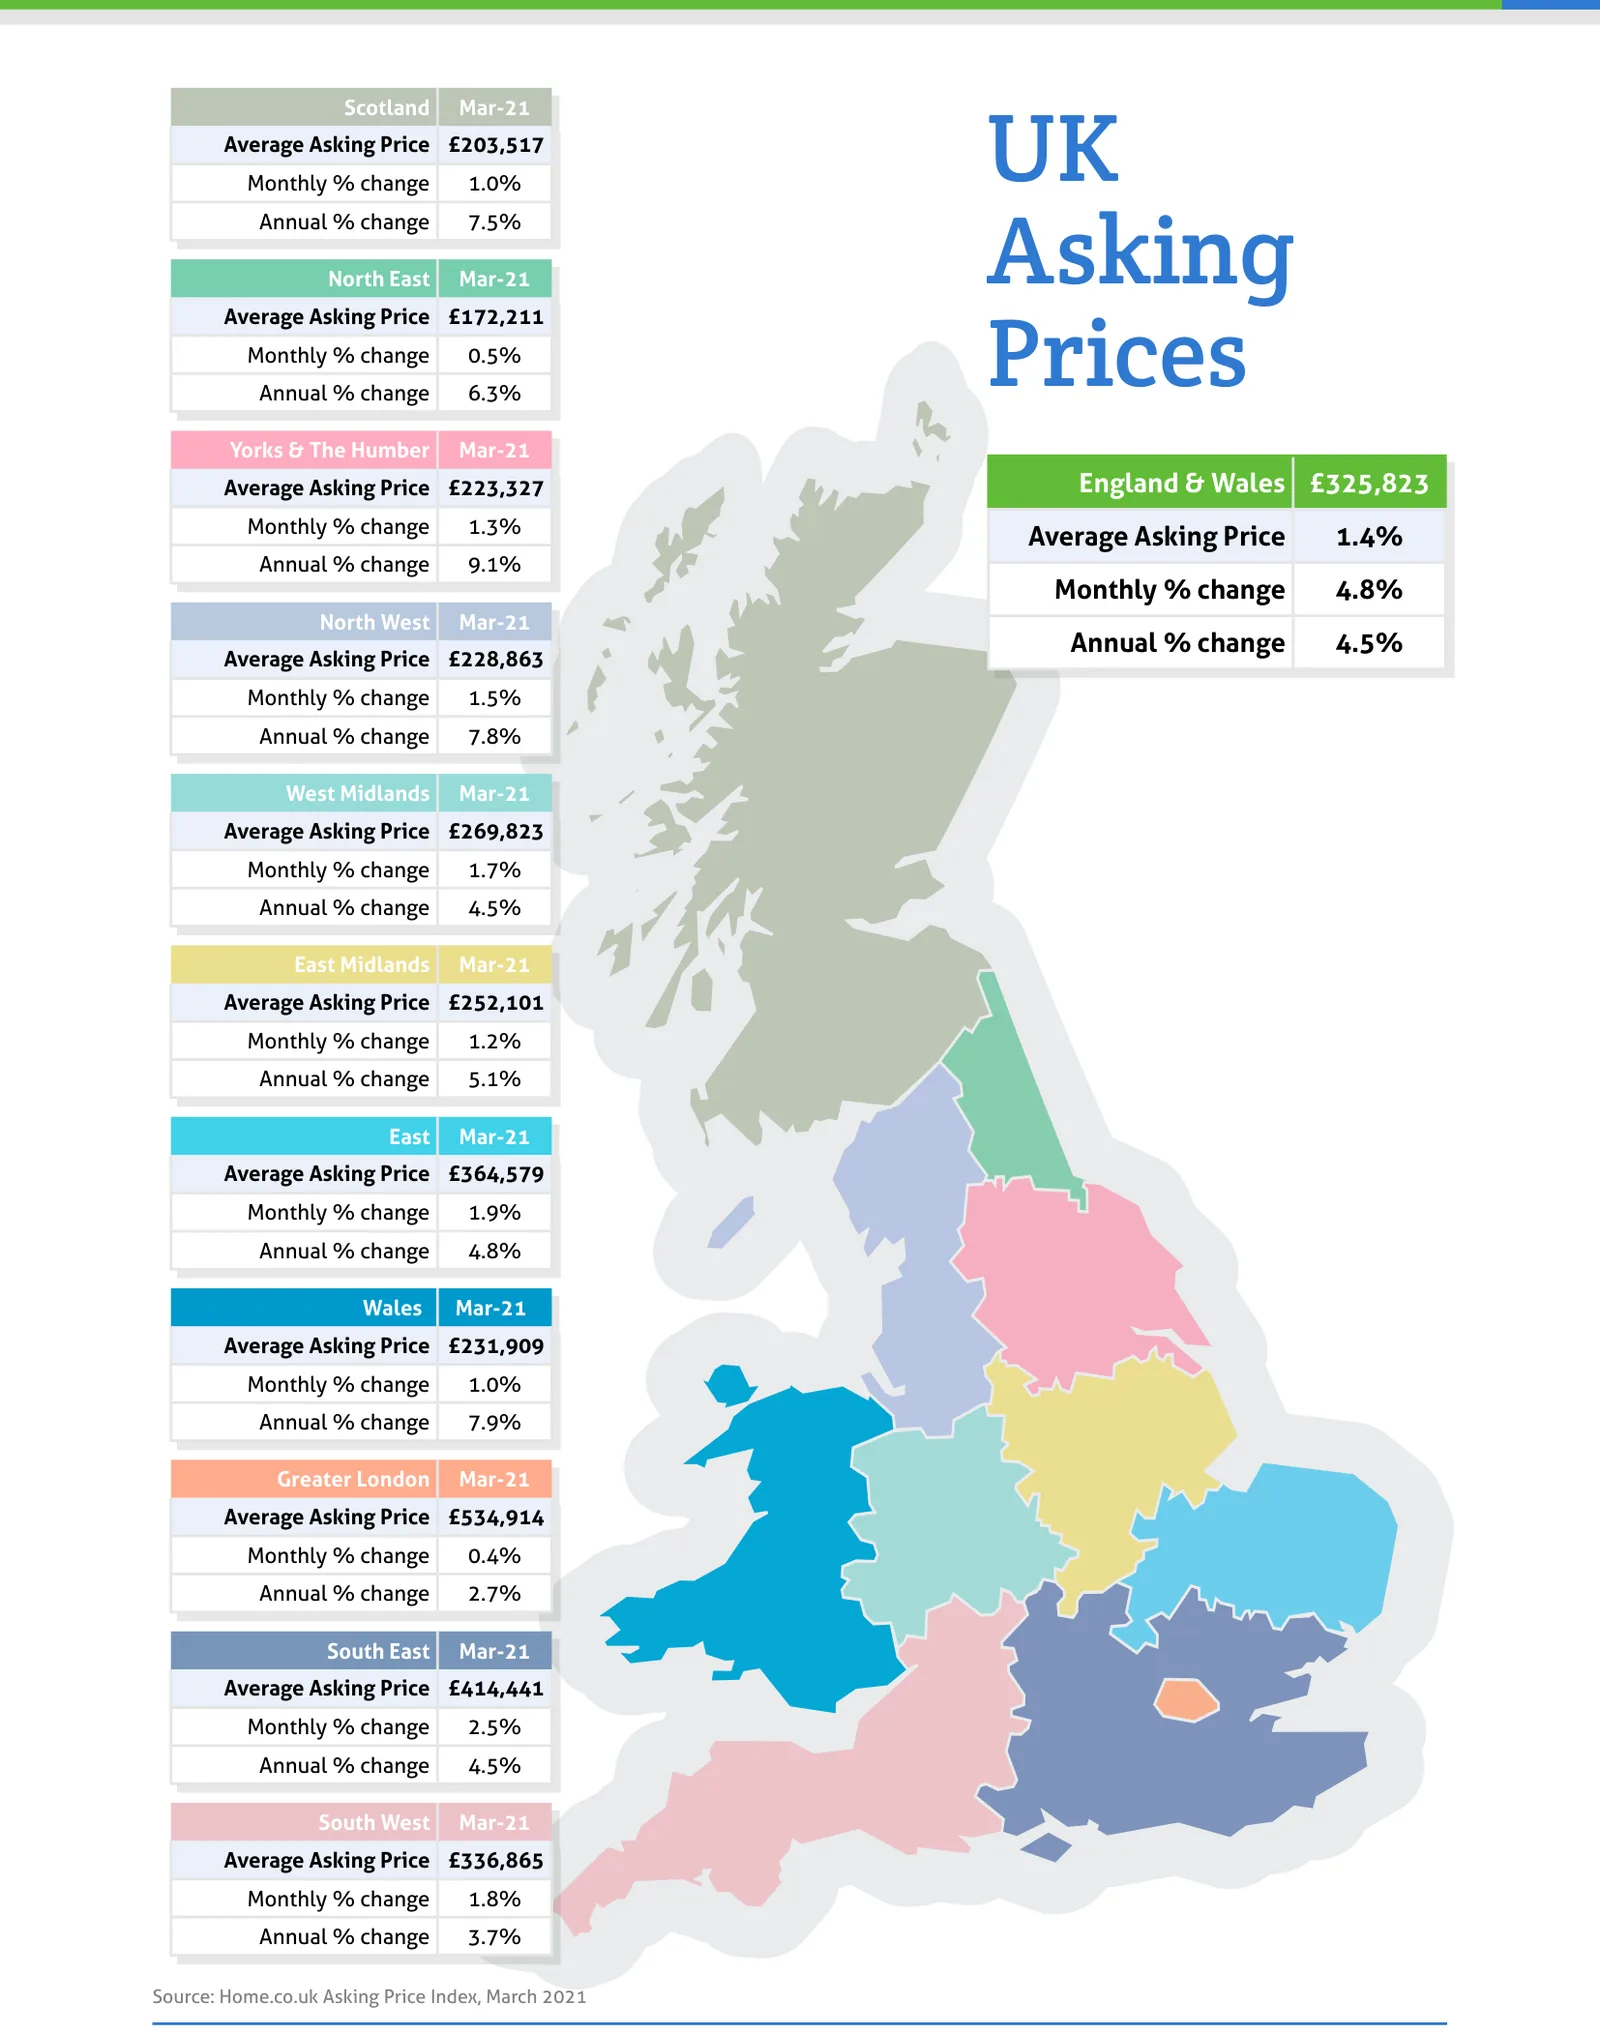
Source: Home.co.uk Asking Price Index, March 2021
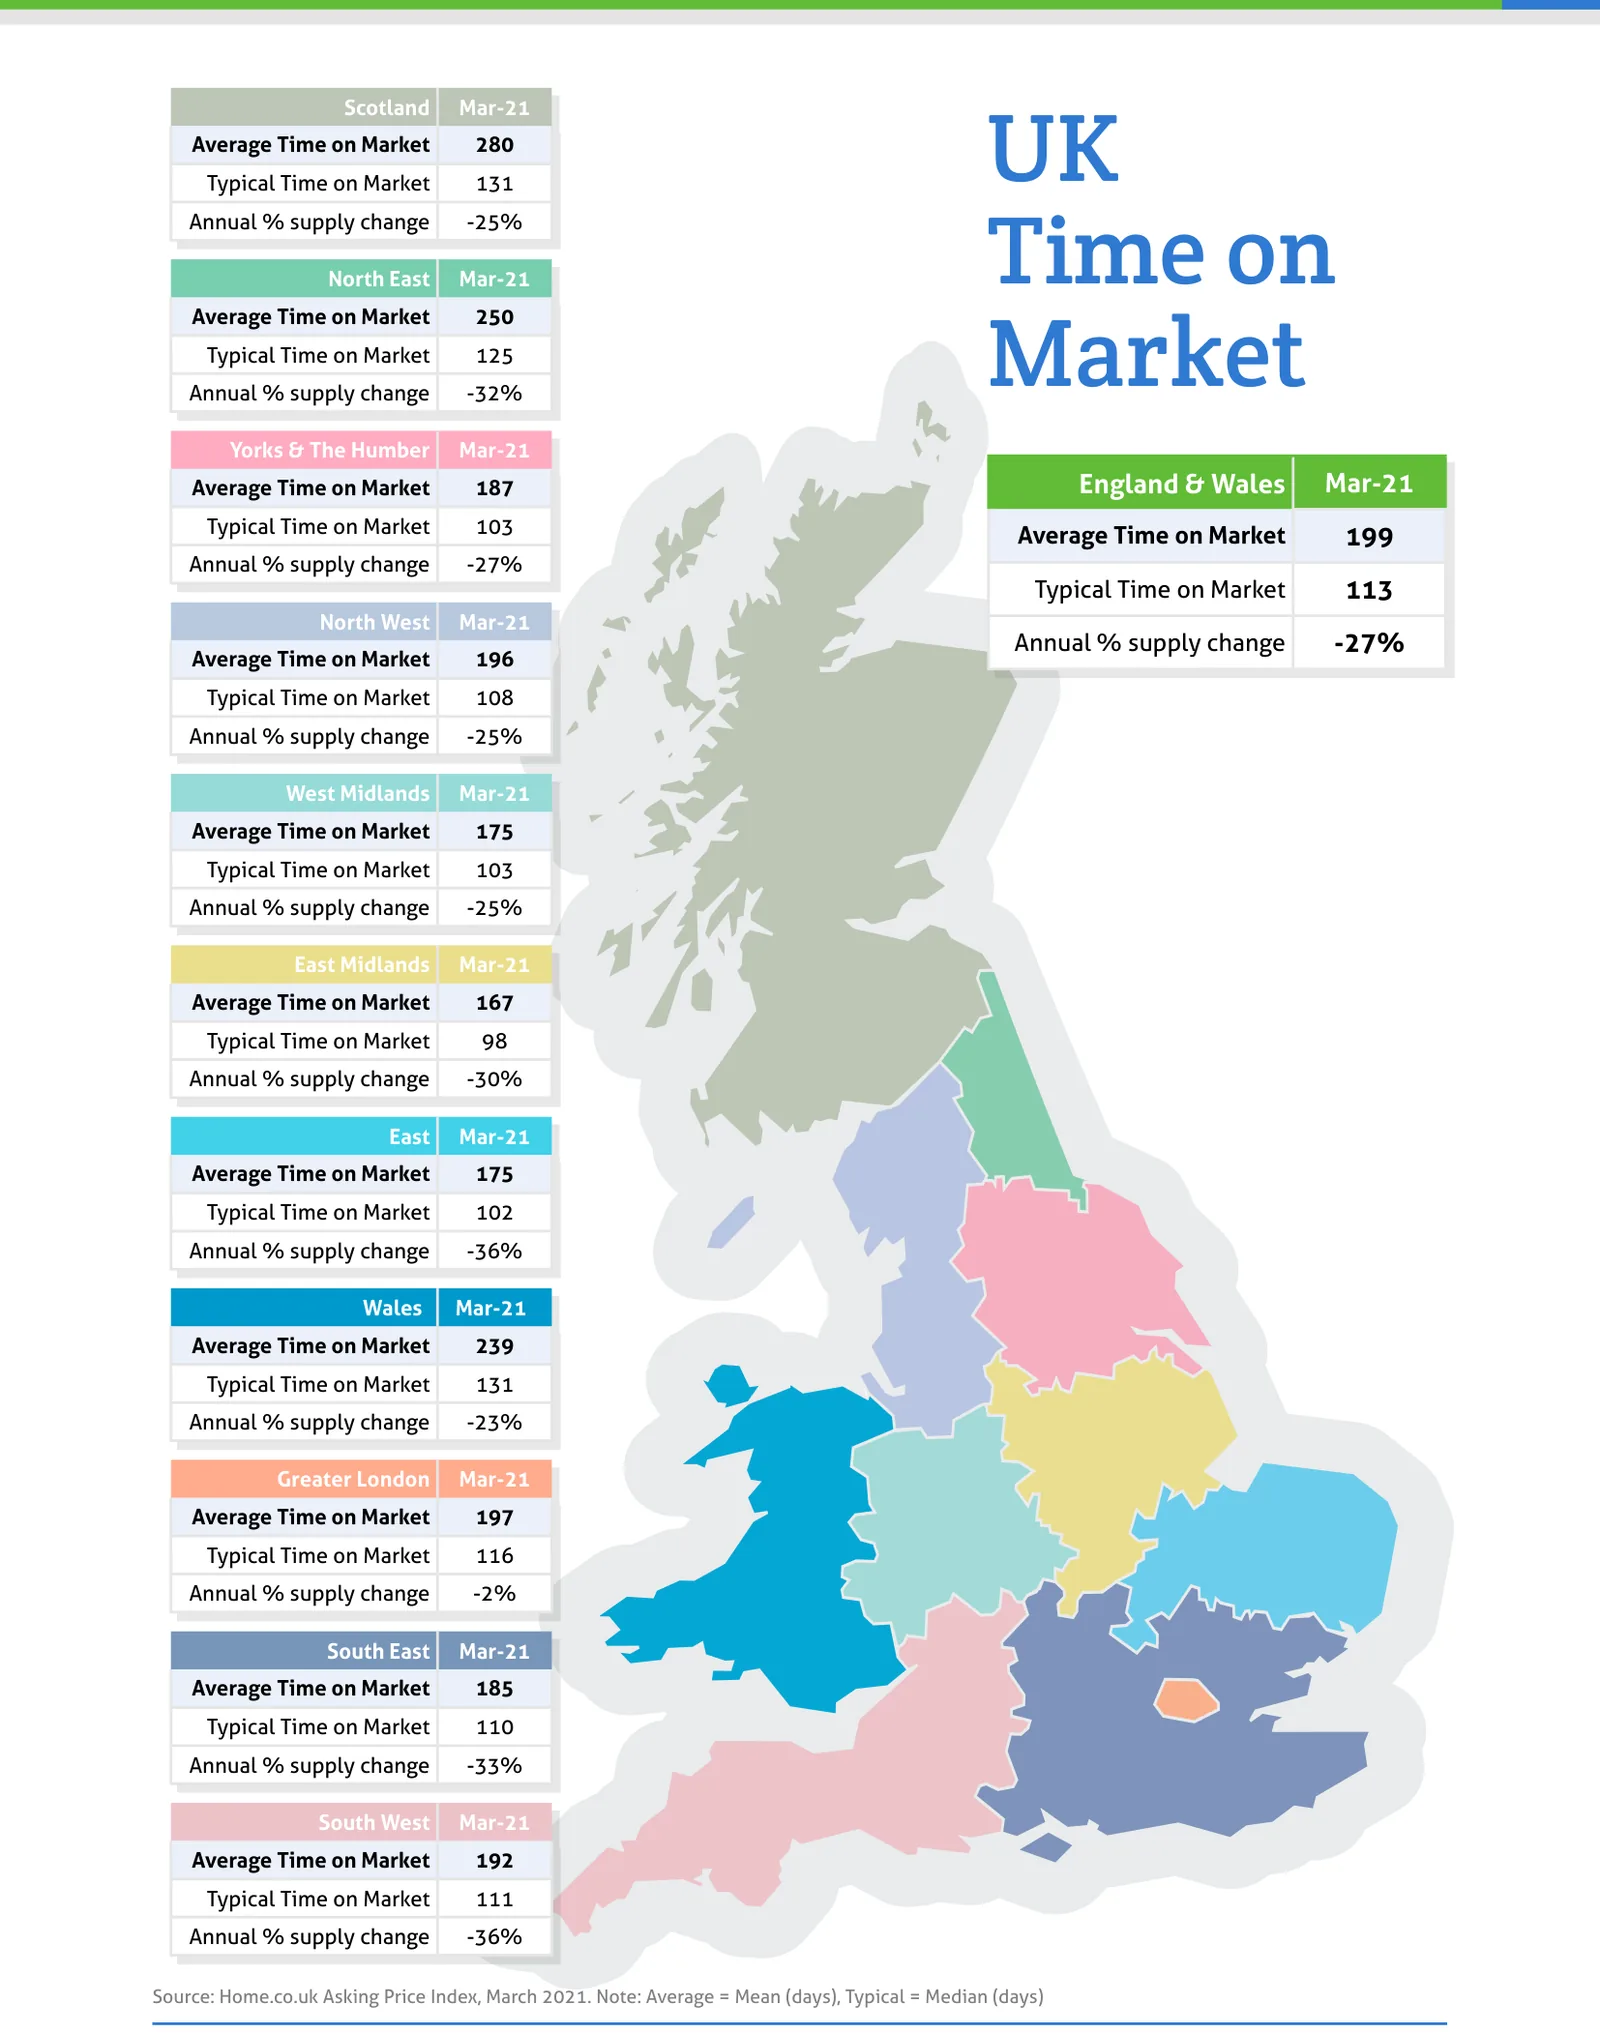
Source: Home.co.uk Asking Price Index, March 2021. Note: Average = Mean (days), Typical = Median (days)
Regional tables
UK Asking Prices, Mar-21
| Region | Average Asking Price | Monthly % change | Annual % change |
|---|---|---|---|
| Scotland | £203,517 | 1.0% | 7.5% |
| North East | £172,211 | 0.5% | 6.3% |
| Yorks & The Humber | £223,327 | 1.3% | 9.1% |
| England & Wales | n/a | n/a | n/a |
| North West | £228,863 | 1.5% | 7.8% |
| West Midlands | £269,823 | 1.7% | 4.5% |
| East Midlands | £252,101 | 1.2% | 5.1% |
| East | £364,579 | 1.9% | 4.8% |
| Wales | £231,909 | 1.0% | 7.9% |
| Greater London | £534,914 | 0.4% | 2.7% |
| South East | £414,441 | 2.5% | 4.5% |
| South West | £336,865 | 1.8% | 3.7% |
The England & Wales box in this edition is misprinted: £325,823 sits in its header row and the labels beneath read Average Asking Price 1.4%, Monthly % change 4.8%, Annual % change 4.5%. The row is left blank rather than set against the wrong labels.
UK Time on Market, Mar-21
| Region | Average Time on Market | Typical Time on Market | Annual % supply change |
|---|---|---|---|
| Scotland | 280 | 131 | -25% |
| North East | 250 | 125 | -32% |
| Yorks & The Humber | 187 | 103 | -27% |
| England & Wales | 199 | 113 | -27% |
| North West | 196 | 108 | -25% |
| West Midlands | 175 | 103 | -25% |
| East Midlands | 167 | 98 | -30% |
| East | 175 | 102 | -36% |
| Wales | 239 | 131 | -23% |
| Greater London | 197 | 116 | -2% |
| South East | 185 | 110 | -33% |
| South West | 192 | 111 | -36% |
From the director's commentary
"While the UK's vaccination program may be hailed as a great success (certainly when measured by the yardstick of mainland Europe), further stimulus for the property market may well be courting disaster."
Doug Shephard, Director at Home.co.uk
Read the full March 2021 edition (PDF, 7 pages)
About the Home Asking Price Index
The Home Asking Price Index measures the change in the prices sellers ask for residential property across England, Wales and Scotland. Today it is computed every month from around half a million advertised homes and is mix-adjusted, so a change in what happens to be on the market does not move the figure; earlier editions state the sample they were built from. Because an asking price is set months before a sale completes, the index runs around five months ahead of completed-sale measures such as the UK House Price Index.
Every edition in the archive, back to October 2006, is listed on the index page. How we measure the UK property market explains the listing data behind it, and today's figures by area are on house prices and rental prices.
Text and figures above are quoted from the March 2021 edition as published, with punctuation normalised for the web, and are not revised. Later editions may restate them.
More in What is happening to house prices: the Home guide
Thinking about your next move?
See what your home's worth in seconds, with the UK's longest-running property data behind it.
Get an instant valuation