

























Home Asking Price Index, March 2019: no sign of Brexit panic as caution crimps supply
UK average asking prices edged up 0.2% month on month but fell 0.3% annually, while new instructions dropped 4% year-on-year amid Brexit caution.

This is the March 2019 edition of the Home Asking Price Index, released on 12 March 2019, under the headline:
No Sign of Brexit Panic as Caution Crimps Supply
The headlines and summary below are the report's own words, with the key figures as it published them, followed by the report's charts and regional tables as printed.
Headlines
- Supply of UK instructions is down 4% year-on-year.
- London supply drops further (down 19% year-on-year) and stock levels reduce (9%), paving the way for price recovery.
- National average price growth slides slightly further into the negative (-0.3% year-on-year).
- Spring optimism boosts the average home price in England and Wales by 0.2% this month.
- Seasonal positivity lifts prices in Wales, Scotland and all English regions with the exception of the East of England (-0.1%) and Greater London which remained the same (month-on-month).
- Typical Time on Market indicates the largest rises are in the South East (+38%) and the East of England (+46% year-on-year) as the slowdown worsens in both regions.
- Total stock levels across England and Wales are up just 6.4% year-on-year.
- Largest supply increases observed in the West Midlands (+8%) and the East Midlands (+4%).
- Typical Time on Market for England and Wales is currently 111 days (median), 12 days longer than in March 2018.
Summary
Headline figures indicate that, overall, 2019 is a year of house price correction, but the current fortunes of any given region depend on where they are in the property growth-correction cycle. The London market was the first to take off following the financial crisis and, naturally, the first regional market to go into the red. The corollary is that London will also be the first to recover and the initial green shoots are evident in both rapidly rising rents in many boroughs and a significant reduction of stock for sale over the last twelve months (down 9%).
The West and East Midlands markets continue to slow as evidenced by their Typical Time on Market increases (15% and 14% respectively). Supply in both regions is up 4% and 8% respectively and we expect supply and stock levels to increase further over the coming months. Moreover, we anticipate that these two regions will be the next dominoes to fall (East Midlands first), consistent with our regional market trend analysis.
Overall, supply of property for sale entering the UK market is down by -4% (showing increased caution on the part of vendors) while the total stock for sale has increased by a reasonably benign 6.4% year-on-year.
Key figures
| Measure | Figure |
|---|---|
| Monthly change in average asking price (England & Wales) | 0.2% |
| Annual change in average asking price (England & Wales) | -0.3% |
| Typical Time on Market (England & Wales) | 111 days |
| Increase in Typical Time on Market vs March 2018 | 12 days |
| Total stock levels change (England & Wales) | 6.4% |
| UK new instructions change (year-on-year) | -4% |
| London supply change (year-on-year) | -19% |
| London stock levels change (year-on-year) | -9% |
Figures are for England and Wales unless the report states otherwise, as published in the edition.
Charts from the report
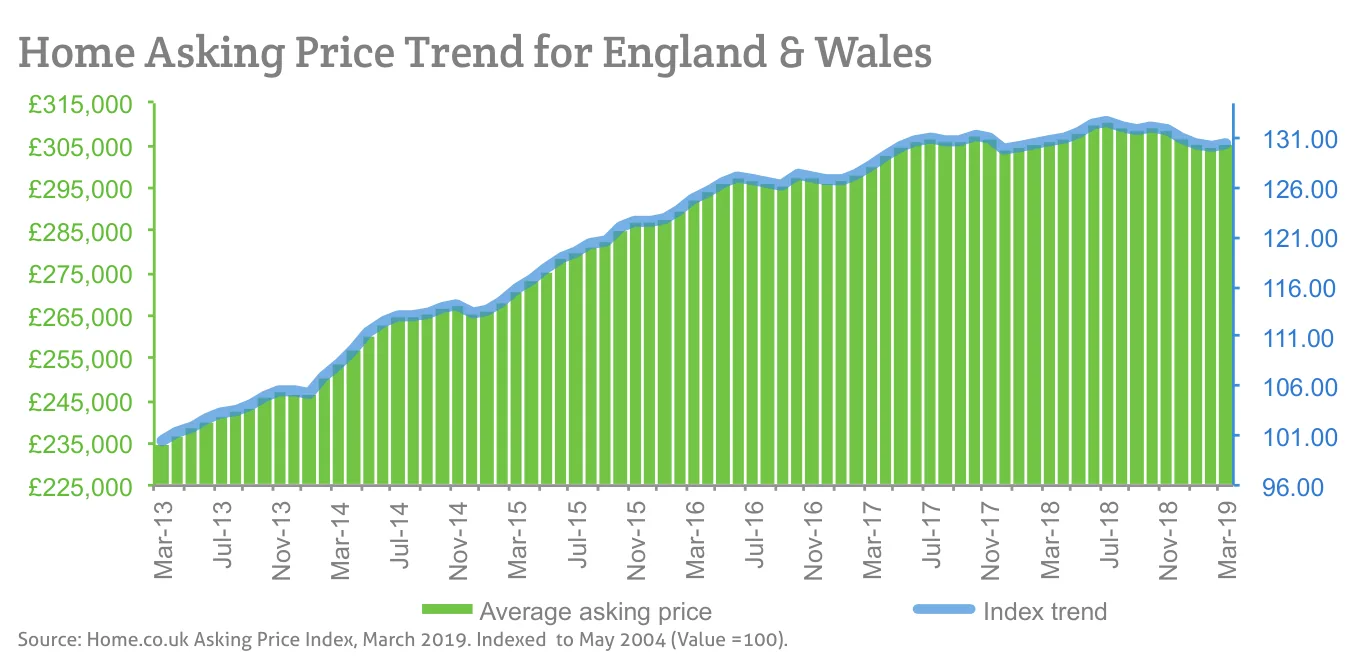
Source: Home.co.uk Asking Price Index, March 2019. Indexed to May 2004 (Value =100).
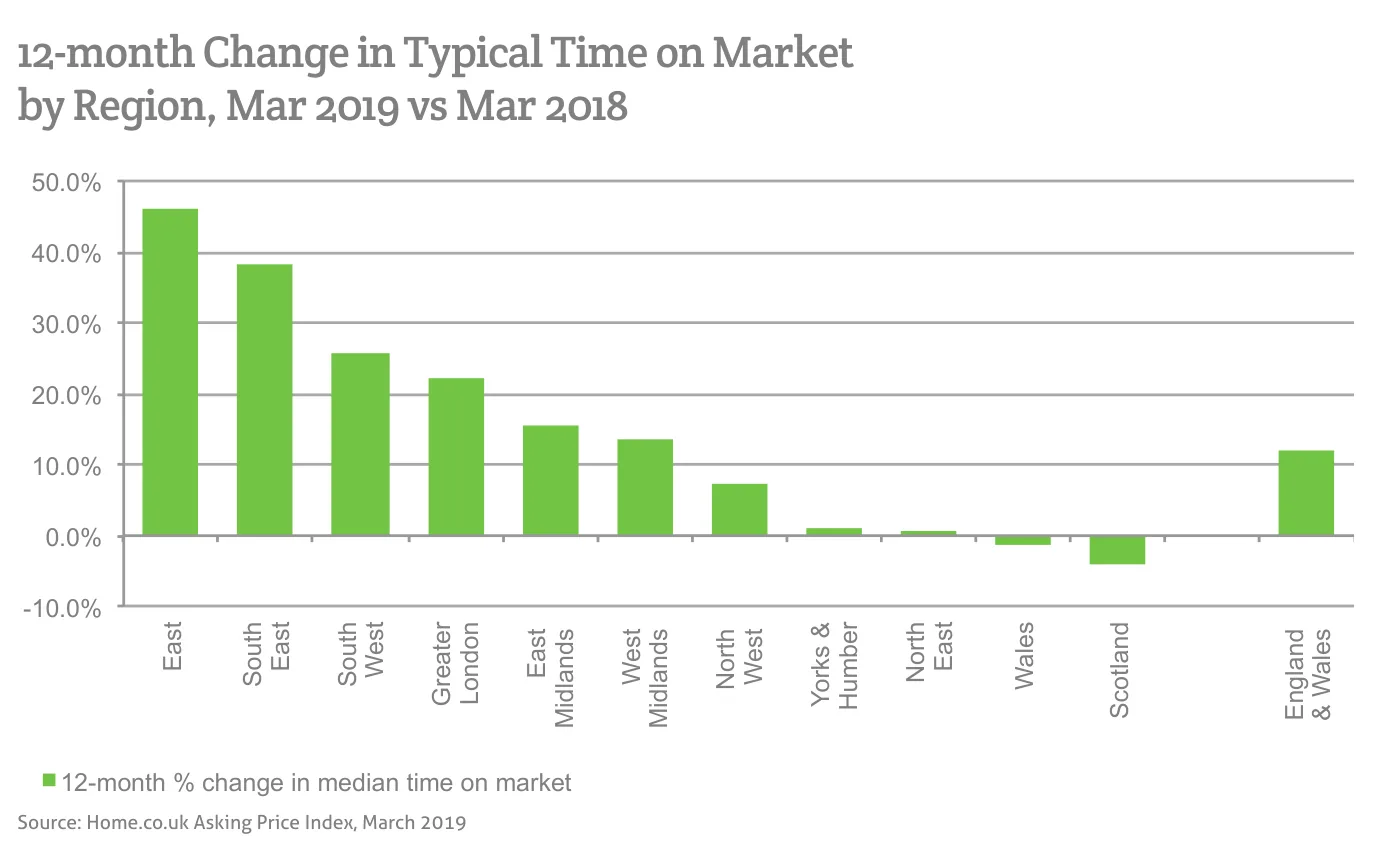
Source: Home.co.uk Asking Price Index, March 2019
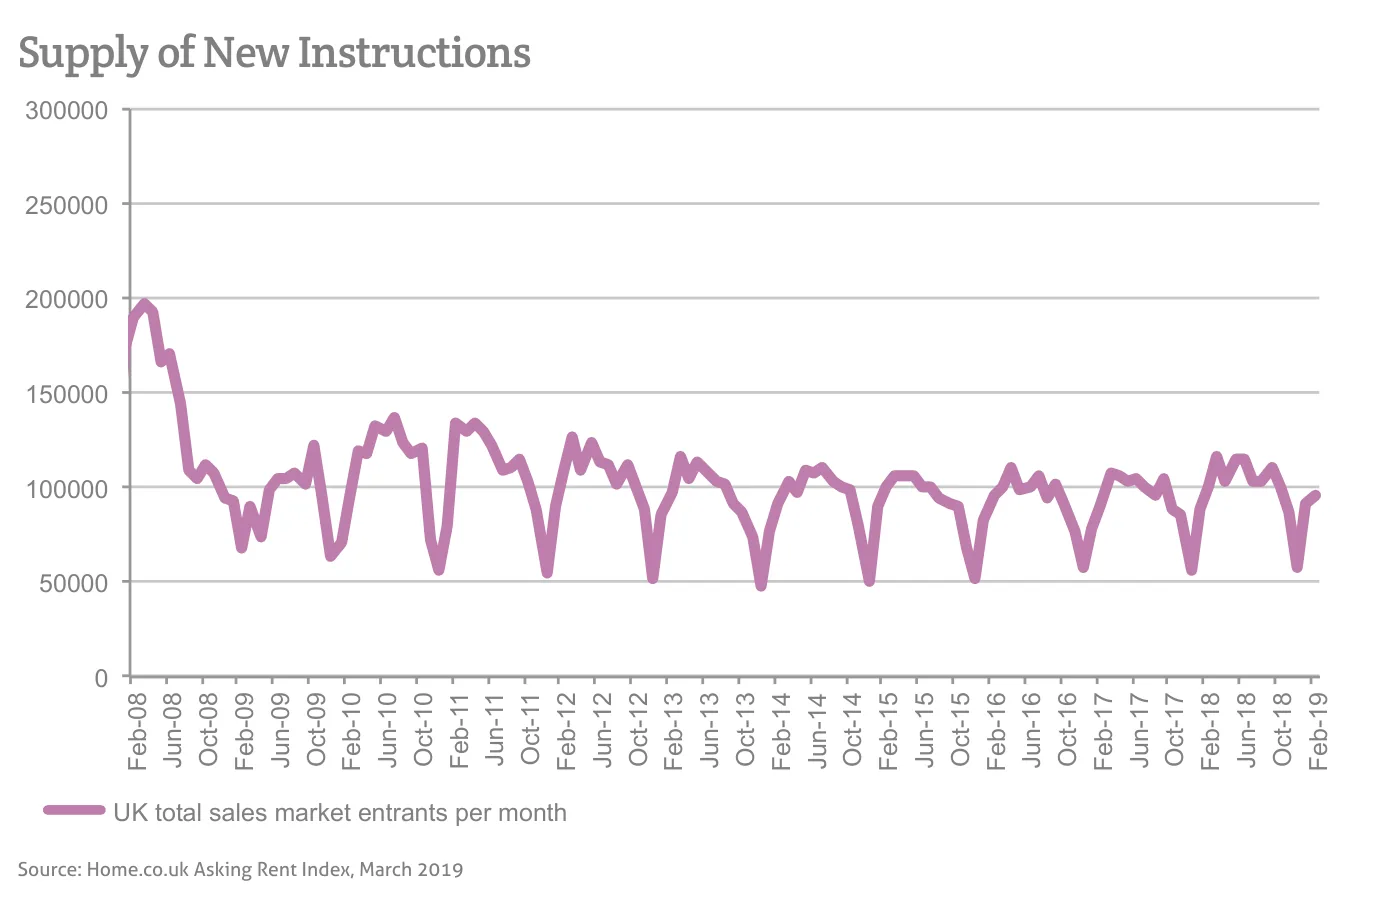
Source: Home.co.uk Asking Rent Index, March 2019
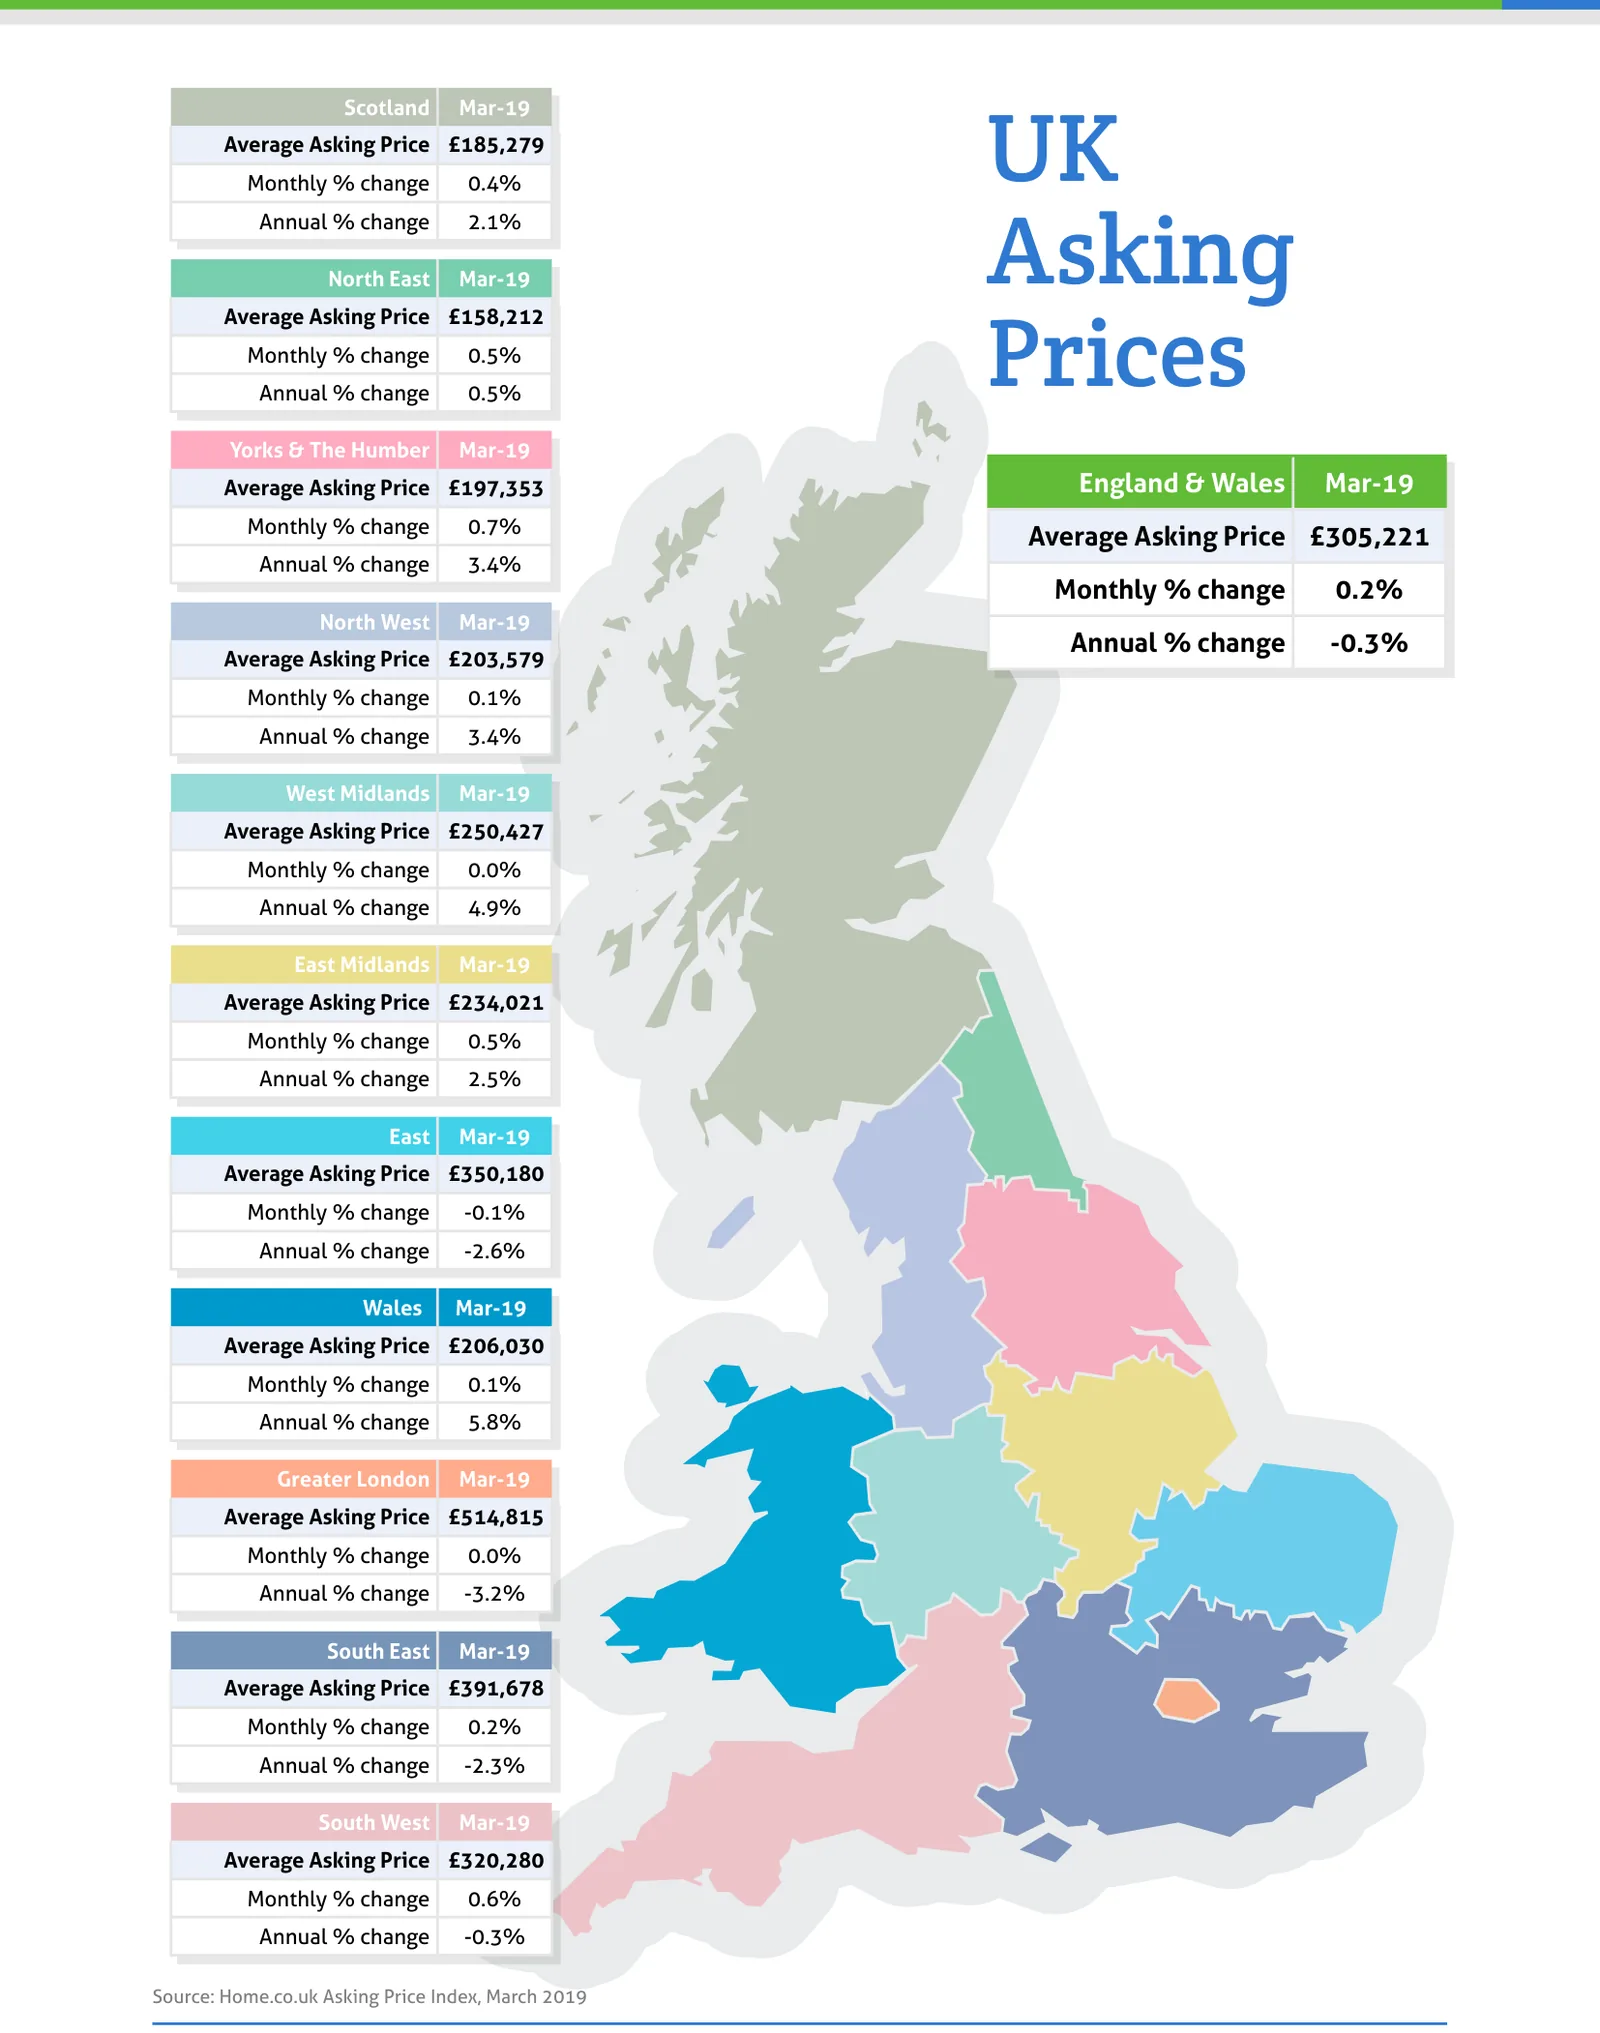
Source: Home.co.uk Asking Price Index, March 2019
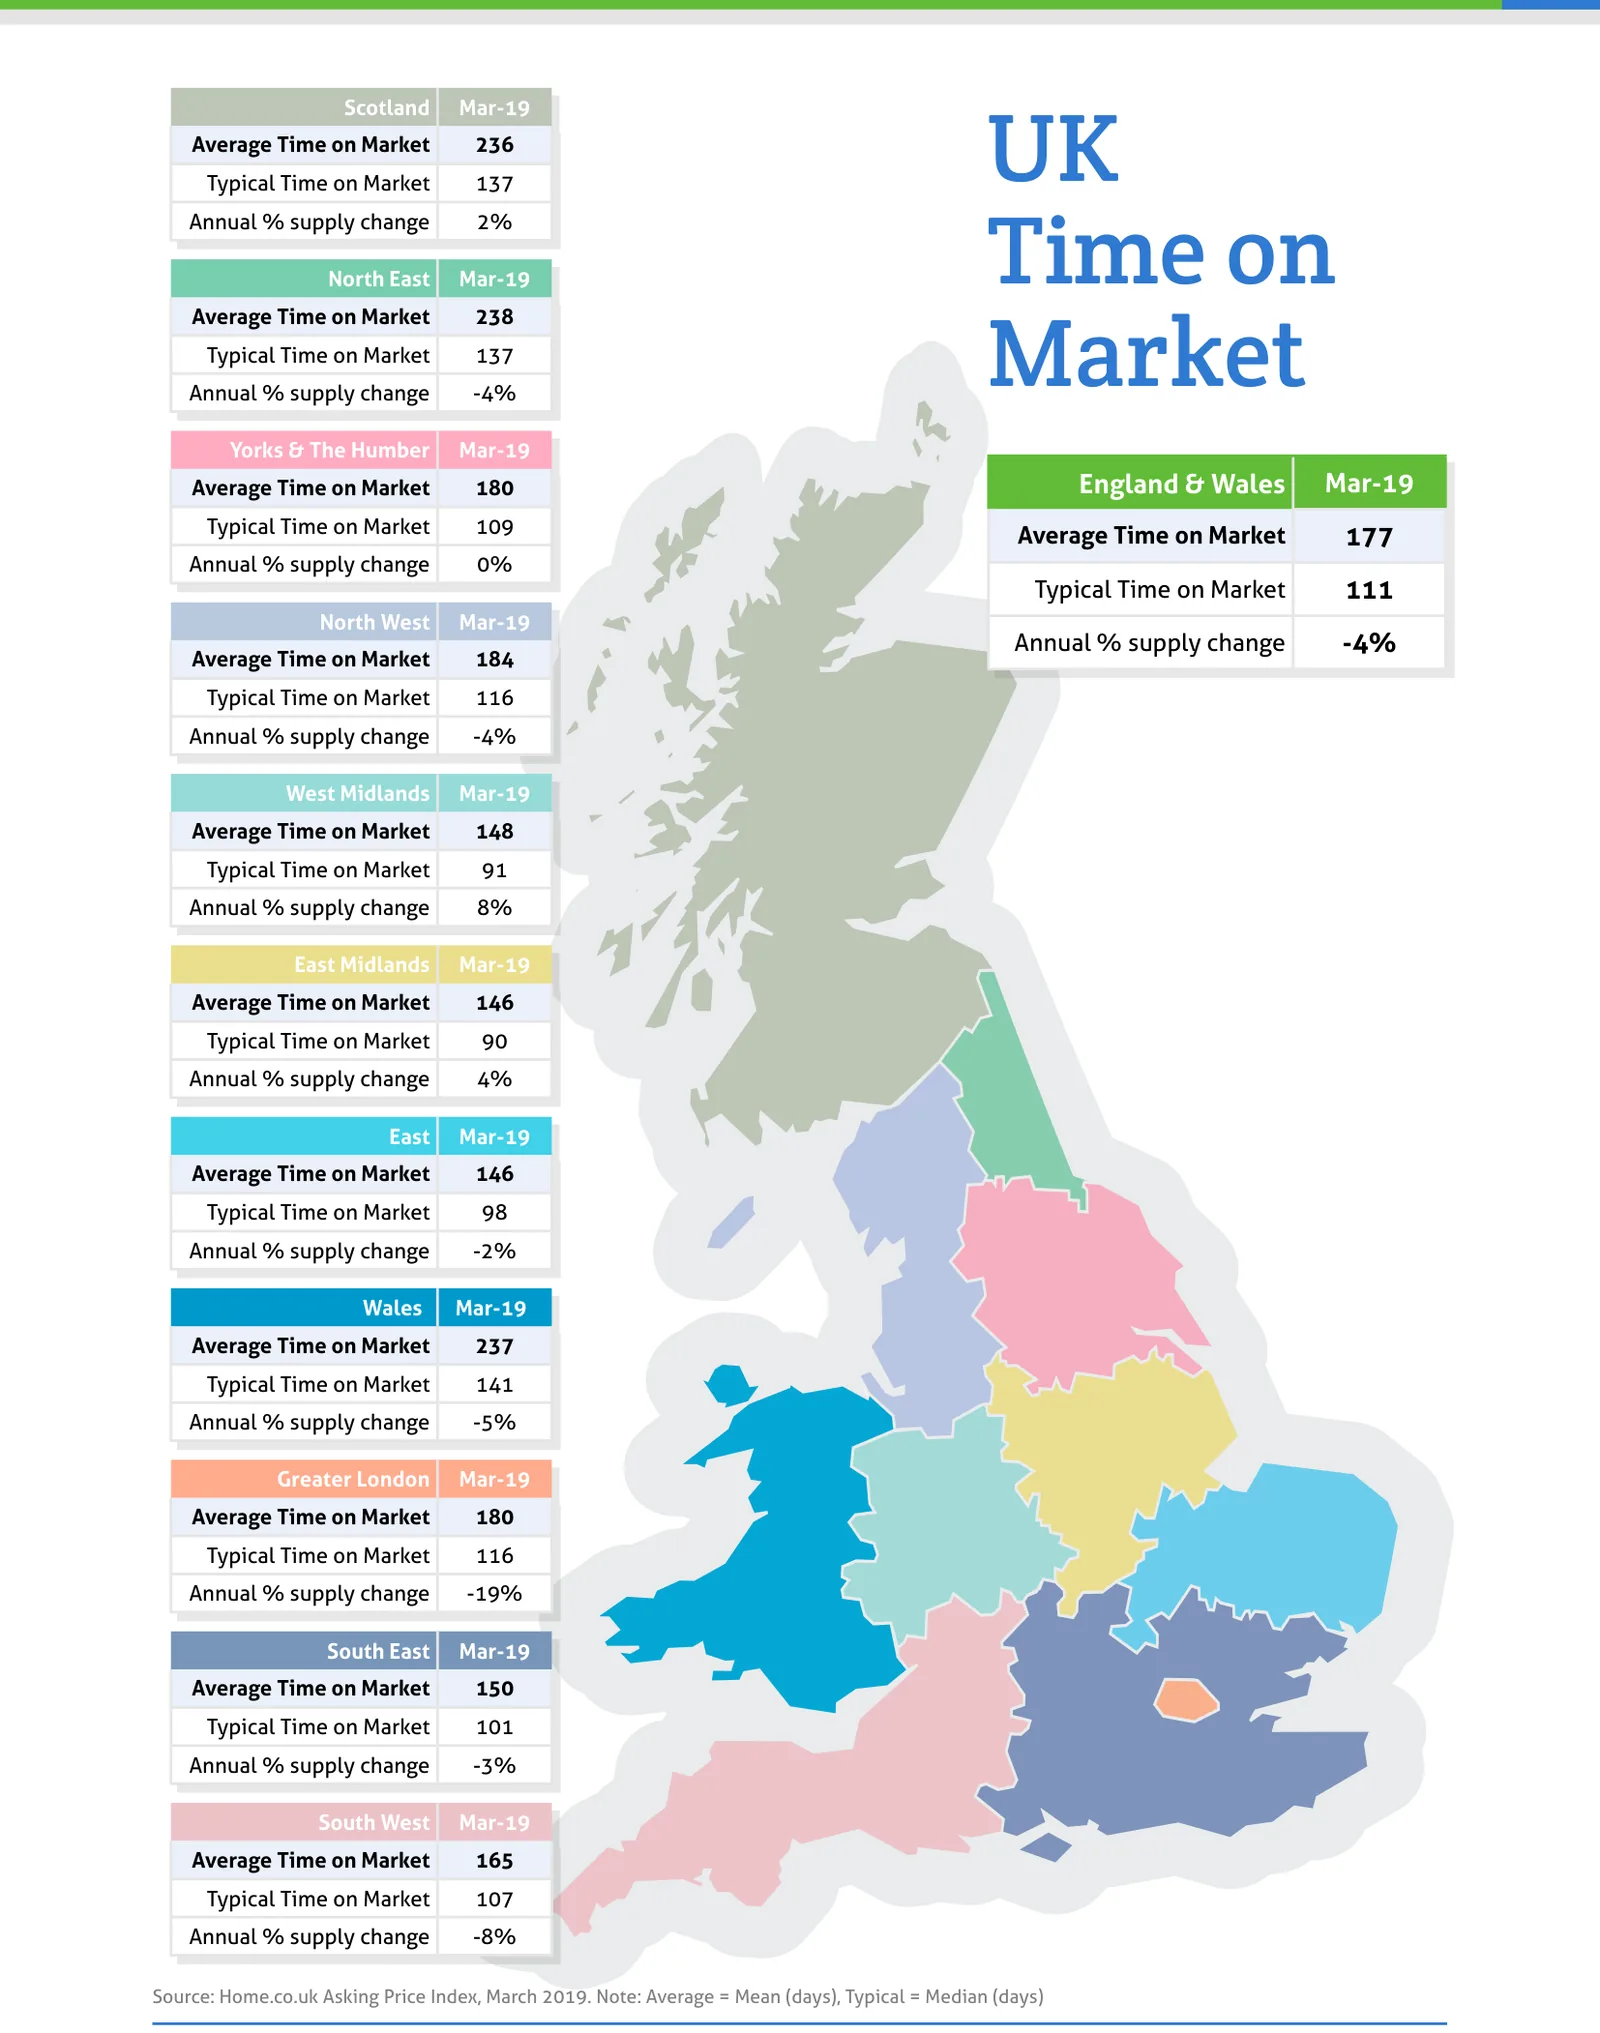
Source: Home.co.uk Asking Price Index, March 2019. Note: Average = Mean (days), Typical = Median (days)
Regional tables
UK Asking Prices, Mar-19
| Region | Average Asking Price | Monthly % change | Annual % change |
|---|---|---|---|
| Scotland | £185,279 | 0.4% | 2.1% |
| North East | £158,212 | 0.5% | 0.5% |
| Yorks & The Humber | £197,353 | 0.7% | 3.4% |
| England & Wales | £305,221 | 0.2% | -0.3% |
| North West | £203,579 | 0.1% | 3.4% |
| West Midlands | £250,427 | 0.0% | 4.9% |
| East Midlands | £234,021 | 0.5% | 2.5% |
| East | £350,180 | -0.1% | -2.6% |
| Wales | £206,030 | 0.1% | 5.8% |
| Greater London | £514,815 | 0.0% | -3.2% |
| South East | £391,678 | 0.2% | -2.3% |
| South West | £320,280 | 0.6% | -0.3% |
UK Time on Market, Mar-19
| Region | Average Time on Market | Typical Time on Market | Annual % supply change |
|---|---|---|---|
| Scotland | 236 | 137 | 2% |
| North East | 238 | 137 | -4% |
| Yorks & The Humber | 180 | 109 | 0% |
| England & Wales | 177 | 111 | -4% |
| North West | 184 | 116 | -4% |
| West Midlands | 148 | 91 | 8% |
| East Midlands | 146 | 90 | 4% |
| East | 146 | 98 | -2% |
| Wales | 237 | 141 | -5% |
| Greater London | 180 | 116 | -19% |
| South East | 150 | 101 | -3% |
| South West | 165 | 107 | -8% |
From the director's commentary
"Overall, neither Brexit anxiety nor the landlord exodus has precipitated the level of oversupply required to cause a property crash."
Doug Shephard, Director at Home.co.uk
Read the full March 2019 edition (PDF, 7 pages)
About the Home Asking Price Index
The Home Asking Price Index measures the change in the prices sellers ask for residential property across England, Wales and Scotland. Today it is computed every month from around half a million advertised homes and is mix-adjusted, so a change in what happens to be on the market does not move the figure; earlier editions state the sample they were built from. Because an asking price is set months before a sale completes, the index runs around five months ahead of completed-sale measures such as the UK House Price Index.
Every edition in the archive, back to October 2006, is listed on the index page. How we measure the UK property market explains the listing data behind it, and today's figures by area are on house prices and rental prices.
Text and figures above are quoted from the March 2019 edition as published, with punctuation normalised for the web, and are not revised. Later editions may restate them.
More in What is happening to house prices: the Home guide
Thinking about your next move?
See what your home's worth in seconds, with the UK's longest-running property data behind it.
Get an instant valuation