

























Home Asking Price Index, March 2014: London on fire while Scotland stagnates
Asking prices in England and Wales rose 1.4% in the month and 7.9% annually, while London surged 18.9% year on year and Scotland's prices fell 1.4%.
This is the March 2014 edition of the Home Asking Price Index, released on 13 March 2014, under the headline:
London on Fire while Scotland Stagnates
The headlines and summary below are the report's own words, with the key figures as it published them, followed by the report's charts and regional tables as printed.
Headlines
- Home prices across England and Wales rose a further 1.4% over the last month, bringing the mix-adjusted average price to £253,758, ca. £8,000 higher than in March 2008
- The Greater London home market is on fire: up another 3.1% since February and up an alarming 18.9% year-on-year
- Typical time on market now nine days less than in March 2013
- Supply of properties for sale down 6.2% year-on-year and down 52% since February 2008
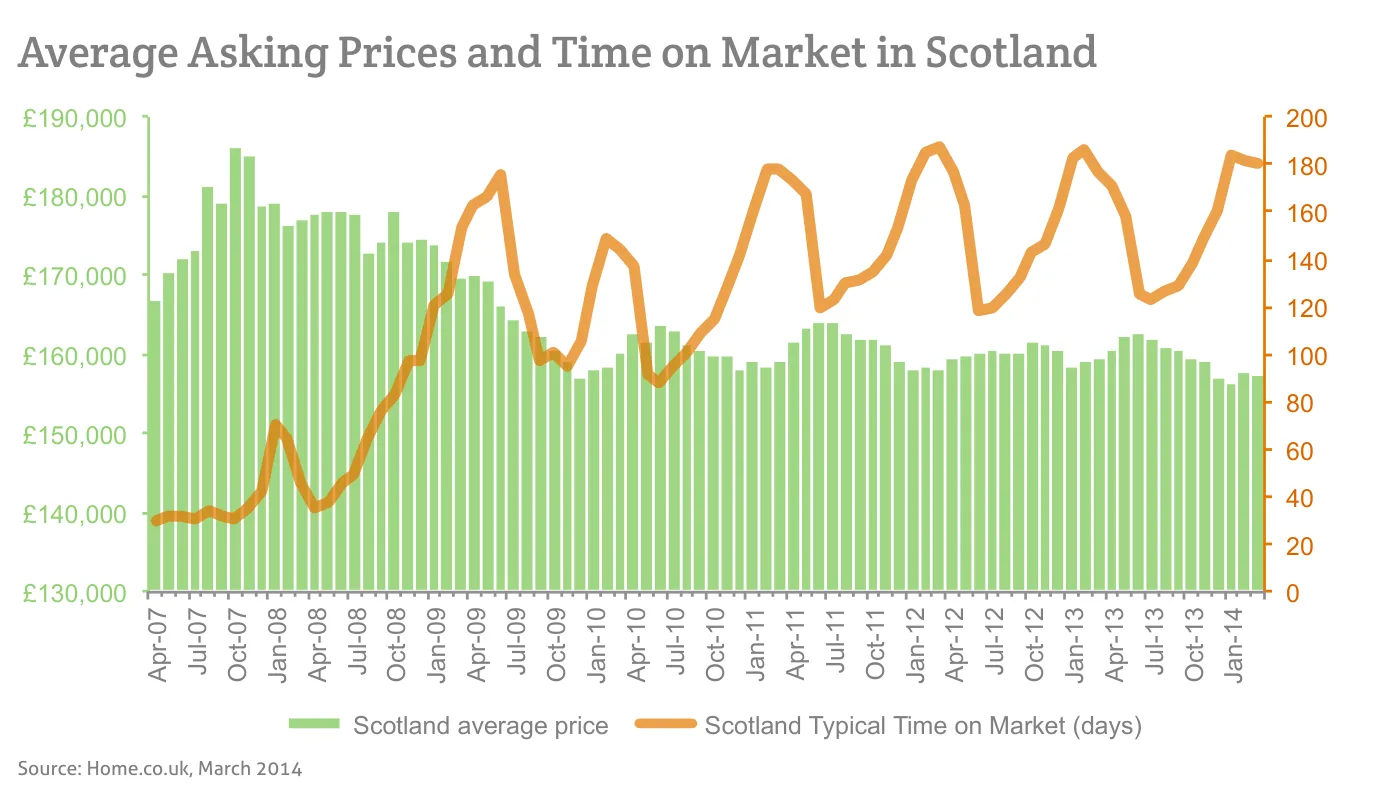
- Still no sign of a market recovery in Scotland, where prices fell 0.3% last month
Summary
With home prices rising and marketing times falling in every English region and in Wales, there is a certain spring in the step of the housing market. Pump-primed by the government Help to Buy initiative and ultra-low interest rates, overall the property market is heating up rapidly. The average home price in England and Wales has risen 7.9% over the last 12 months, and this figure looks set to go much higher as the supply of homes for sale remains tight.
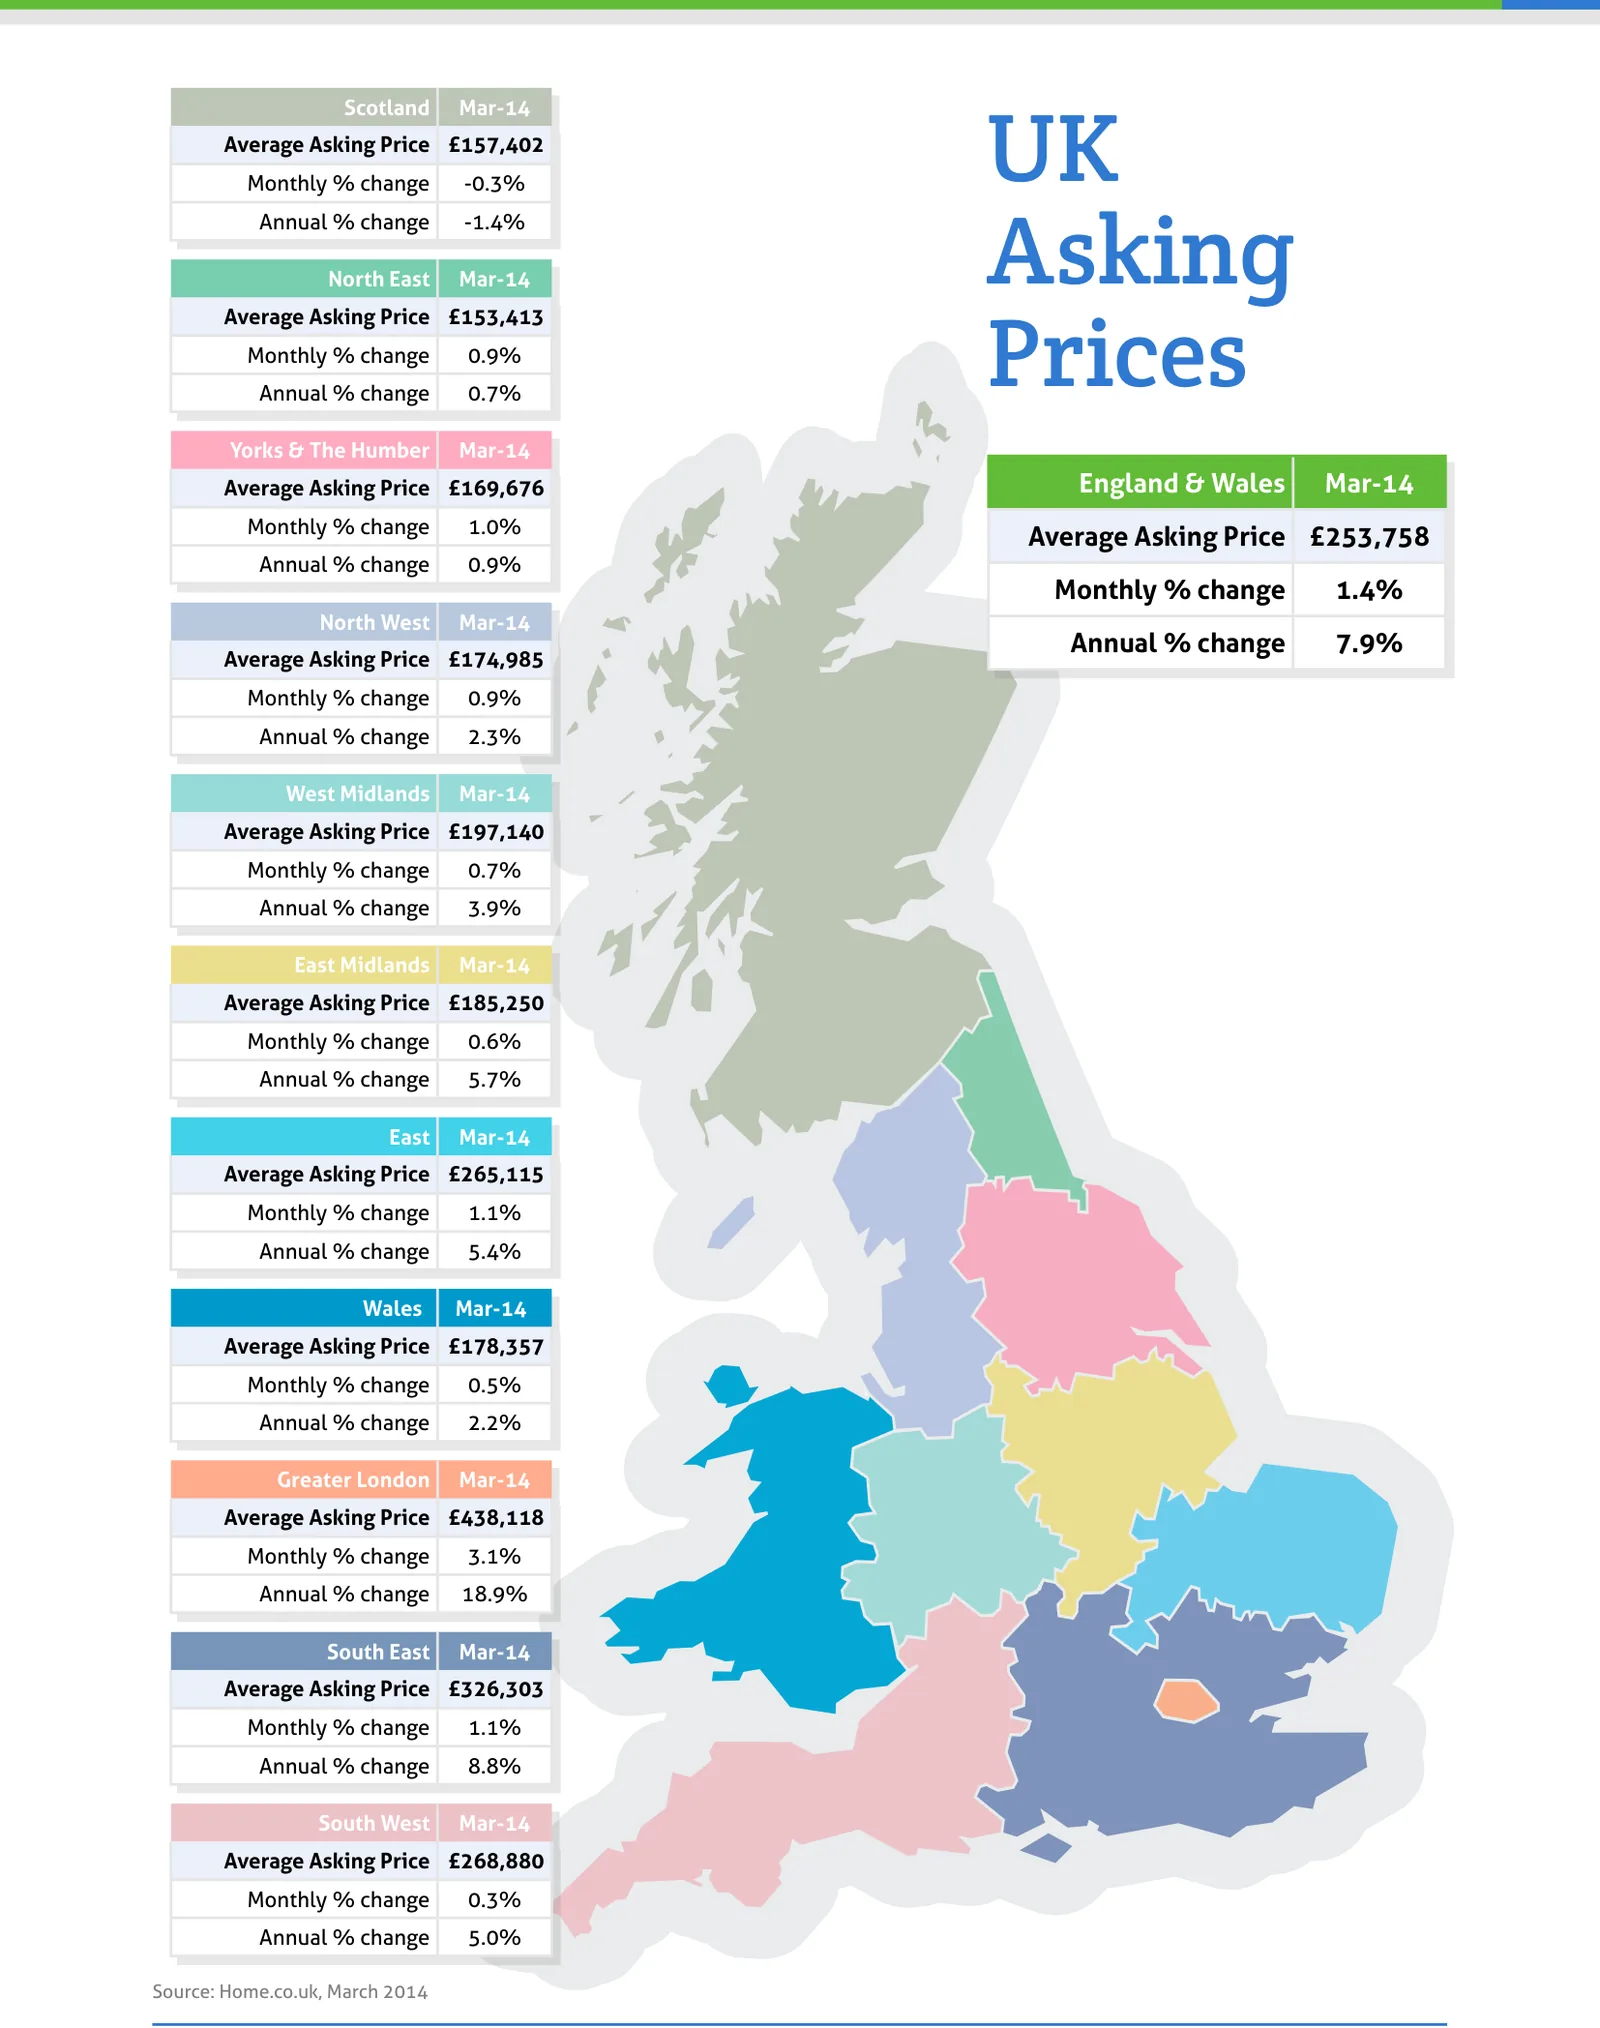
However, regional variations are truly significant in the current market, and national average figures obscure a great diversity of fortune throughout the regional property markets. The runaway price rises seen in London are not to be found in the North of England or Wales. The North East, North West, Yorkshire regions and Wales are all still experiencing sub-inflation price growth of between 0.7 and 2.3%, although they are all faring much better than Scotland. North of the border, asking prices have fallen by 1.4% over the last year.
Key figures
| Measure | Figure |
|---|---|
| Average asking price (England & Wales) | £253,758 |
| Monthly change (England & Wales) | 1.4% |
| Annual change (England & Wales) | 7.9% |
| Price increase since March 2008 | £8,000 |
| Supply change year-on-year | -6.2% |
| Supply change since February 2008 | -52% |
Figures are for England and Wales unless the report states otherwise, as published in the edition.
Charts from the report
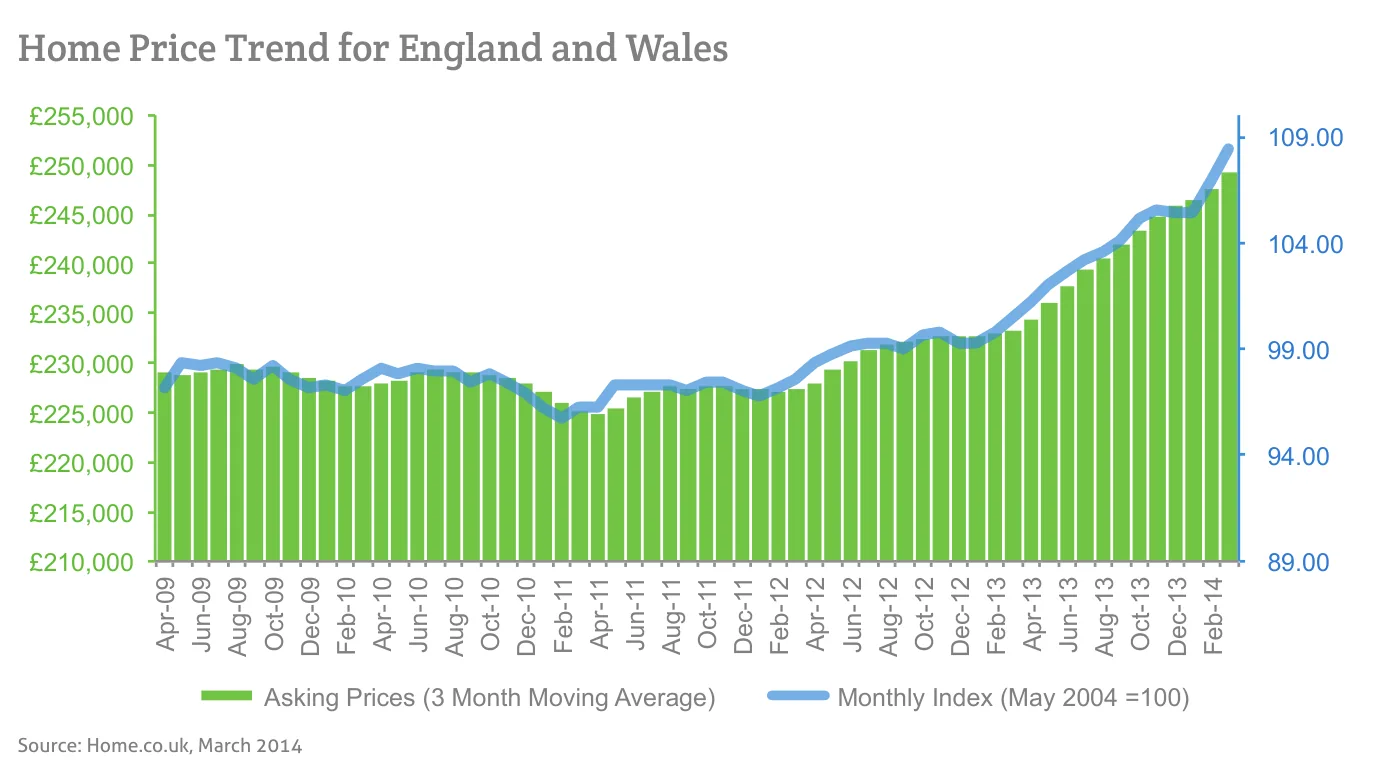
Source: Home.co.uk, March 2014
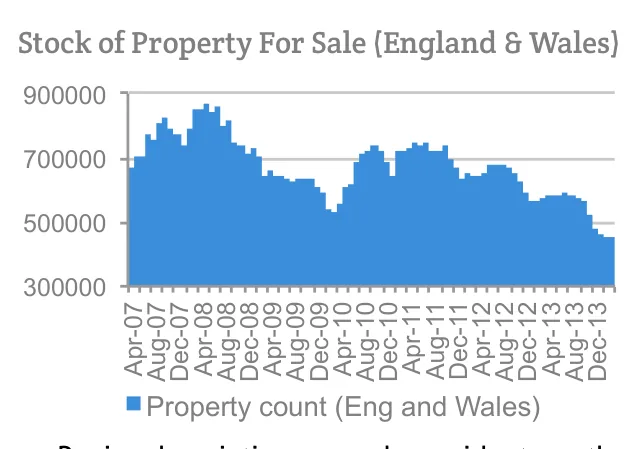
Source: Home.co.uk, March 2014
Source: Home.co.uk, March 2014
Regional tables
UK Asking Prices, Mar-14
| Region | Average Asking Price | Monthly % change | Annual % change |
|---|---|---|---|
| Scotland | £157,402 | -0.3% | -1.4% |
| North East | £153,413 | 0.9% | 0.7% |
| Yorks & The Humber | £169,676 | 1.0% | 0.9% |
| England & Wales | £253,758 | 1.4% | 7.9% |
| North West | £174,985 | 0.9% | 2.3% |
| West Midlands | £197,140 | 0.7% | 3.9% |
| East Midlands | £185,250 | 0.6% | 5.7% |
| East | £265,115 | 1.1% | 5.4% |
| Wales | £178,357 | 0.5% | 2.2% |
| Greater London | £438,118 | 3.1% | 18.9% |
| South East | £326,303 | 1.1% | 8.8% |
| South West | £268,880 | 0.3% | 5.0% |
From the director's commentary
"Clearly Scotland has a long way to go before the property market finds its feet again. Considering the much improved availability of cheap mortgages and government help to get on the housing ladder, Scottish properties are spending far too long on the market."
Doug Shephard, director at Home.co.uk
Read the full March 2014 edition (PDF, 5 pages)
About the Home Asking Price Index
The Home Asking Price Index measures the change in the prices sellers ask for residential property across England, Wales and Scotland. Today it is computed every month from around half a million advertised homes and is mix-adjusted, so a change in what happens to be on the market does not move the figure; earlier editions state the sample they were built from. Because an asking price is set months before a sale completes, the index runs around five months ahead of completed-sale measures such as the UK House Price Index.
Every edition in the archive, back to October 2006, is listed on the index page. How we measure the UK property market explains the listing data behind it, and today's figures by area are on house prices and rental prices.
Text and figures above are quoted from the March 2014 edition as published, with punctuation normalised for the web, and are not revised. Later editions may restate them.
More in What is happening to house prices: the Home guide
Thinking about your next move?
See what your home's worth in seconds, with the UK's longest-running property data behind it.
Get an instant valuation