

























Home Asking Price Index, March 2009: prices 'on hold' despite glacial market
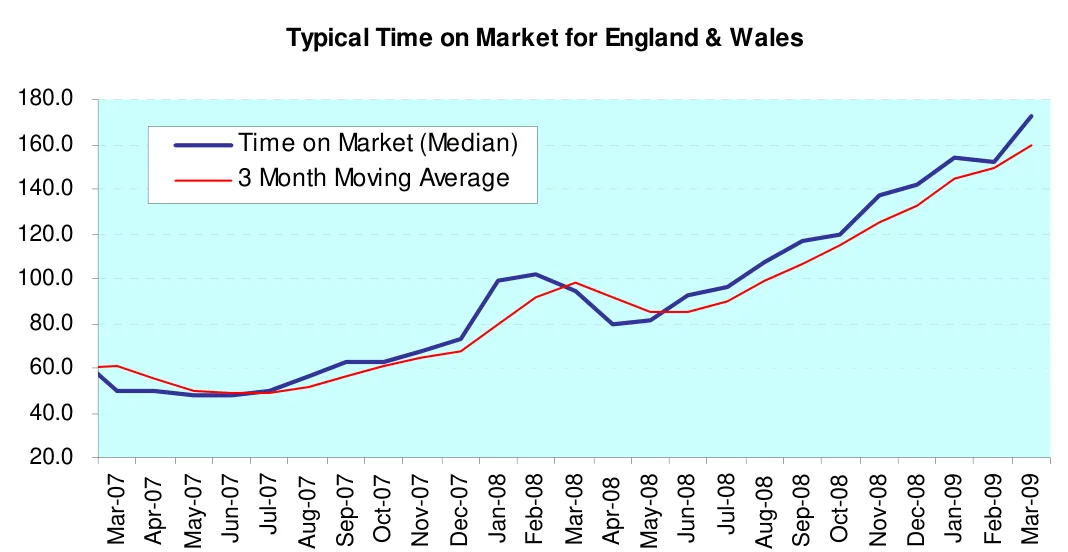
England and Wales asking prices rose slightly by 0.1% in February 2009 but remain 7.1% lower than a year earlier, as Time on Market rose to 173 days.
This is the March 2009 edition of the Home Asking Price Index, released on 12 March 2009, under the headline:
Prices 'On Hold' Despite Glacial Market
The headlines and summary below are the report's own words, with the key figures as it published them, followed by the report's charts and regional tables as printed.
Headlines
- The mix-adjusted average Asking Price for homes on the market in England and Wales remains essentially unchanged: slight rise of 0.1% since February.
- Monthly average price falls observed in just 4 of 9 English regions, Wales and Scotland.
- Asking Prices across England and Wales have fallen 7.1% since March 08.
- The average Asking Price reduction in February was £19,840.
- Typical Time on Market rises to 173 days for unsold homes for sale.
Summary
Perhaps hoping for a 'spring bounce' vendors have shown greater reluctance to cut their asking prices in the last month, despite soaring Time-on-Market indicators for unsold property. Clearly, this increased bullish sentiment amongst sellers does not reflect the current housing market reality.
Asking prices of 63,777 homes on the market were cut in February, less than the number of reductions recorded for January (79,138∗). However, the value of the average price cut in February remained essentially unchanged from January (£19,564) at £19,839.
The typical Time-on-Market indicator for unsold properties has risen 21 days to 173 days since February (see Comment section). Meanwhile, the stock of property for sale on the market is stabilising after a period of decline as reduced instruction rates are balanced by reduced sales rates.
Key figures
| Measure | Figure |
|---|---|
| Monthly change | +0.1% |
| Annual change | -7.1% |
| Typical Time on Market | 173 days |
| Price reductions in February | 63,777 |
| Price reductions in January | 79,138 |
| Average price cut in January | £19,564 |
| Q1 2009 change | -1.5% |
| HAPI index (England & Wales) | 98.7 |
Figures are for England and Wales unless the report states otherwise, as published in the edition.
Charts from the report
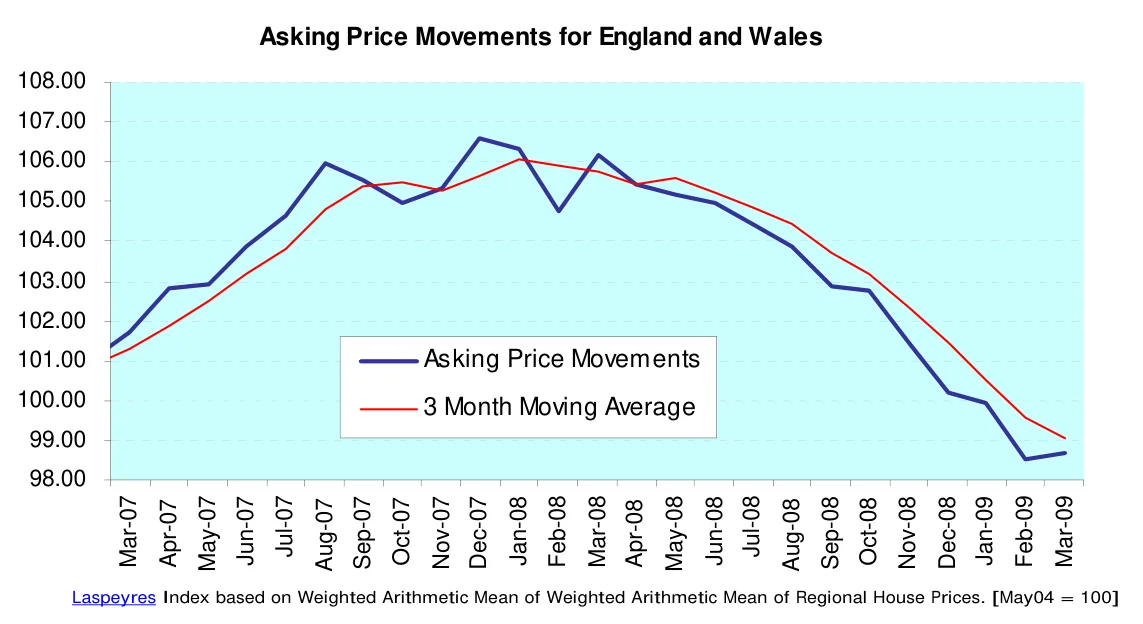
Laspeyres Index based on Weighted Arithmetic Mean of Weighted Arithmetic Mean of Regional House Prices. [May04 = 100]
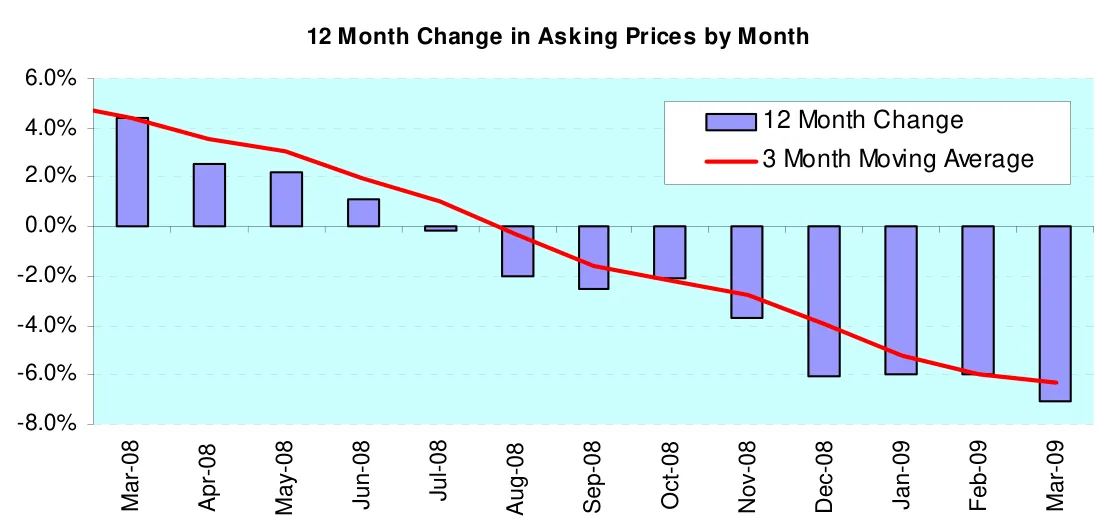
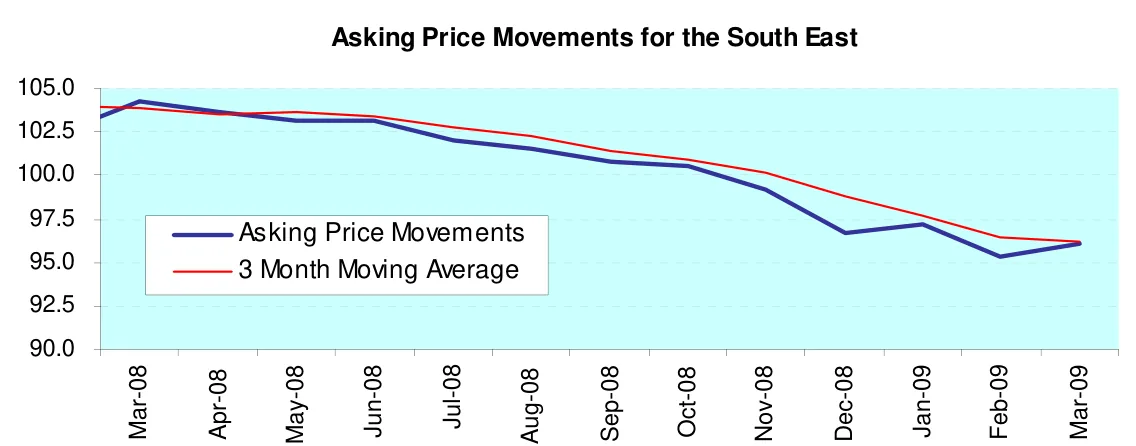
Laspeyres Indices based on Weighted Arithmetic Mean of Regional House Prices [May04 = 100]
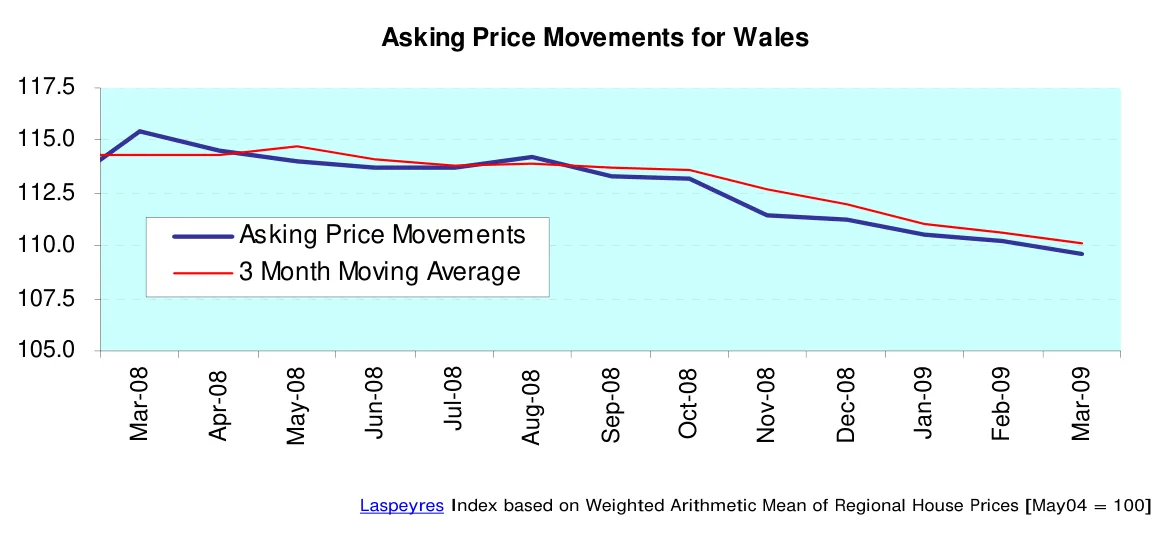
Laspeyres Index based on Weighted Arithmetic Mean of Regional House Prices [May04 = 100]
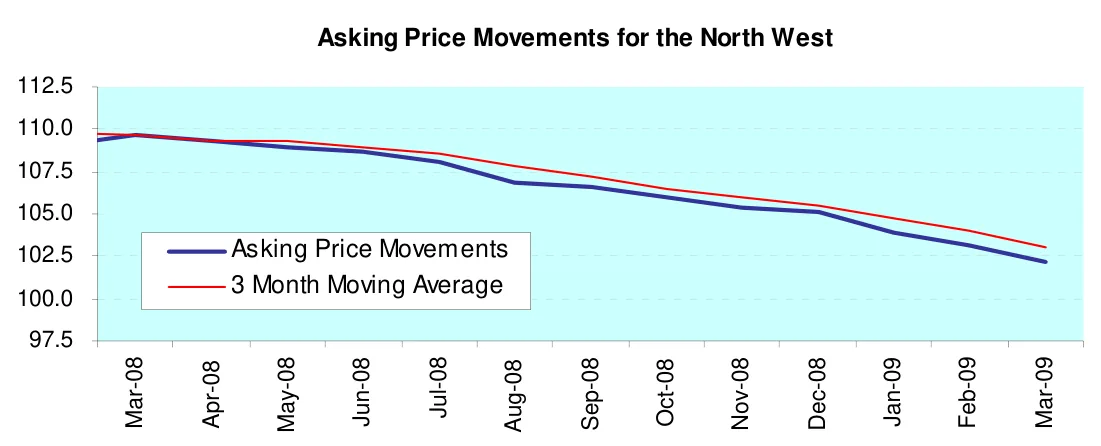
Laspeyres Index based on Weighted Arithmetic Mean of Regional House Prices [May04 = 100]
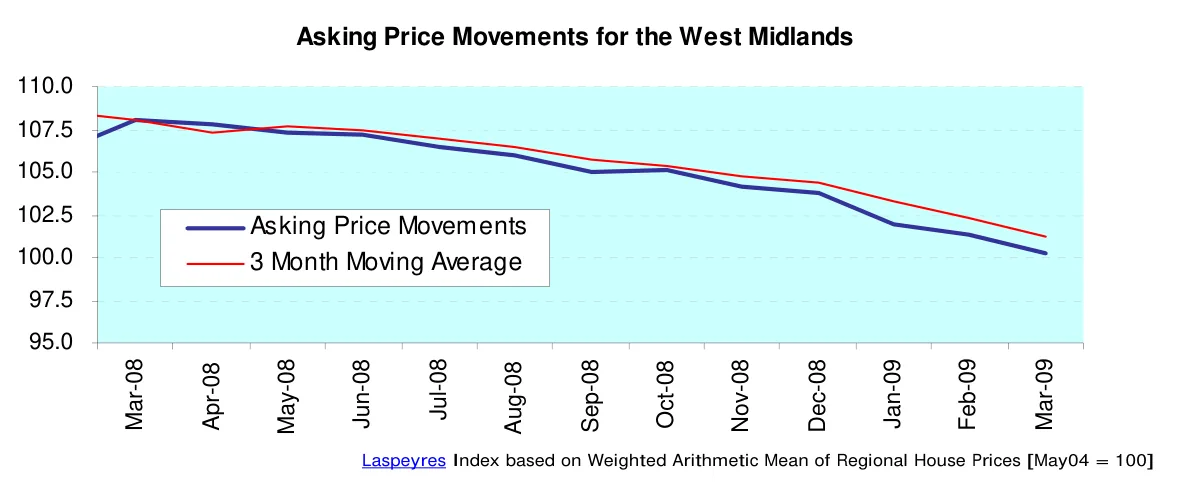
Laspeyres Index based on Weighted Arithmetic Mean of Regional House Prices [May04 = 100]
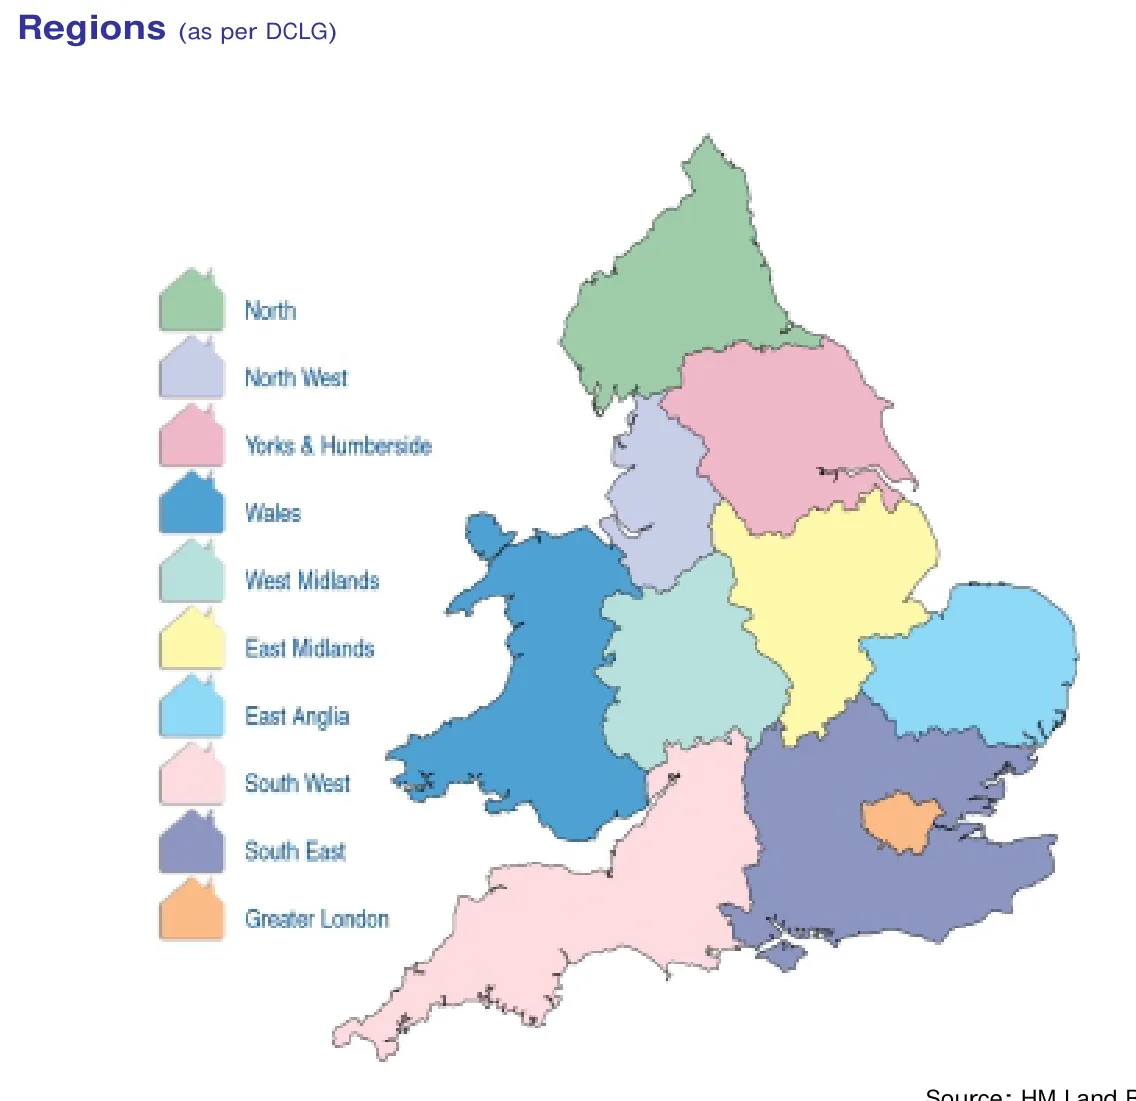
Source: HM Land Registry
Regional tables
Regional Housing Markets
| Current average price | 3-month change | |
|---|---|---|
| North East | £164,876 | 0.6% |
| South East | £270,316 | -0.7% |
| East Anglia | £247,101 | -1.1% |
| Greater London | £329,784 | -1.2% |
| Wales | £186,039 | -1.4% |
| Yorkshire and Humber | £173,686 | -1.5% |
| South West | £252,874 | -1.7% |
| East Midlands | £173,275 | -2.0% |
| North West | £178,237 | -2.8% |
| Scotland | £170,082 | -2.8% |
| West Midlands | £191,913 | -3.3% |
Regional Asking Prices for March 2009, showing % change for Q1 2009.
Read the full March 2009 edition (PDF, 9 pages)
About the Home Asking Price Index
The Home Asking Price Index measures the change in the prices sellers ask for residential property across England, Wales and Scotland. Today it is computed every month from around half a million advertised homes and is mix-adjusted, so a change in what happens to be on the market does not move the figure; earlier editions state the sample they were built from. Because an asking price is set months before a sale completes, the index runs around five months ahead of completed-sale measures such as the UK House Price Index.
Every edition in the archive, back to October 2006, is listed on the index page. How we measure the UK property market explains the listing data behind it, and today's figures by area are on house prices and rental prices.
Text and figures above are quoted from the March 2009 edition as published, with punctuation normalised for the web, and are not revised. Later editions may restate them.
More in What is happening to house prices: the Home guide
Thinking about your next move?
See what your home's worth in seconds, with the UK's longest-running property data behind it.
Get an instant valuation