

























Home Asking Price Index, June 2024: high borrowing costs risk stalling the market
Asking prices in England and Wales rose 0.5% in June 2024, while unsold stock reached 485,269, the highest June total since 2014.

This is the June 2024 edition of the Home Asking Price Index, released on 12 June 2024, under the headline:
High Borrowing Costs Risk Stalling the Market
The headlines and summary below are the report's own words, with the key figures as it published them, followed by the report's charts and regional tables as printed.
Headlines
- Asking prices have risen 0.5% since last month across England and Wales (the fifth consecutive monthly rise) and are up just 0.5% compared to June 2023.
- The total unsold sales stock count for England and Wales increased again during the last month. Nearly 10,000 properties were added to agents' portfolios, making the current count of 485,269 the highest June total since 2014.
- Prices increased again in all English regions, Wales and Scotland during the last month. Vendors in the East of England were the least optimistic and upped their asking prices by the smallest margin (0.1%), while vendors in Yorkshire and the West Midlands were the most bullish, raising their prices by a full percentage point.
- Despite the vast amount of stock for sale, market momentum remains relatively healthy as shown by the Typical Time on Market (median) for unsold property in England and Wales being seven days less than in June 2019. However, the current median is four days more than in June last year.
- The total number of new instructions entering the market during May 2024 was 14% more than during May 2023. However, the total is 2% less than in May 2019.
- The North West remains the regional property market growth leader with a year-on-year gain of 3.8%, while the East of England is now the worst performing region with a loss of -1.5% over the same period.
- The annualised national growth figure for asking rents has slowed to just 3.0%. However, the North East and Yorkshire continue to lead the regional growth table, indicating rises of 15% and 16% respectively year-on-year. Meanwhile, the decline in Greater London rents has slowed to -1.7%.
- Prime central London rents have recovered some of their lost ground over recent months. For instance, Kensington and Chelsea rents have rebounded 13% over the last quarter but remain down year-on-year by 10%.
Summary
The mix-adjusted average asking price increased by 0.5% during the last month but prices remain essentially on a par with last summer overall and have yet to return to their 2022 high. Notably, the northern regions are indicating significant positive annualised growth while poorer performing regions such as the East of England and the South West remain significantly down compared to June 2023. This mixed picture of regional market performance, with the North consistently outperforming the South post-COVID, looks set to persist while yields in the northern regions offer considerably better returns to investors.
Key market indicators portray a relatively buoyant and dynamic market under the strain of a growing supply-demand imbalance. Oversupply concerns persist. Despite greater market optimism, spurred by improving inflation figures and therefore expectations of a rate cut, demand is looking outpaced. Vast amounts of properties continue to move through the current UK sales market; aside from three busy months last year, this is a level of activity not seen since the final quarter of 2018, but sales stock levels continue to swell.
A cut in the Bank of England base rate is both justifiable, thanks to lower inflation, and necessary in order to shore up the weaker regional markets. However, Rishi Sunak's decision to call a general election on the 4th of July means the City now expects action later in the summer or even early autumn, after the voting is over. Already, the sloth-like inaction of the Bank has put the UK economy at a disadvantage compared to European countries where rates have already begun to come down.
Key figures
| Measure | Figure |
|---|---|
| Monthly change in asking prices | 0.5% |
| Annual change in asking prices | 0.5% |
| Total unsold sales stock | 485,269 |
| Change in new instructions (May 2024 vs May 2023) | +14% |
| Change in new instructions (May 2024 vs May 2019) | -2% |
| Annualised asking rent growth | 3.0% |
| Annualised mix-adjusted average asking price growth (sales) | 0.5% |
Figures are for England and Wales unless the report states otherwise, as published in the edition.
Charts from the report
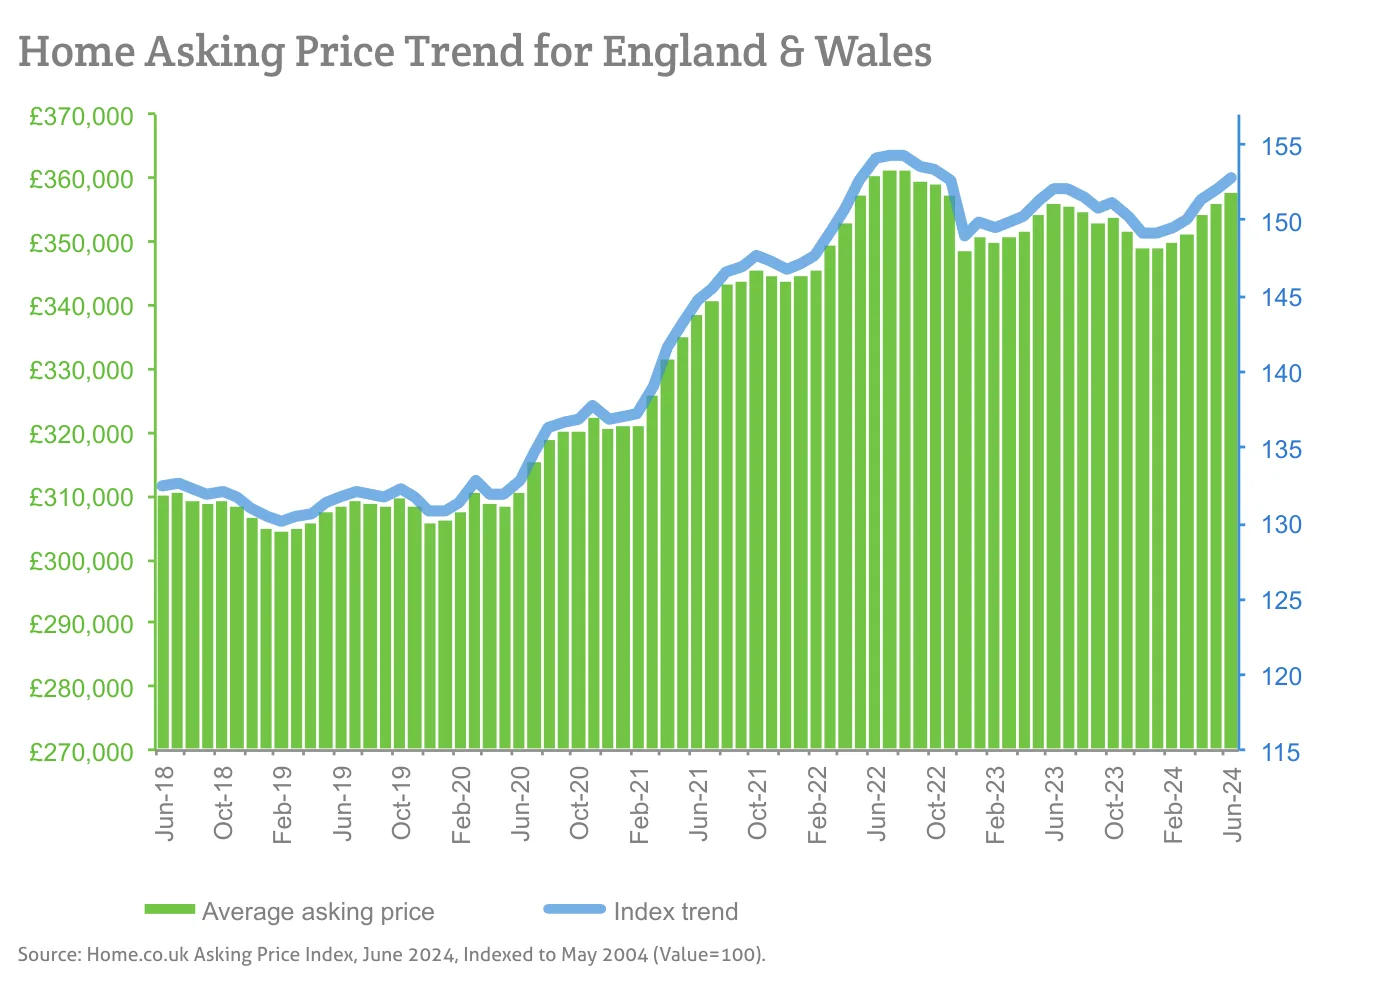
Source: Home.co.uk Asking Price Index, June 2024, Indexed to May 2004 (Value=100).
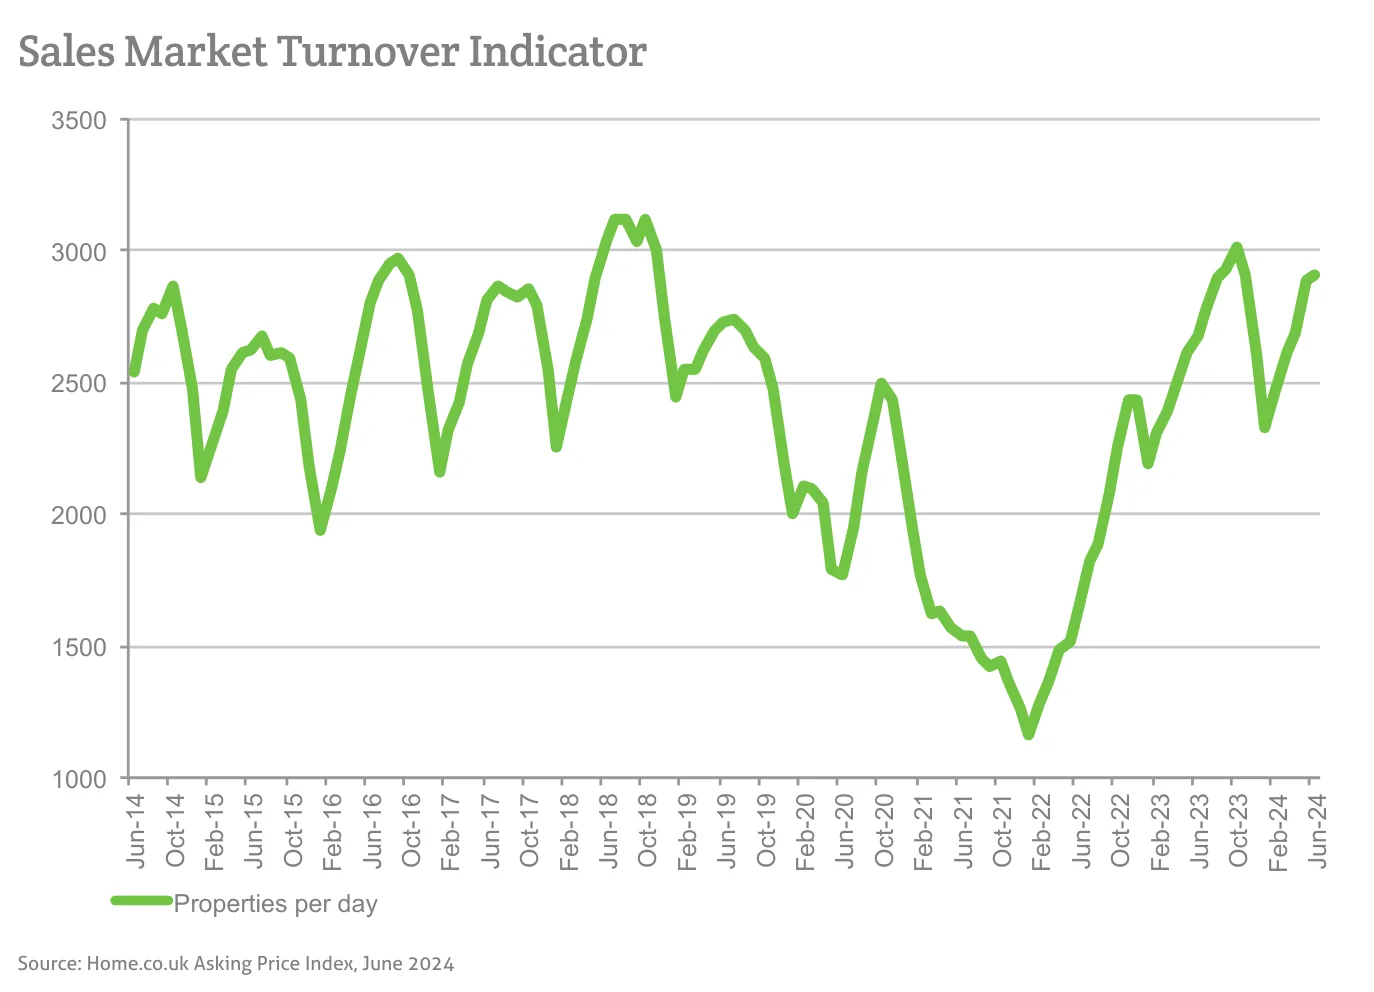
Source: Home.co.uk Asking Price Index, June 2024
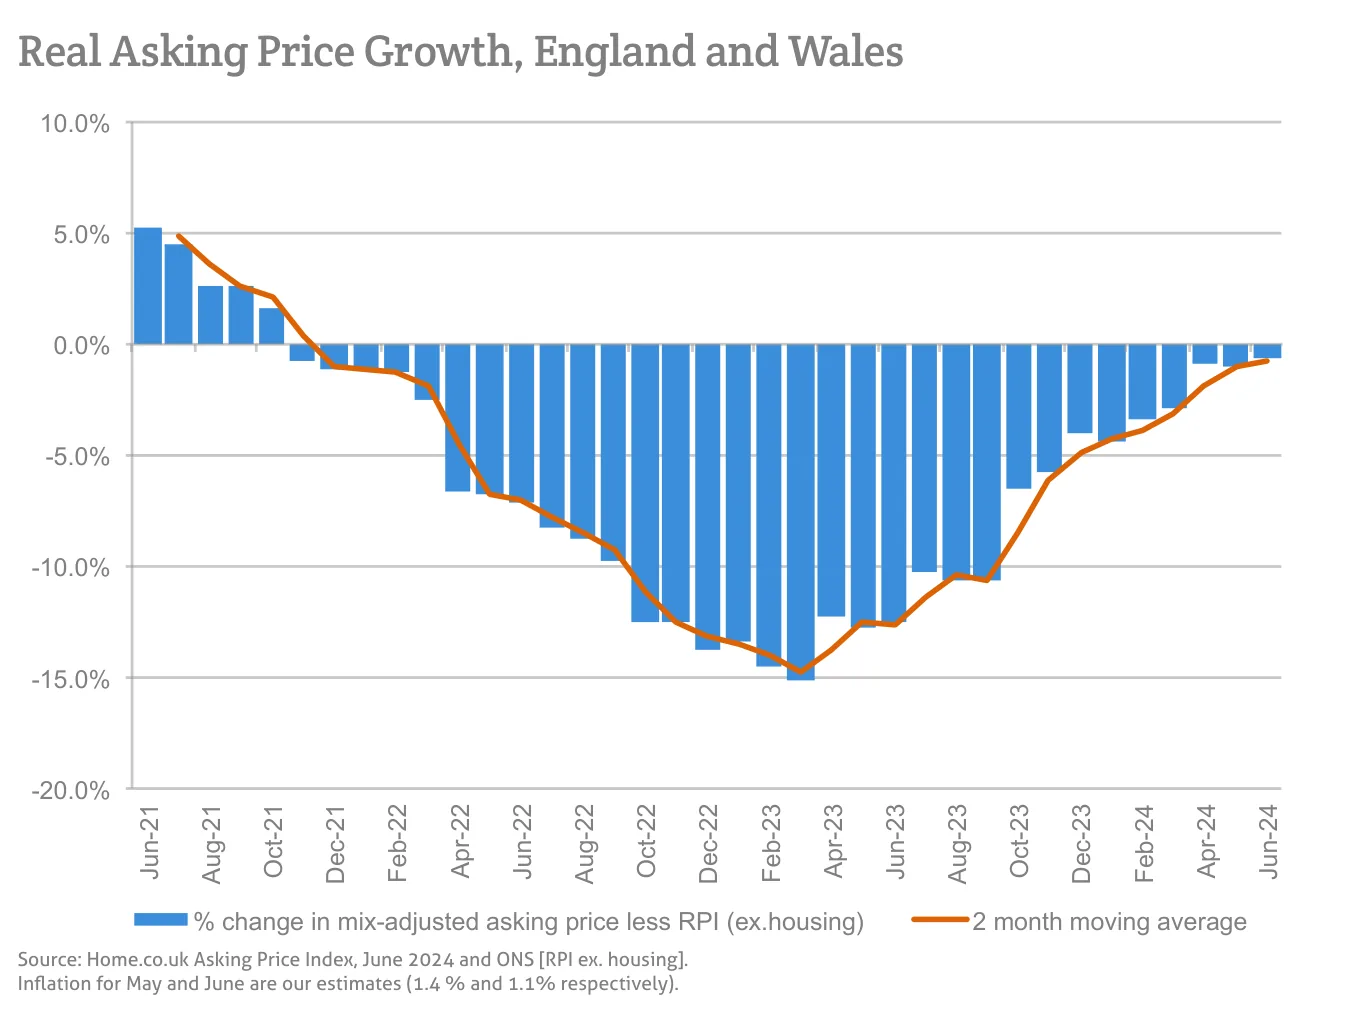
Source: Home.co.uk Asking Price Index, June 2024 and ONS [RPI ex. housing].
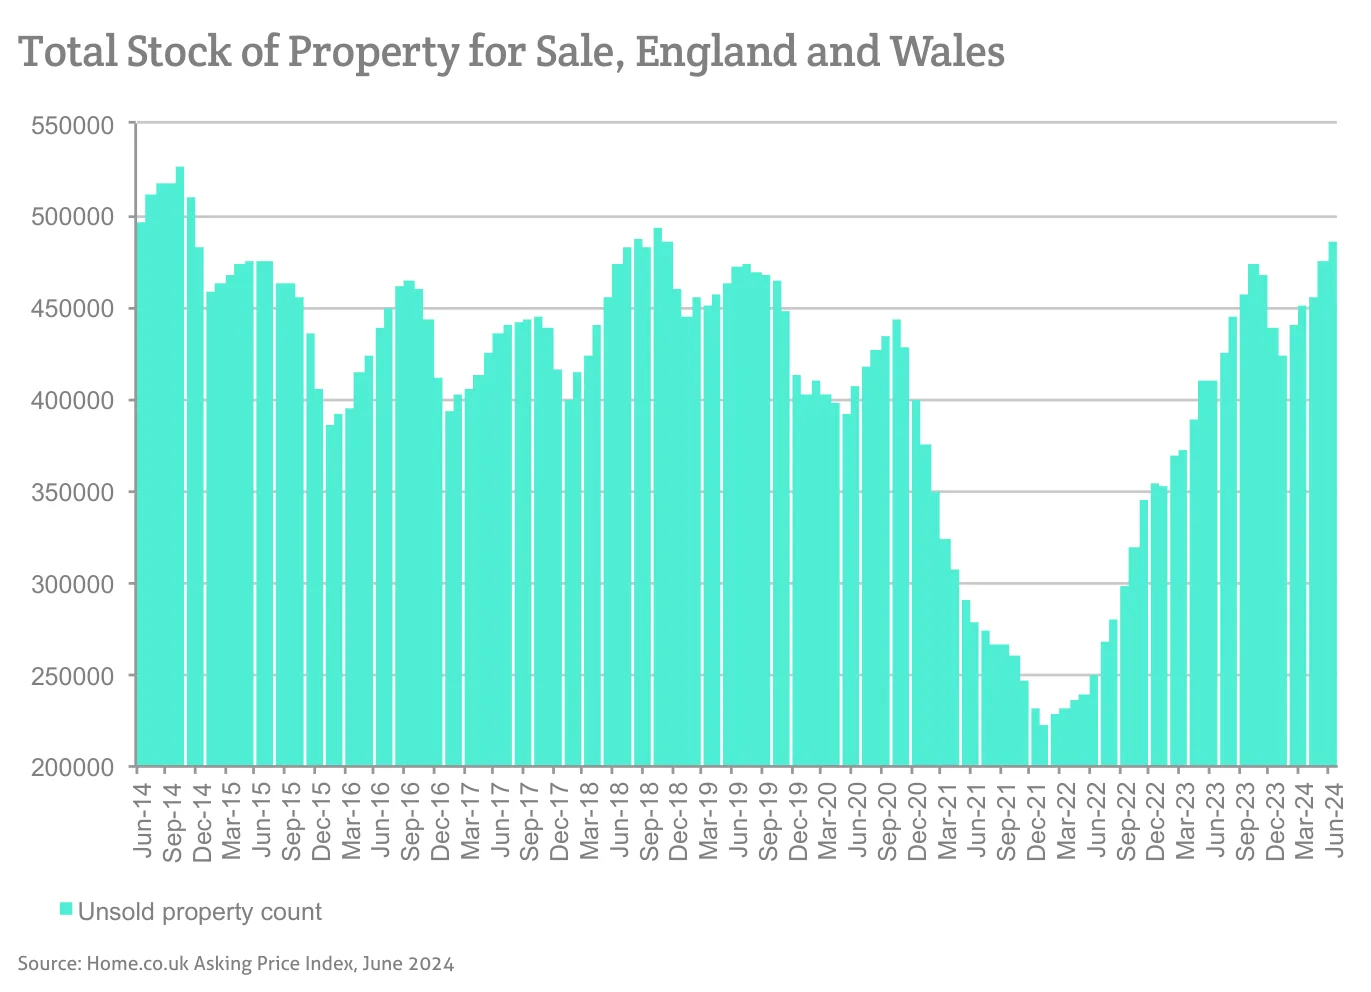
Source: Home.co.uk Asking Price Index, June 2024
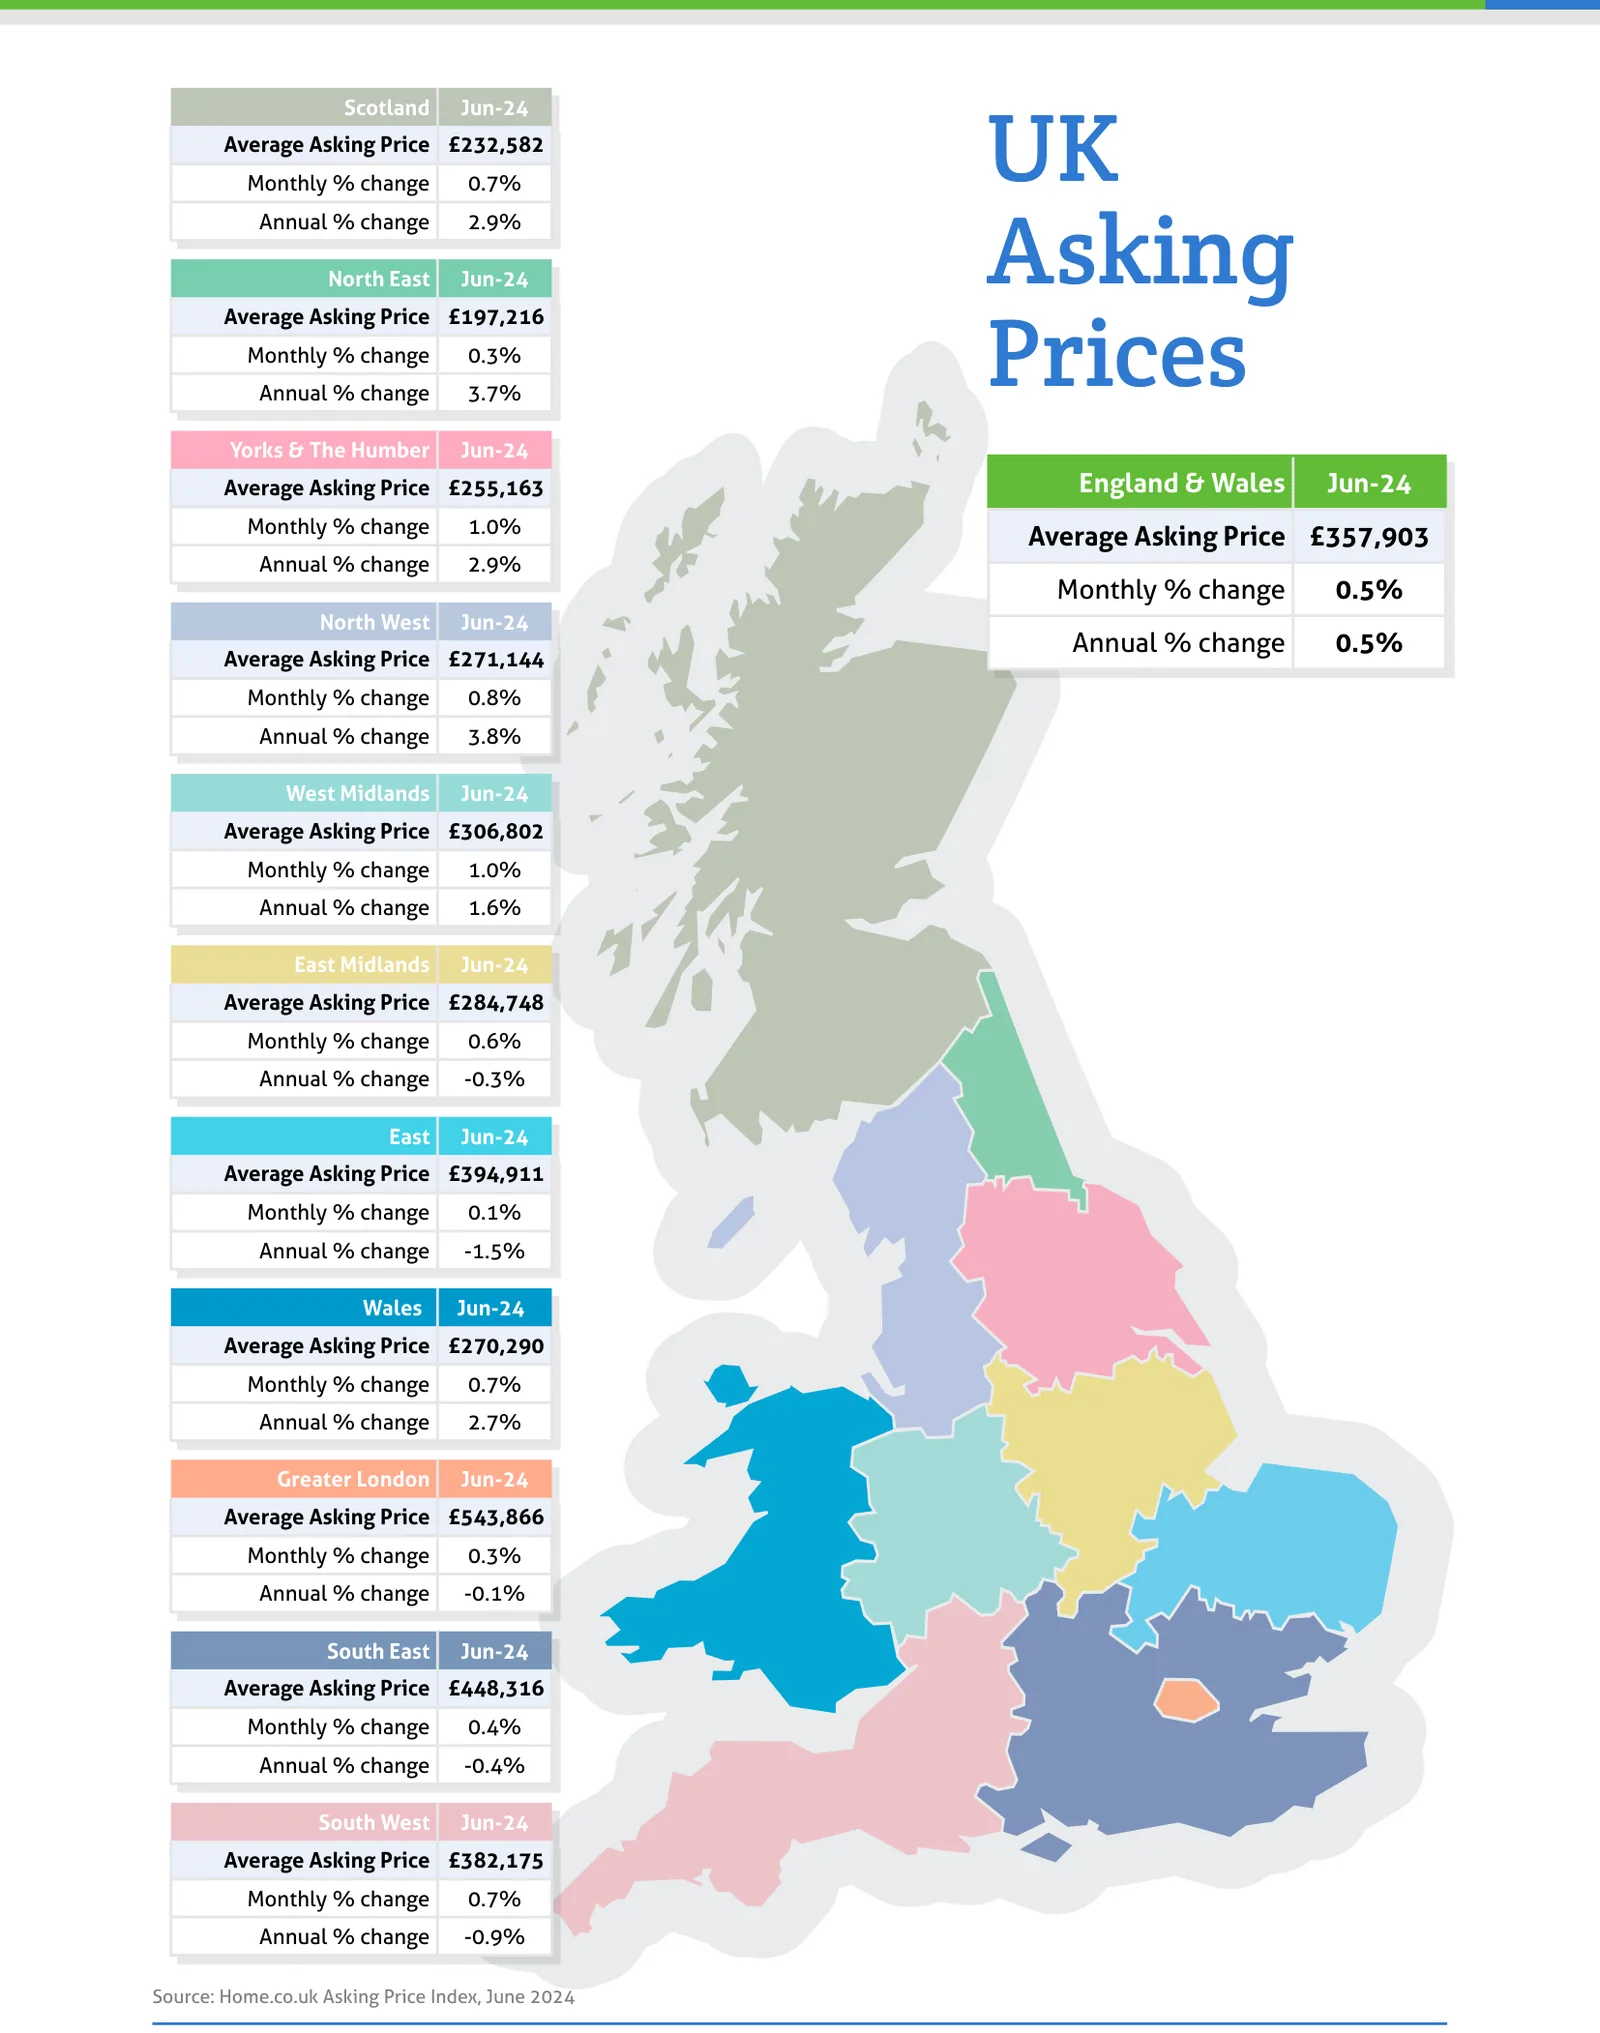
Source: Home.co.uk Asking Price Index, June 2024
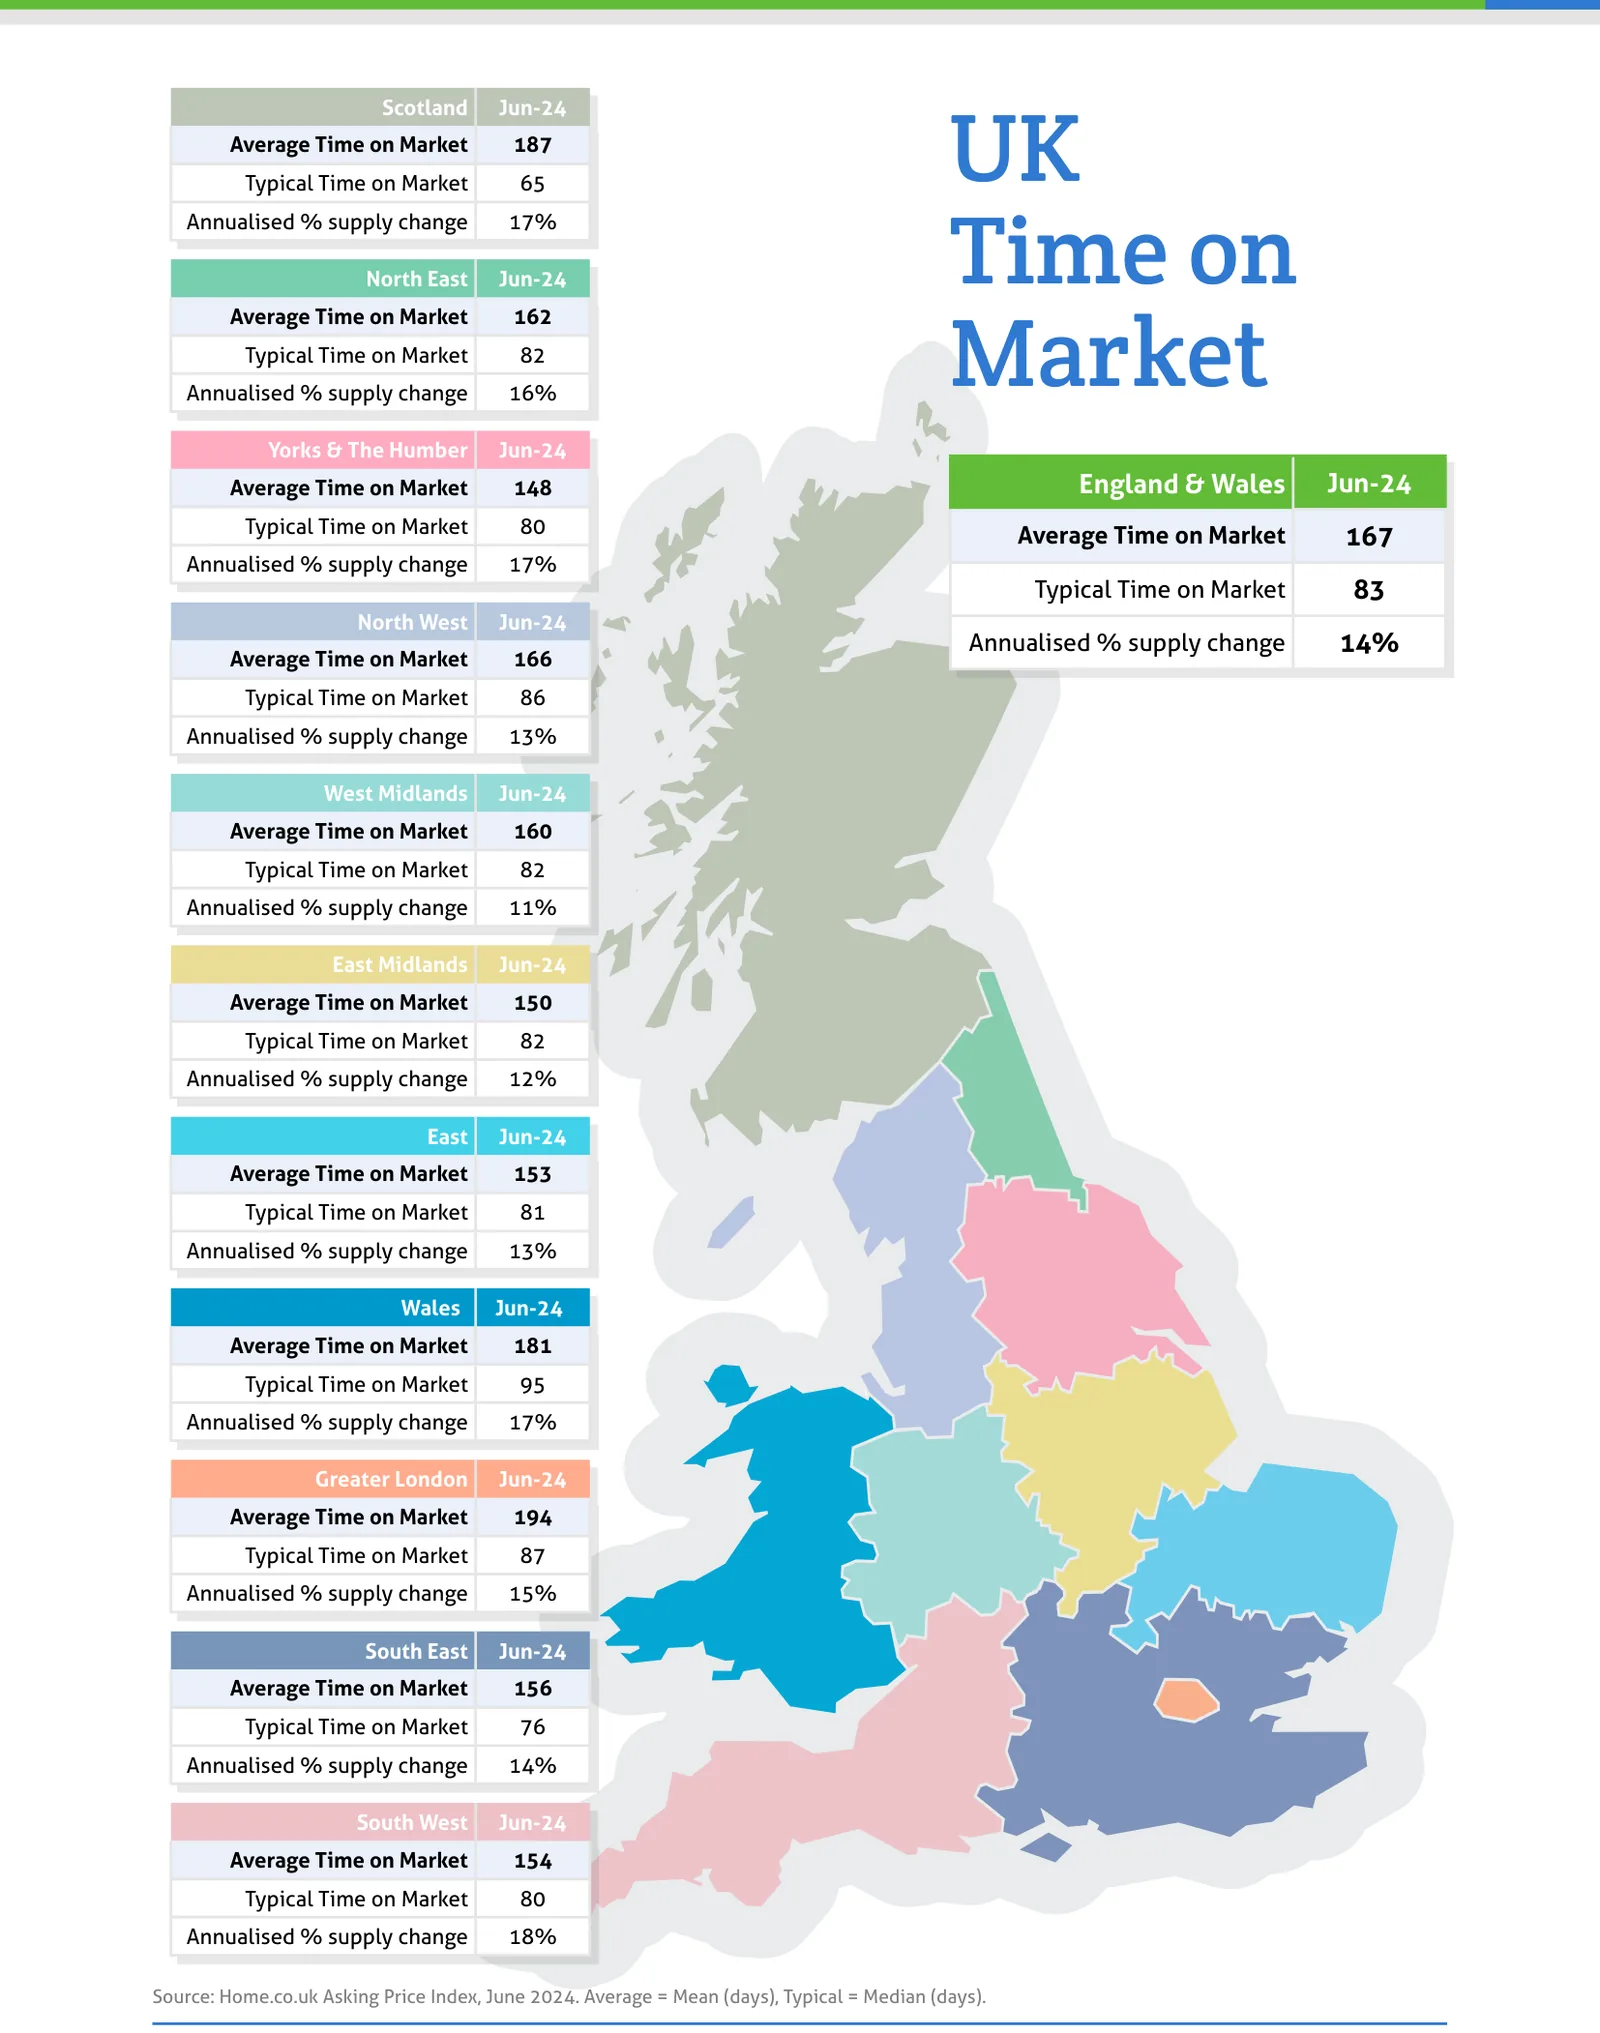
Source: Home.co.uk Asking Price Index, June 2024. Average = Mean (days), Typical = Median (days).
Regional tables
UK Asking Prices, Jun-24
| Region | Average Asking Price | Monthly % change | Annual % change |
|---|---|---|---|
| Scotland | £232,582 | 0.7% | 2.9% |
| North East | £197,216 | 0.3% | 3.7% |
| Yorks & The Humber | £255,163 | 1.0% | 2.9% |
| England & Wales | £357,903 | 0.5% | 0.5% |
| North West | £271,144 | 0.8% | 3.8% |
| West Midlands | £306,802 | 1.0% | 1.6% |
| East Midlands | £284,748 | 0.6% | -0.3% |
| East | £394,911 | 0.1% | -1.5% |
| Wales | £270,290 | 0.7% | 2.7% |
| Greater London | £543,866 | 0.3% | -0.1% |
| South East | £448,316 | 0.4% | -0.4% |
| South West | £382,175 | 0.7% | -0.9% |
UK Time on Market, Jun-24
| Region | Average Time on Market | Typical Time on Market | Annualised % supply change |
|---|---|---|---|
| Scotland | 187 | 65 | 17% |
| North East | 162 | 82 | 16% |
| Yorks & The Humber | 148 | 80 | 17% |
| England & Wales | 167 | 83 | 14% |
| North West | 166 | 86 | 13% |
| West Midlands | 160 | 82 | 11% |
| East Midlands | 150 | 82 | 12% |
| East | 153 | 81 | 13% |
| Wales | 181 | 95 | 17% |
| Greater London | 194 | 87 | 15% |
| South East | 156 | 76 | 14% |
| South West | 154 | 80 | 18% |
From the director's commentary
"We need a rate cut and we need it now! Not just for the sake of the UK property market but for the economy as a whole."
Doug Shephard, Director at Home.co.uk
Read the full June 2024 edition (PDF, 9 pages)
About the Home Asking Price Index
The Home Asking Price Index measures the change in the prices sellers ask for residential property across England, Wales and Scotland. Today it is computed every month from around half a million advertised homes and is mix-adjusted, so a change in what happens to be on the market does not move the figure; earlier editions state the sample they were built from. Because an asking price is set months before a sale completes, the index runs around five months ahead of completed-sale measures such as the UK House Price Index.
Every edition in the archive, back to October 2006, is listed on the index page. How we measure the UK property market explains the listing data behind it, and today's figures by area are on house prices and rental prices.
Text and figures above are quoted from the June 2024 edition as published, with punctuation normalised for the web, and are not revised. Later editions may restate them.
More in What is happening to house prices: the Home guide
Thinking about your next move?
See what your home's worth in seconds, with the UK's longest-running property data behind it.
Get an instant valuation