

























Home Asking Price Index, June 2023: lower marketing times and limited stock afford steady price growth
Asking prices in England and Wales rose 0.4% in May while marketing times fell and stock remained below the 10-year average.

This is the June 2023 edition of the Home Asking Price Index, released on 16 June 2023, under the headline:
Lower Marketing Times and Limited Stock Afford Steady Price Growth
The headlines and summary below are the report's own words, with the key figures as it published them, followed by the report's charts and regional tables as printed.
Headlines
- Asking prices across England and Wales rose again during May by 0.4% as the market shrugged off interest rate woes, although year-on-year growth slipped further into the negative again (-1.3%) due to the market correction late last year.
- The Typical Time on Market for unsold property in England and Wales decreased by two days during May to make the current median 79 days, indicating a healthy throughput of properties.
- Asking prices in April rose in Scotland, Wales and all English regions except the North East and East Midlands. The sharpest rise was in the South West (+0.9%).
- The total sales stock count for England and Wales dropped very slightly during May from 409,559 to 409,444. This total remains below the 10-year average of 417,431.
- The supply rate of new instructions entering the market continues to be benign: down 1% on May 2022 and down 15% on May 2018. Notably, London shows the largest regional year-on-year contraction (-12%).
- Typical Time on Market in May fell in Scotland, Wales and all English regions with the exception of the North West (up one day).
- The Scottish property market remains the new leader in terms of annualised regional price growth (4.9%), while London remains the backmarker at -3.5%.
- Rents across the UK continue to rise (11.4% annualised), led by Greater London (up 18.1%). Supply remains very tight in the lettings sector.
- The current new growth leaders in asking rents are the London boroughs of Bexley, Kensington and Hillingdon (+42%, +33% and +30% annualised respectively).
Summary
The UK property market continues to improve despite mortgage rate uncertainty. Prices are steadily recovering ground lost during last year's sudden correction. Marketing times are in the normal range and in no way indicate an overall slowdown. The northern regions, Scotland and Wales all show considerable improvements on their 2018 figures, while London and the southern English regions show slight increases compared to their pre-COVID figures.
All these key indicators show how truly resilient the market is: both quick to adapt to even severe financial shocks and then quick to recover. Of course, the unprecedented demand in the rental market is playing a key role in restricting supply in the sales market. Vastly improved yields and very short void periods (typically less than three weeks) make letting an attractive option for hesitant potential vendors.
Rapidly rising stock levels, which previously gave cause for concern, may well have maxed out at below the 10-year average, and this would be consistent with the seasonal ebb and flow of agents' portfolios which typically peak during the summer months. Supply of new instructions remains subdued and is currently running at 15% less than in May 2018. Going forward, this relative scarcity will serve to support prices further.
Key figures
| Measure | Figure |
|---|---|
| Monthly change in asking prices | +0.4% |
| Annual change in asking prices | -1.3% |
| Typical Time on Market | 79 days |
| New instructions vs May 2022 | -1% |
| New instructions vs May 2018 | -15% |
| UK average asking rent growth | 11.4% |
Figures are for England and Wales unless the report states otherwise, as published in the edition.
Charts from the report
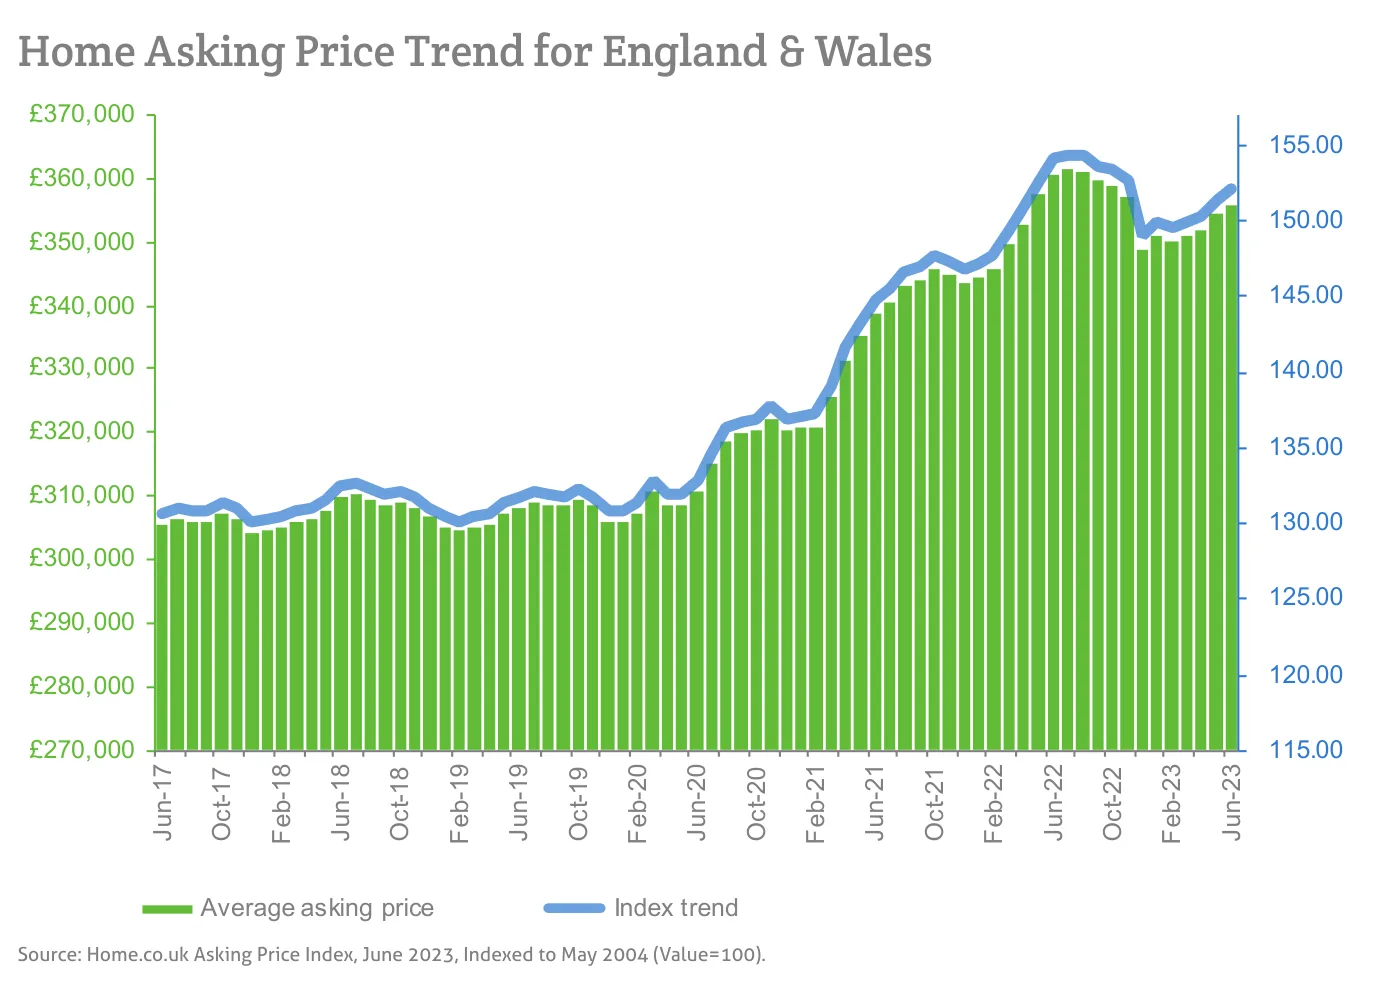
Source: Home.co.uk Asking Price Index, June 2023, Indexed to May 2004 (Value=100).
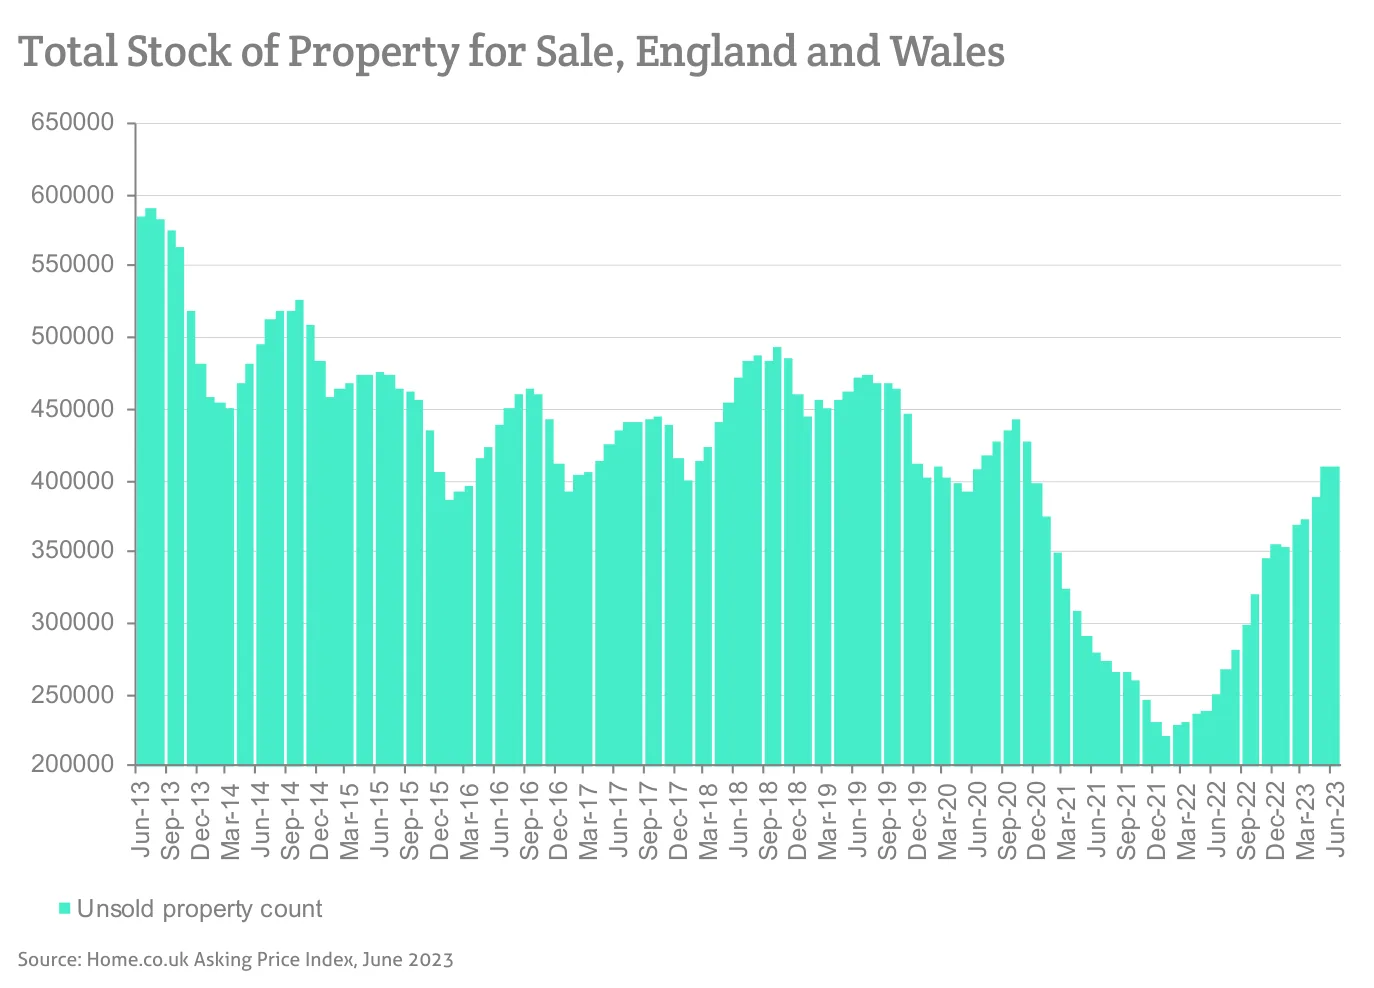
Source: Home.co.uk Asking Price Index, June 2023
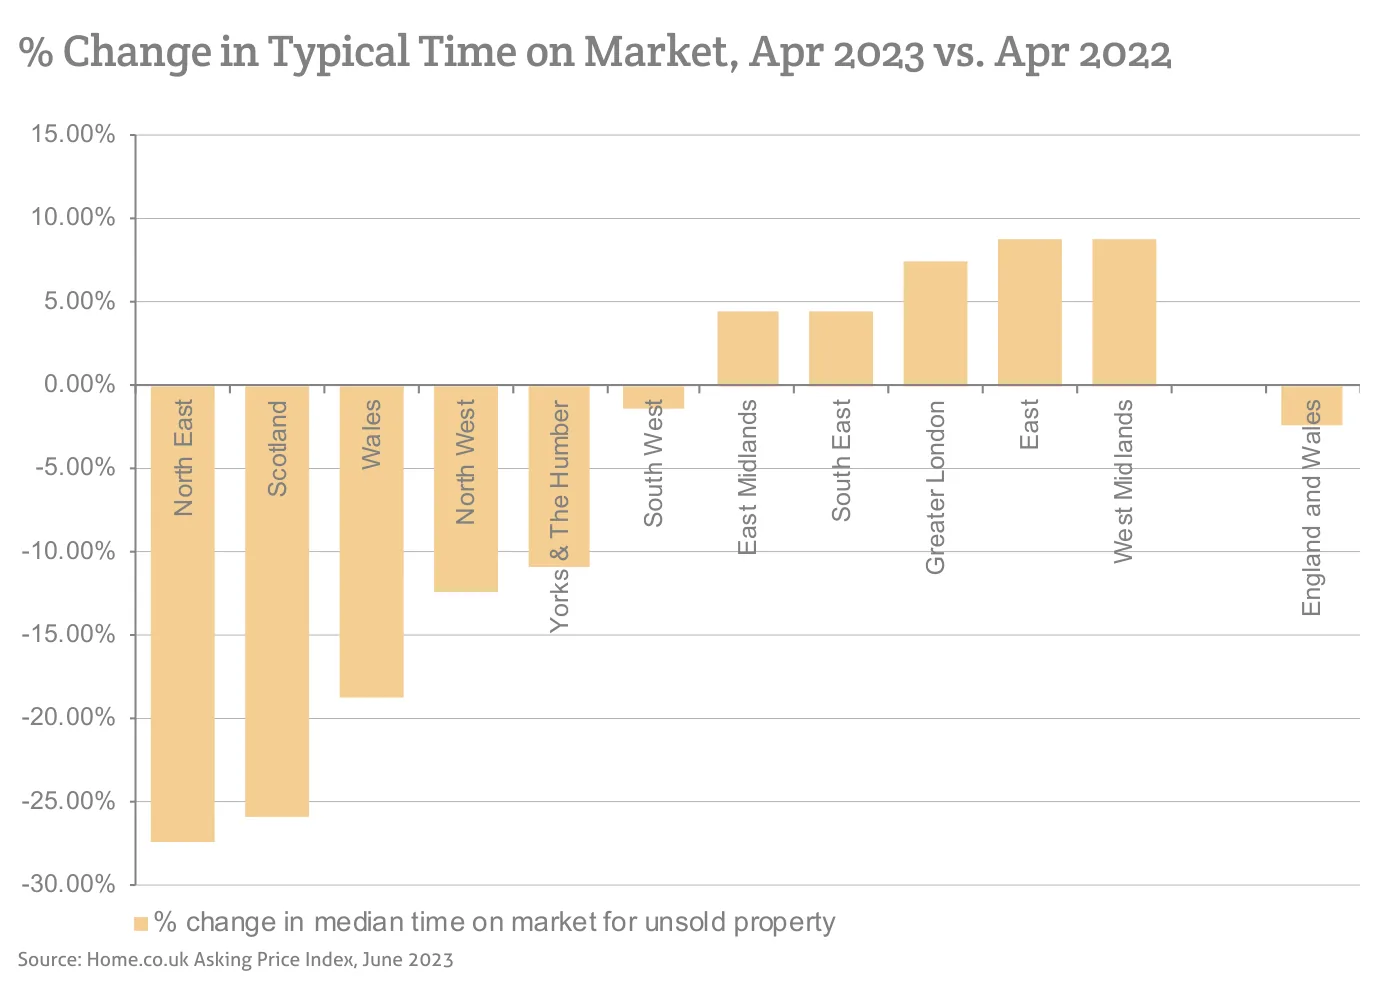
Source: Home.co.uk Asking Price Index, June 2023
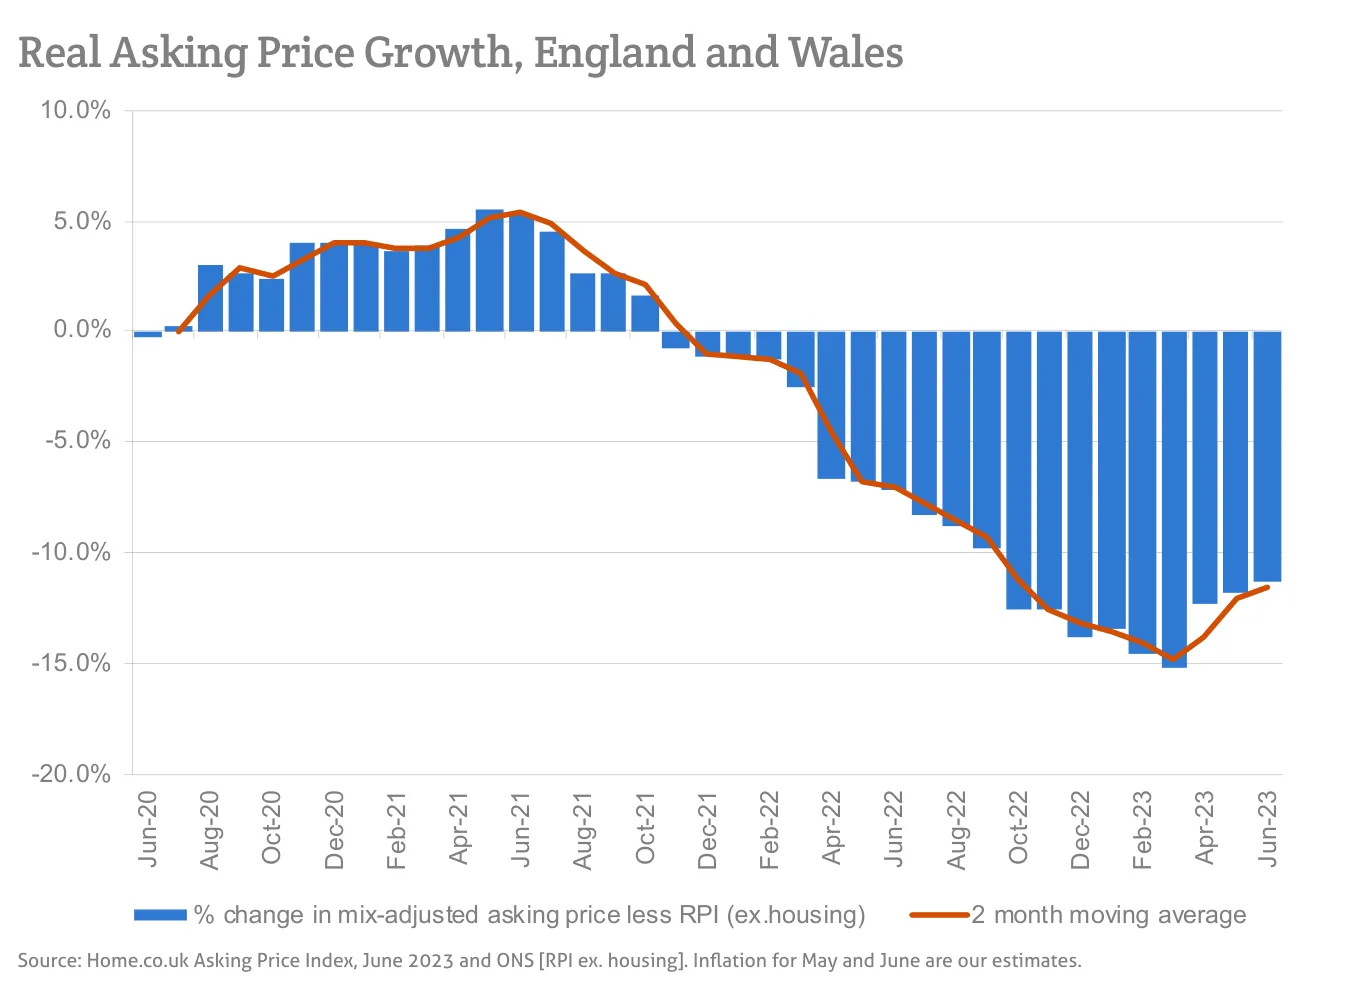
Source: Home.co.uk Asking Price Index, June 2023 and ONS [RPI ex. housing]. Inflation for May and June are our estimates.
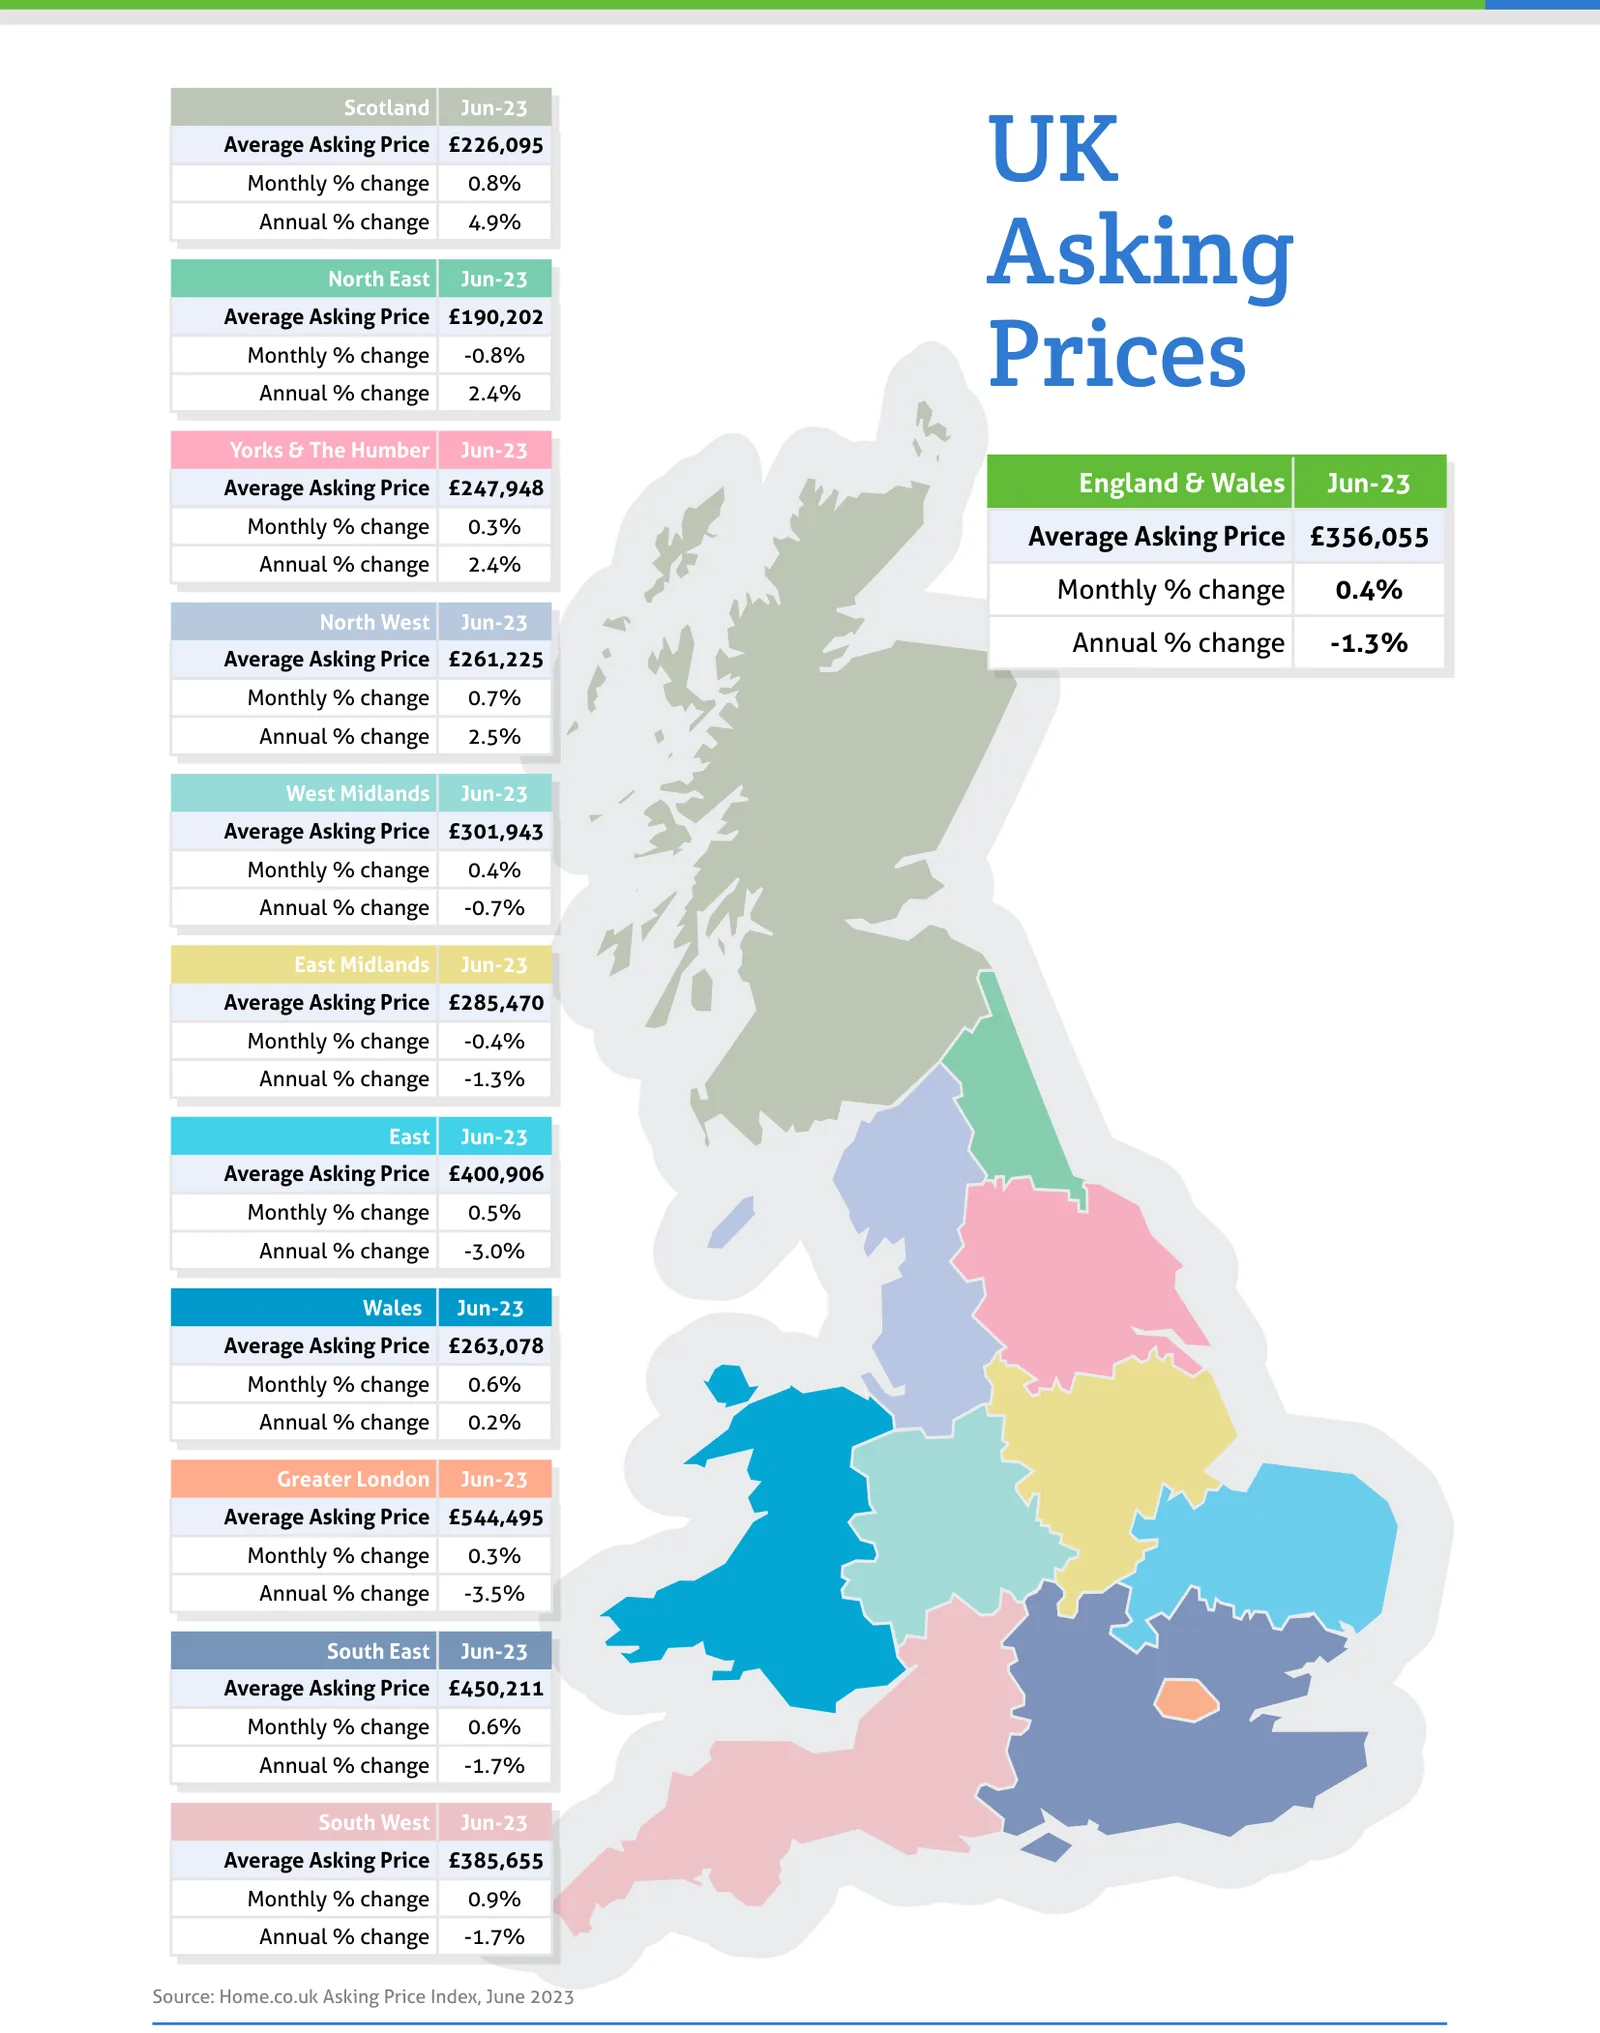
Source: Home.co.uk Asking Price Index, June 2023
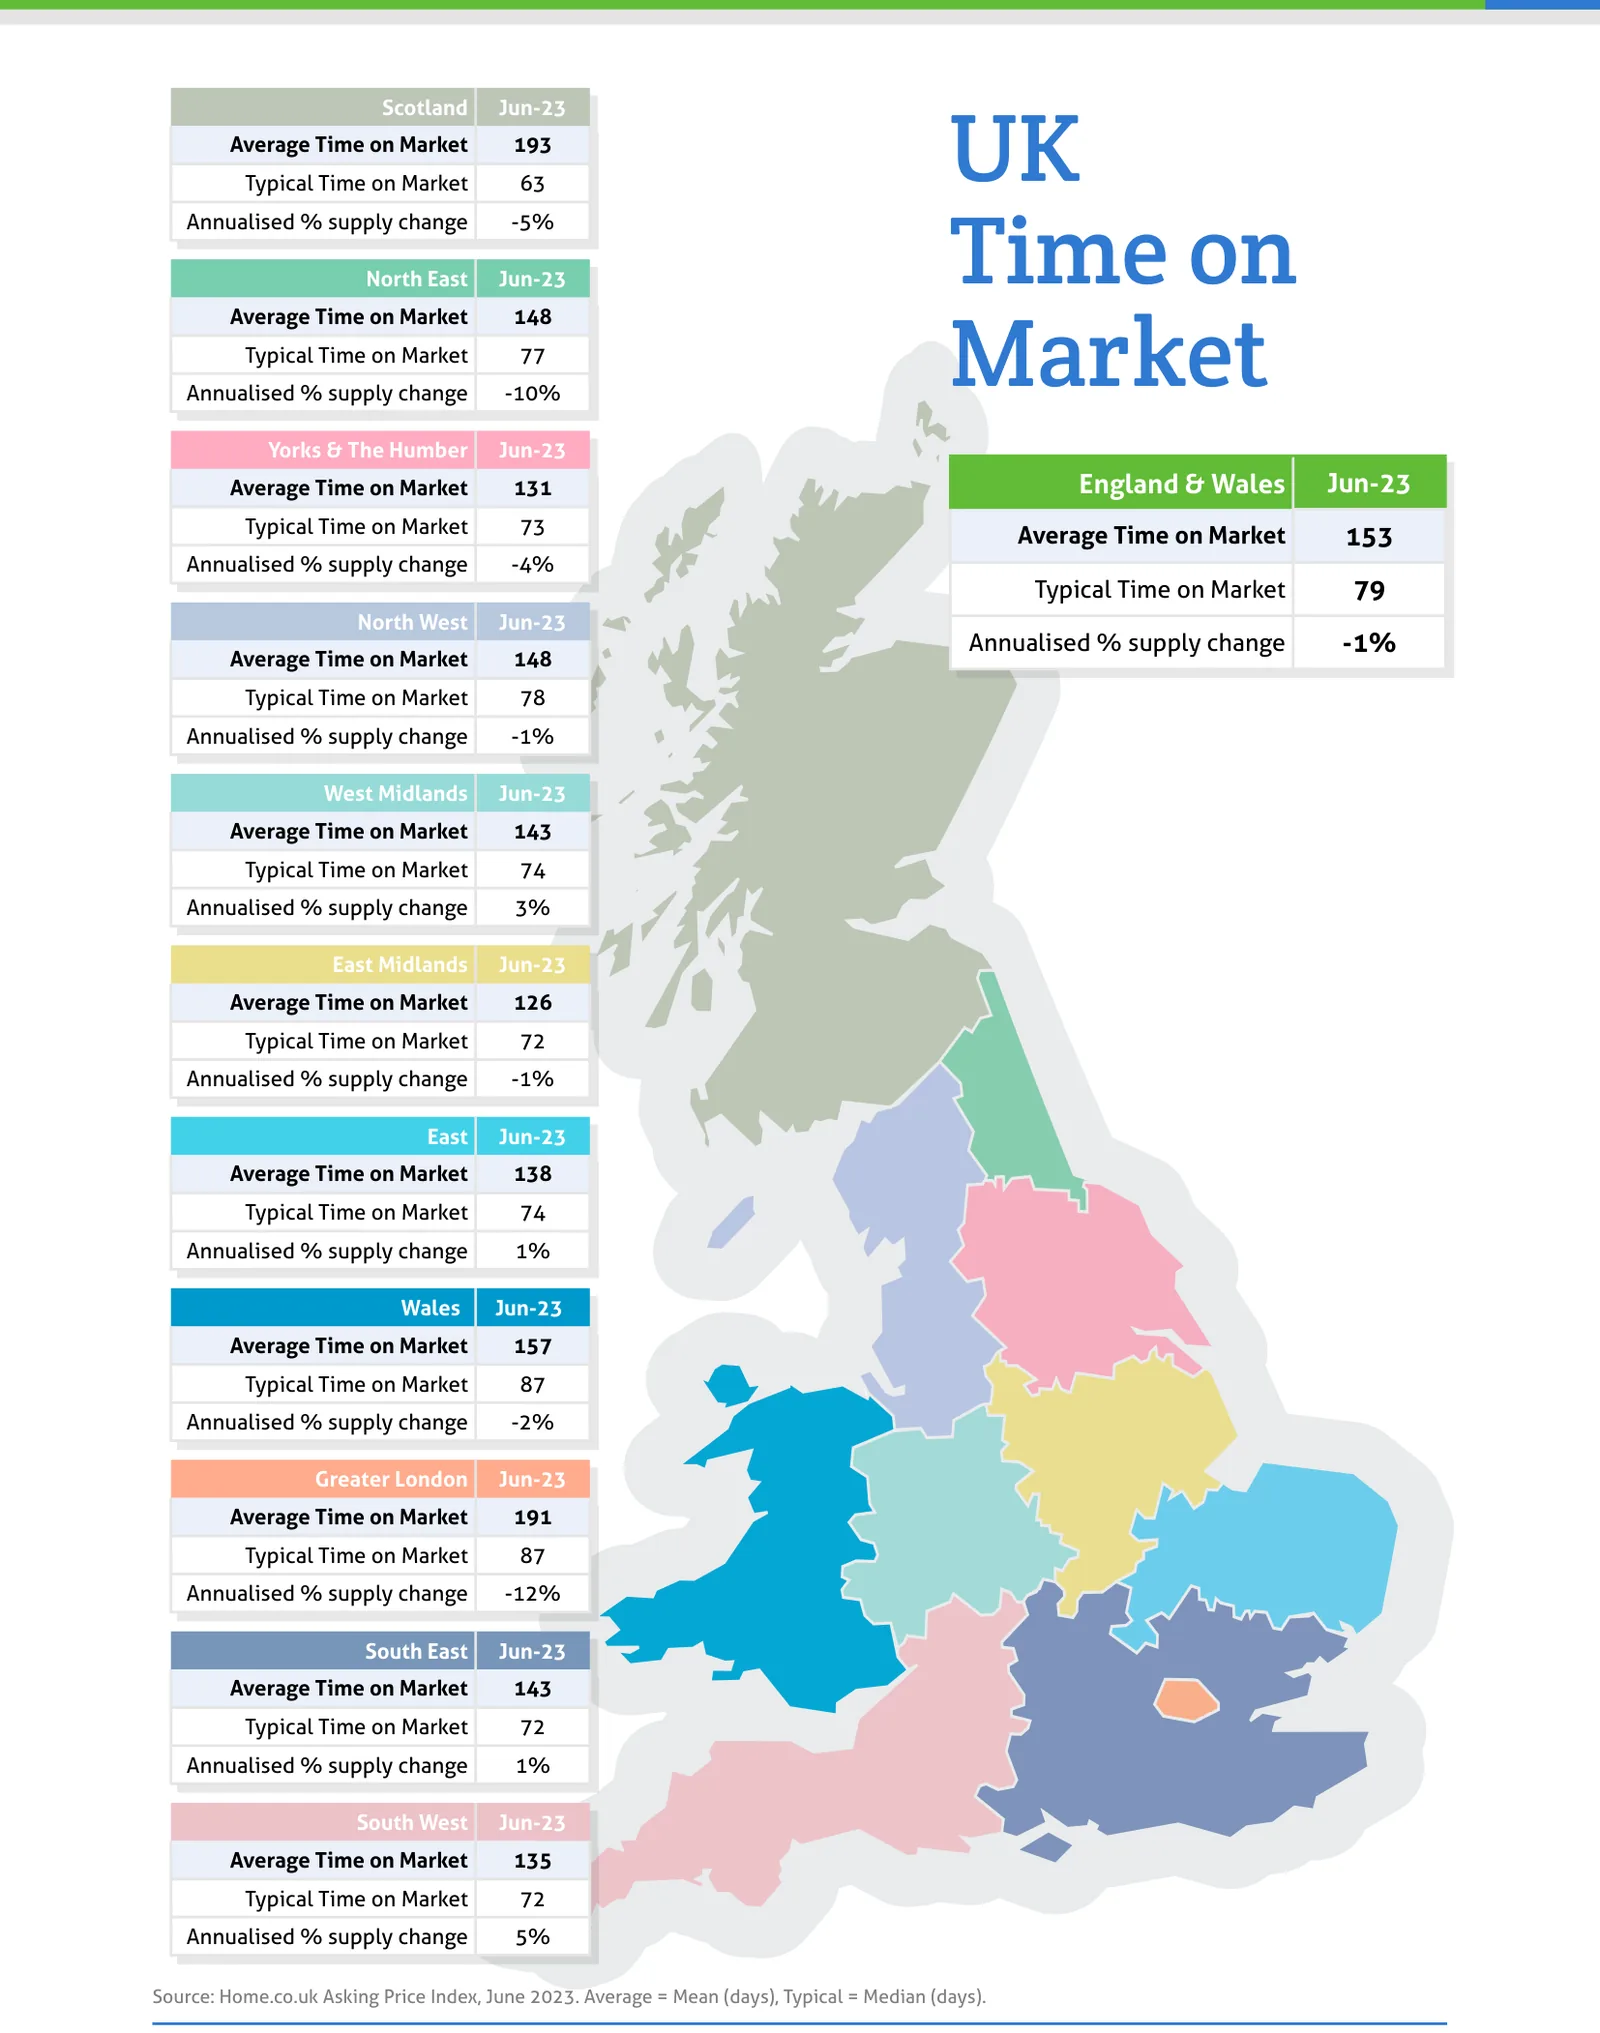
Source: Home.co.uk Asking Price Index, June 2023. Average = Mean (days), Typical = Median (days).
Regional tables
UK Asking Prices, Jun-23
| Region | Average Asking Price | Monthly % change | Annual % change |
|---|---|---|---|
| Scotland | £226,095 | 0.8% | 4.9% |
| North East | £190,202 | -0.8% | 2.4% |
| Yorks & The Humber | £247,948 | 0.3% | 2.4% |
| England & Wales | £356,055 | 0.4% | -1.3% |
| North West | £261,225 | 0.7% | 2.5% |
| West Midlands | £301,943 | 0.4% | -0.7% |
| East Midlands | £285,470 | -0.4% | -1.3% |
| East | £400,906 | 0.5% | -3.0% |
| Wales | £263,078 | 0.6% | 0.2% |
| Greater London | £544,495 | 0.3% | -3.5% |
| South East | £450,211 | 0.6% | -1.7% |
| South West | £385,655 | 0.9% | -1.7% |
UK Time on Market, Jun-23
| Region | Average Time on Market | Typical Time on Market | Annualised % supply change |
|---|---|---|---|
| Scotland | 193 | 63 | -5% |
| North East | 148 | 77 | -10% |
| Yorks & The Humber | 131 | 73 | -4% |
| England & Wales | 153 | 79 | -1% |
| North West | 148 | 78 | -1% |
| West Midlands | 143 | 74 | 3% |
| East Midlands | 126 | 72 | -1% |
| East | 138 | 74 | 1% |
| Wales | 157 | 87 | -2% |
| Greater London | 191 | 87 | -12% |
| South East | 143 | 72 | 1% |
| South West | 135 | 72 | 5% |
Read the full June 2023 edition (PDF, 9 pages)
About the Home Asking Price Index
The Home Asking Price Index measures the change in the prices sellers ask for residential property across England, Wales and Scotland. Today it is computed every month from around half a million advertised homes and is mix-adjusted, so a change in what happens to be on the market does not move the figure; earlier editions state the sample they were built from. Because an asking price is set months before a sale completes, the index runs around five months ahead of completed-sale measures such as the UK House Price Index.
Every edition in the archive, back to October 2006, is listed on the index page. How we measure the UK property market explains the listing data behind it, and today's figures by area are on house prices and rental prices.
Text and figures above are quoted from the June 2023 edition as published, with punctuation normalised for the web, and are not revised. Later editions may restate them.
More in What is happening to house prices: the Home guide
Thinking about your next move?
See what your home's worth in seconds, with the UK's longest-running property data behind it.
Get an instant valuation