

























Home Asking Price Index, June 2022: inflation outpaces home price growth
Asking prices in England and Wales rose 0.9% in May, lifting annual growth to 6.5%, while inflation reached 13%.

This is the June 2022 edition of the Home Asking Price Index, released on 15 June 2022, under the headline:
Inflation Outpaces Home Price Growth
The headlines and summary below are the report's own words, with the key figures as it published them, followed by the report's charts and regional tables as printed.
Headlines
- Asking prices across England and Wales surged a further 0.9% overall in May, bringing the year-on-year rise to 6.5% while inflation leapt to 13% (RPI ex. housing).
- The property market continues to outpace even last year's blistering pace. Typical Time on Market (median) for unsold property is 60 days, which is 16 days less than in June 2021.
- Supply eases slightly as vendors are tempted by much higher prices. Five per cent more properties were placed on the market last month compared to May 2021. London, however, indicated a 4% year-on-year drop in supply.
- The total stock of property for sale in England and Wales nudged up again and passed the 250,000 mark for the first time since October last year.
- The South West property market continues to lead in annualised regional price growth (+10.0%), narrowly ahead of Wales (+9.5%).
- Rents in Greater London continue their upward spiral. High demand and falling supply of available properties to let has pushed up annualised rental growth an alarming 27.6%. The mix-adjusted average monthly rent in the capital region is now 25% higher than in pre-COVID June 2019.
- Asking rent growth across the UK currently stands at 18.8% year-on-year.
- Central London rents continue to set new records as supply plummets. Aside from the City (+51%), the greatest rises in asking rents over the last twelve months are now in Lambeth (+44%) and Hackney (+43%).
Summary
It is becoming clear that the Bank of England's paltry efforts to tame inflation are not working. The Bank is expected to continue their impotent strategy and raise the UK benchmark rate by just a quarter point next week to 1.25%, while the purchasing power of sterling collapses. Even by their own preferred measure (CPI), inflation is now 4.5 times their target rate and climbing. Of course, the unprecedentedly large and widening spread between mortgage interest rates and inflation specifically incentivises highly leveraged property purchases.
The UK property market forges ahead seemingly undeterred by economic woes and foreign conflicts. Demand remains high, even increasing in London and the North East. Stock levels remain very low by historic standards and consequently prices continue to rise rapidly across all regions. The supply of new instructions entering the market nudged up slightly this month as more potential vendors are tempted by record prices.
Key figures
| Measure | Figure |
|---|---|
| Monthly asking price change | 0.9% |
| Annual asking price change | 6.5% |
| Typical Time on Market | 60 days |
| Total unsold stock | 250,000 |
| Supply (new instructions) YoY | 5% |
| Properties with price reductions | 30,000 (12%) |
| UK asking rent growth YoY | 18.8% |
| RPI inflation (ex. housing) | 13% |
Figures are for England and Wales unless the report states otherwise, as published in the edition.
Charts from the report
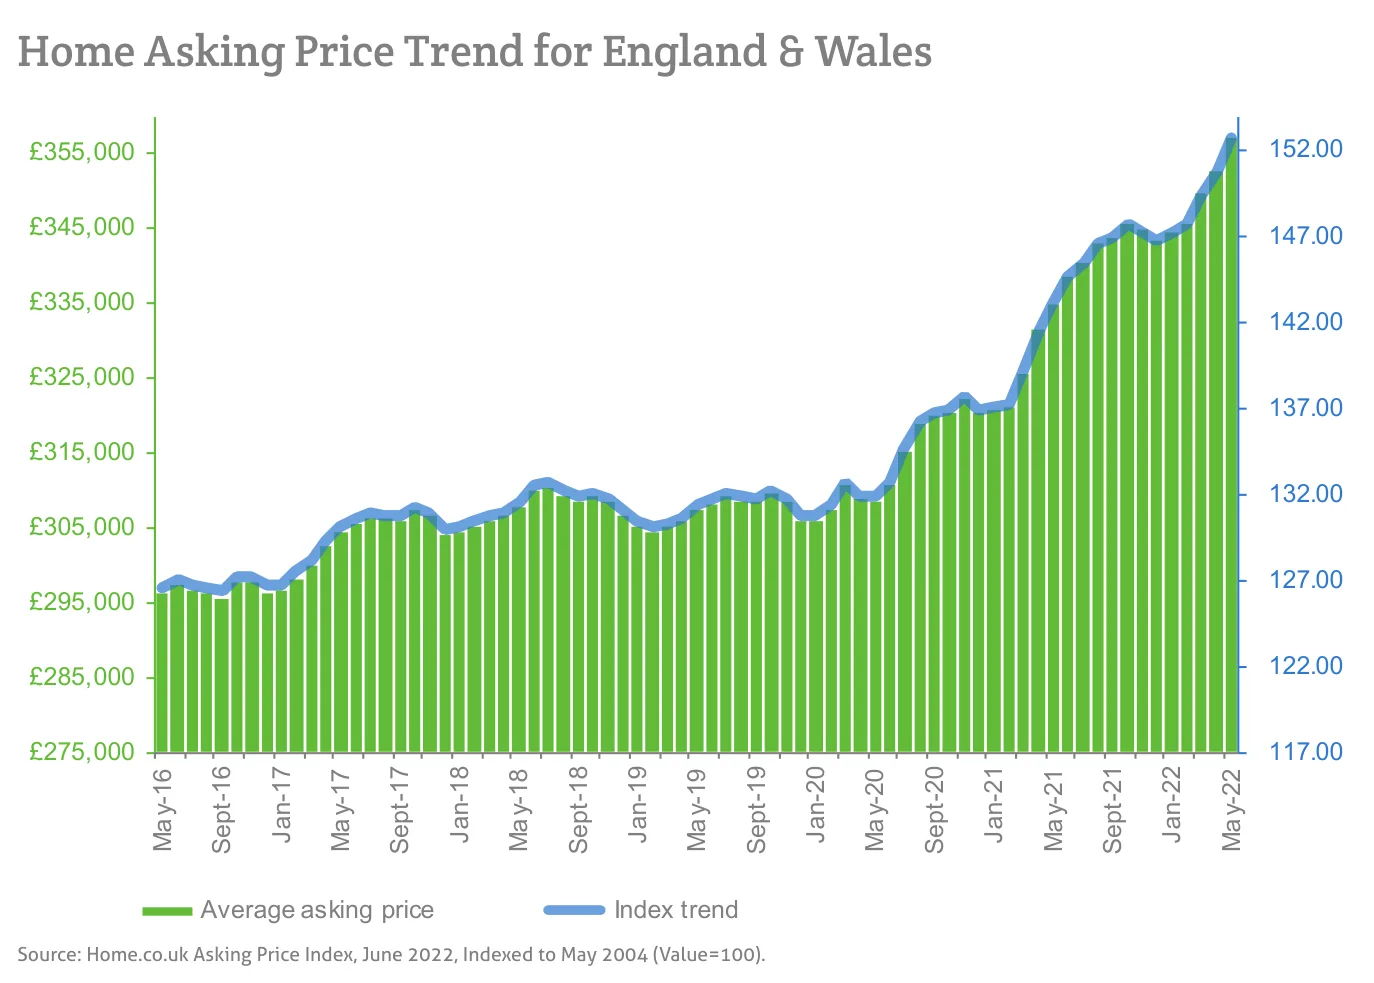
Source: Home.co.uk Asking Price Index, June 2022, Indexed to May 2004 (Value=100).
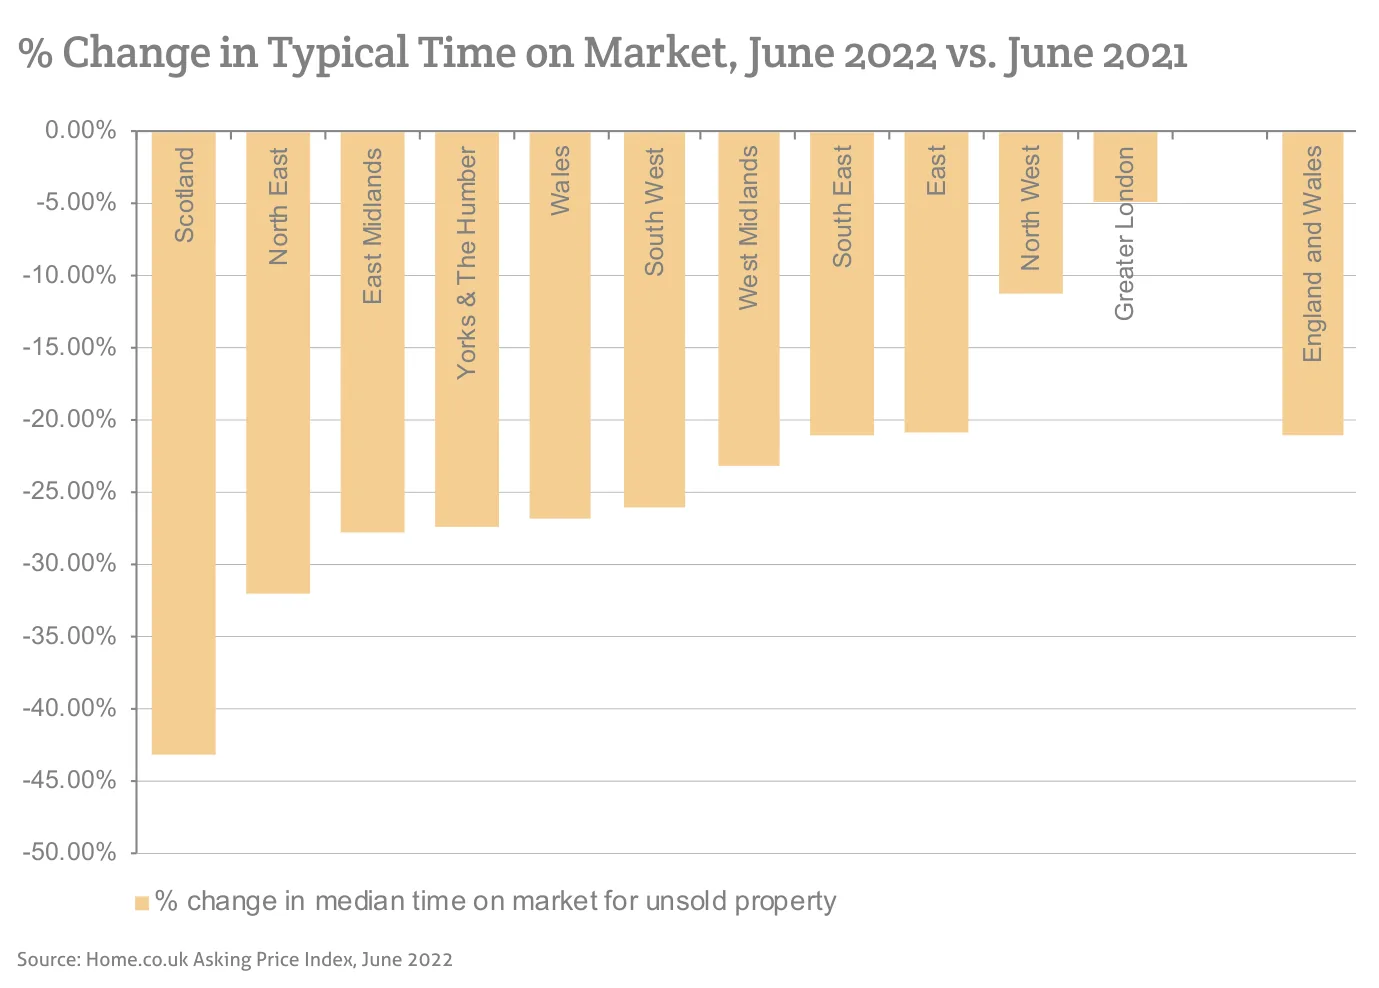
Source: Home.co.uk Asking Price Index, June 2022
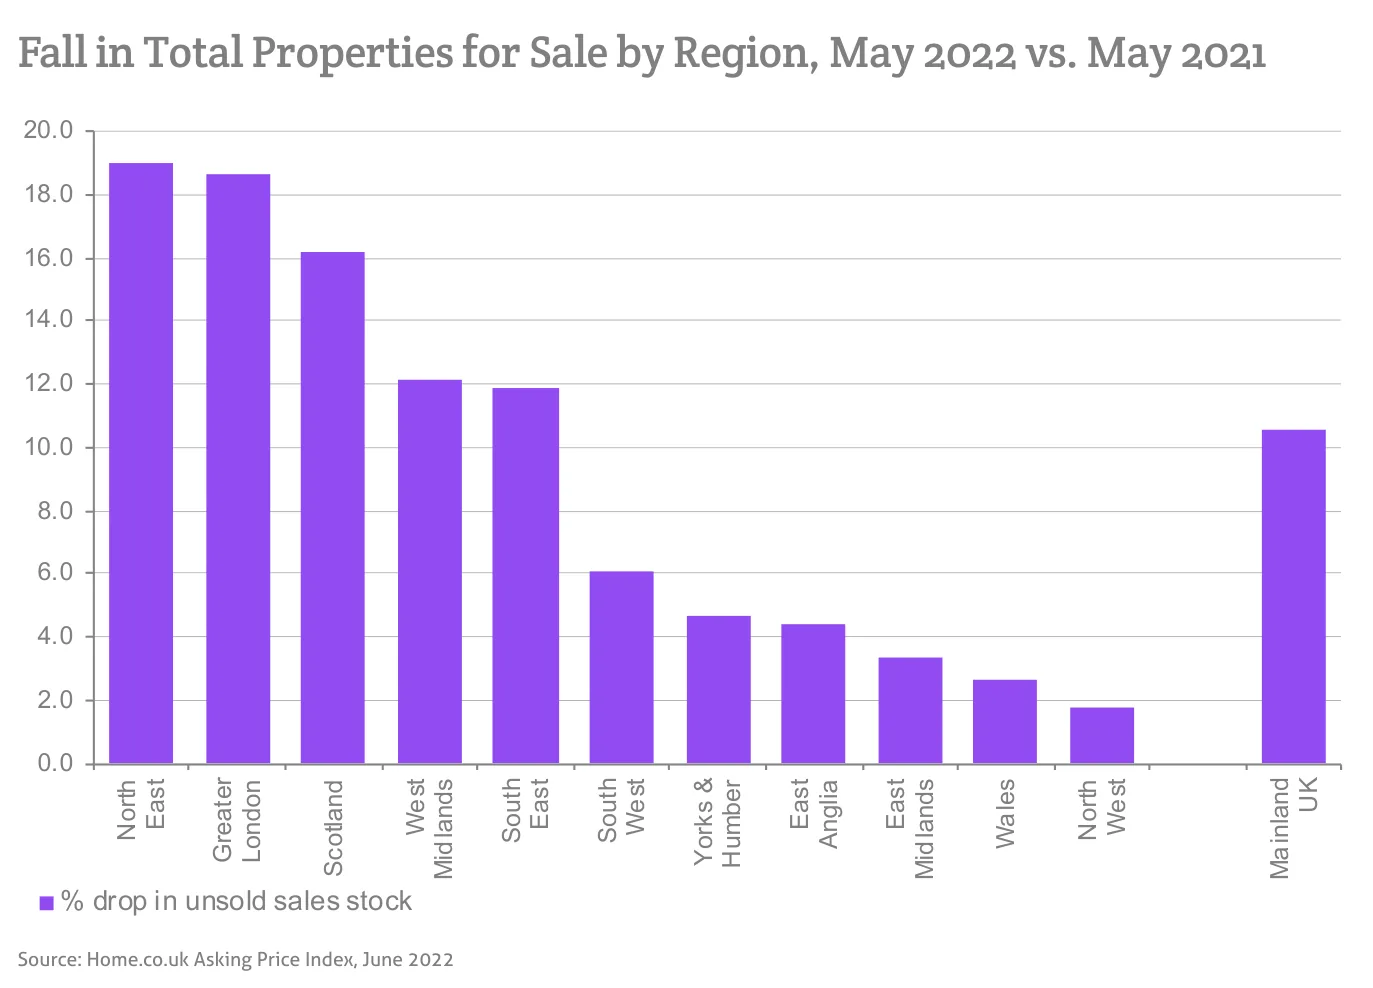
Source: Home.co.uk Asking Price Index, June 2022
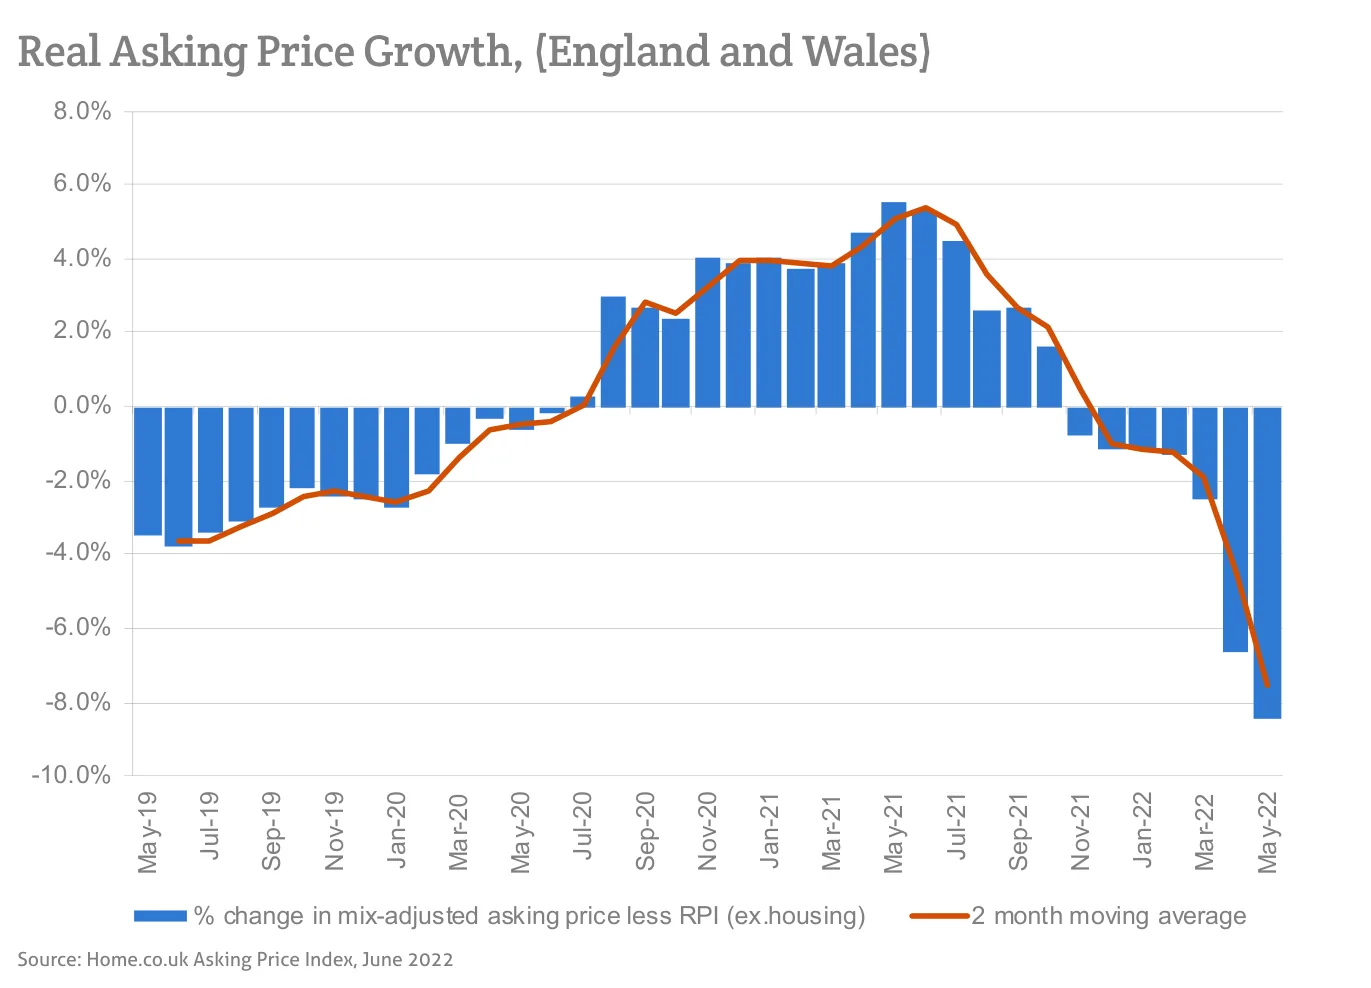
Source: Home.co.uk Asking Price Index, June 2022
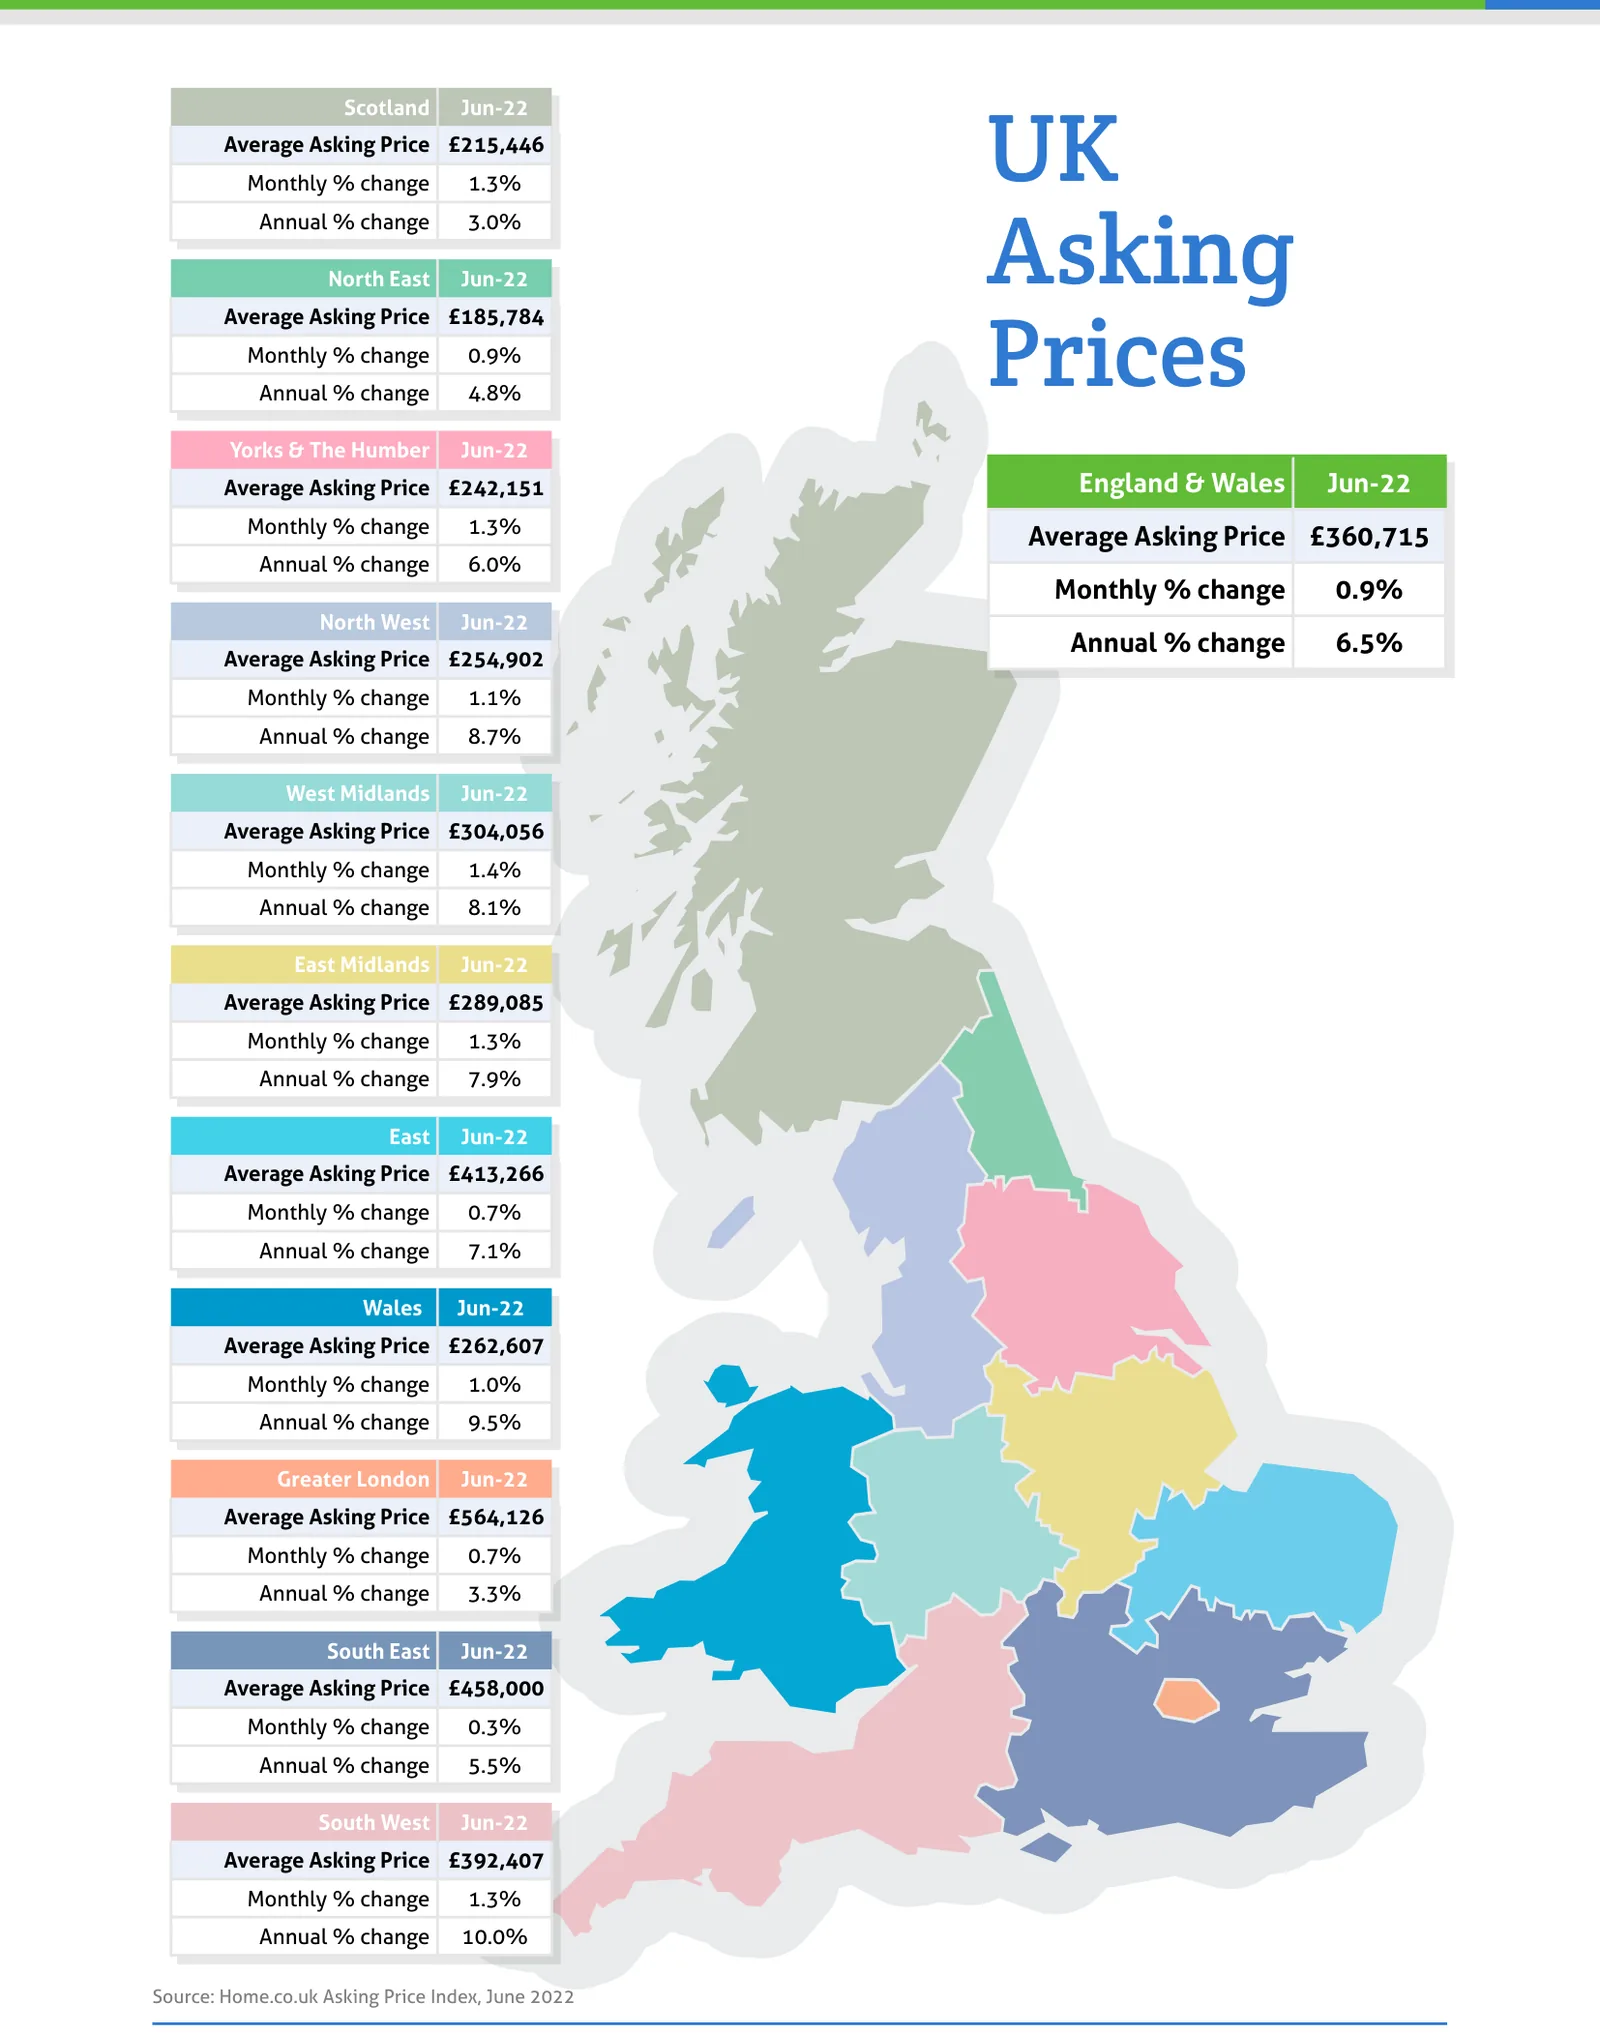
Source: Home.co.uk Asking Price Index, June 2022
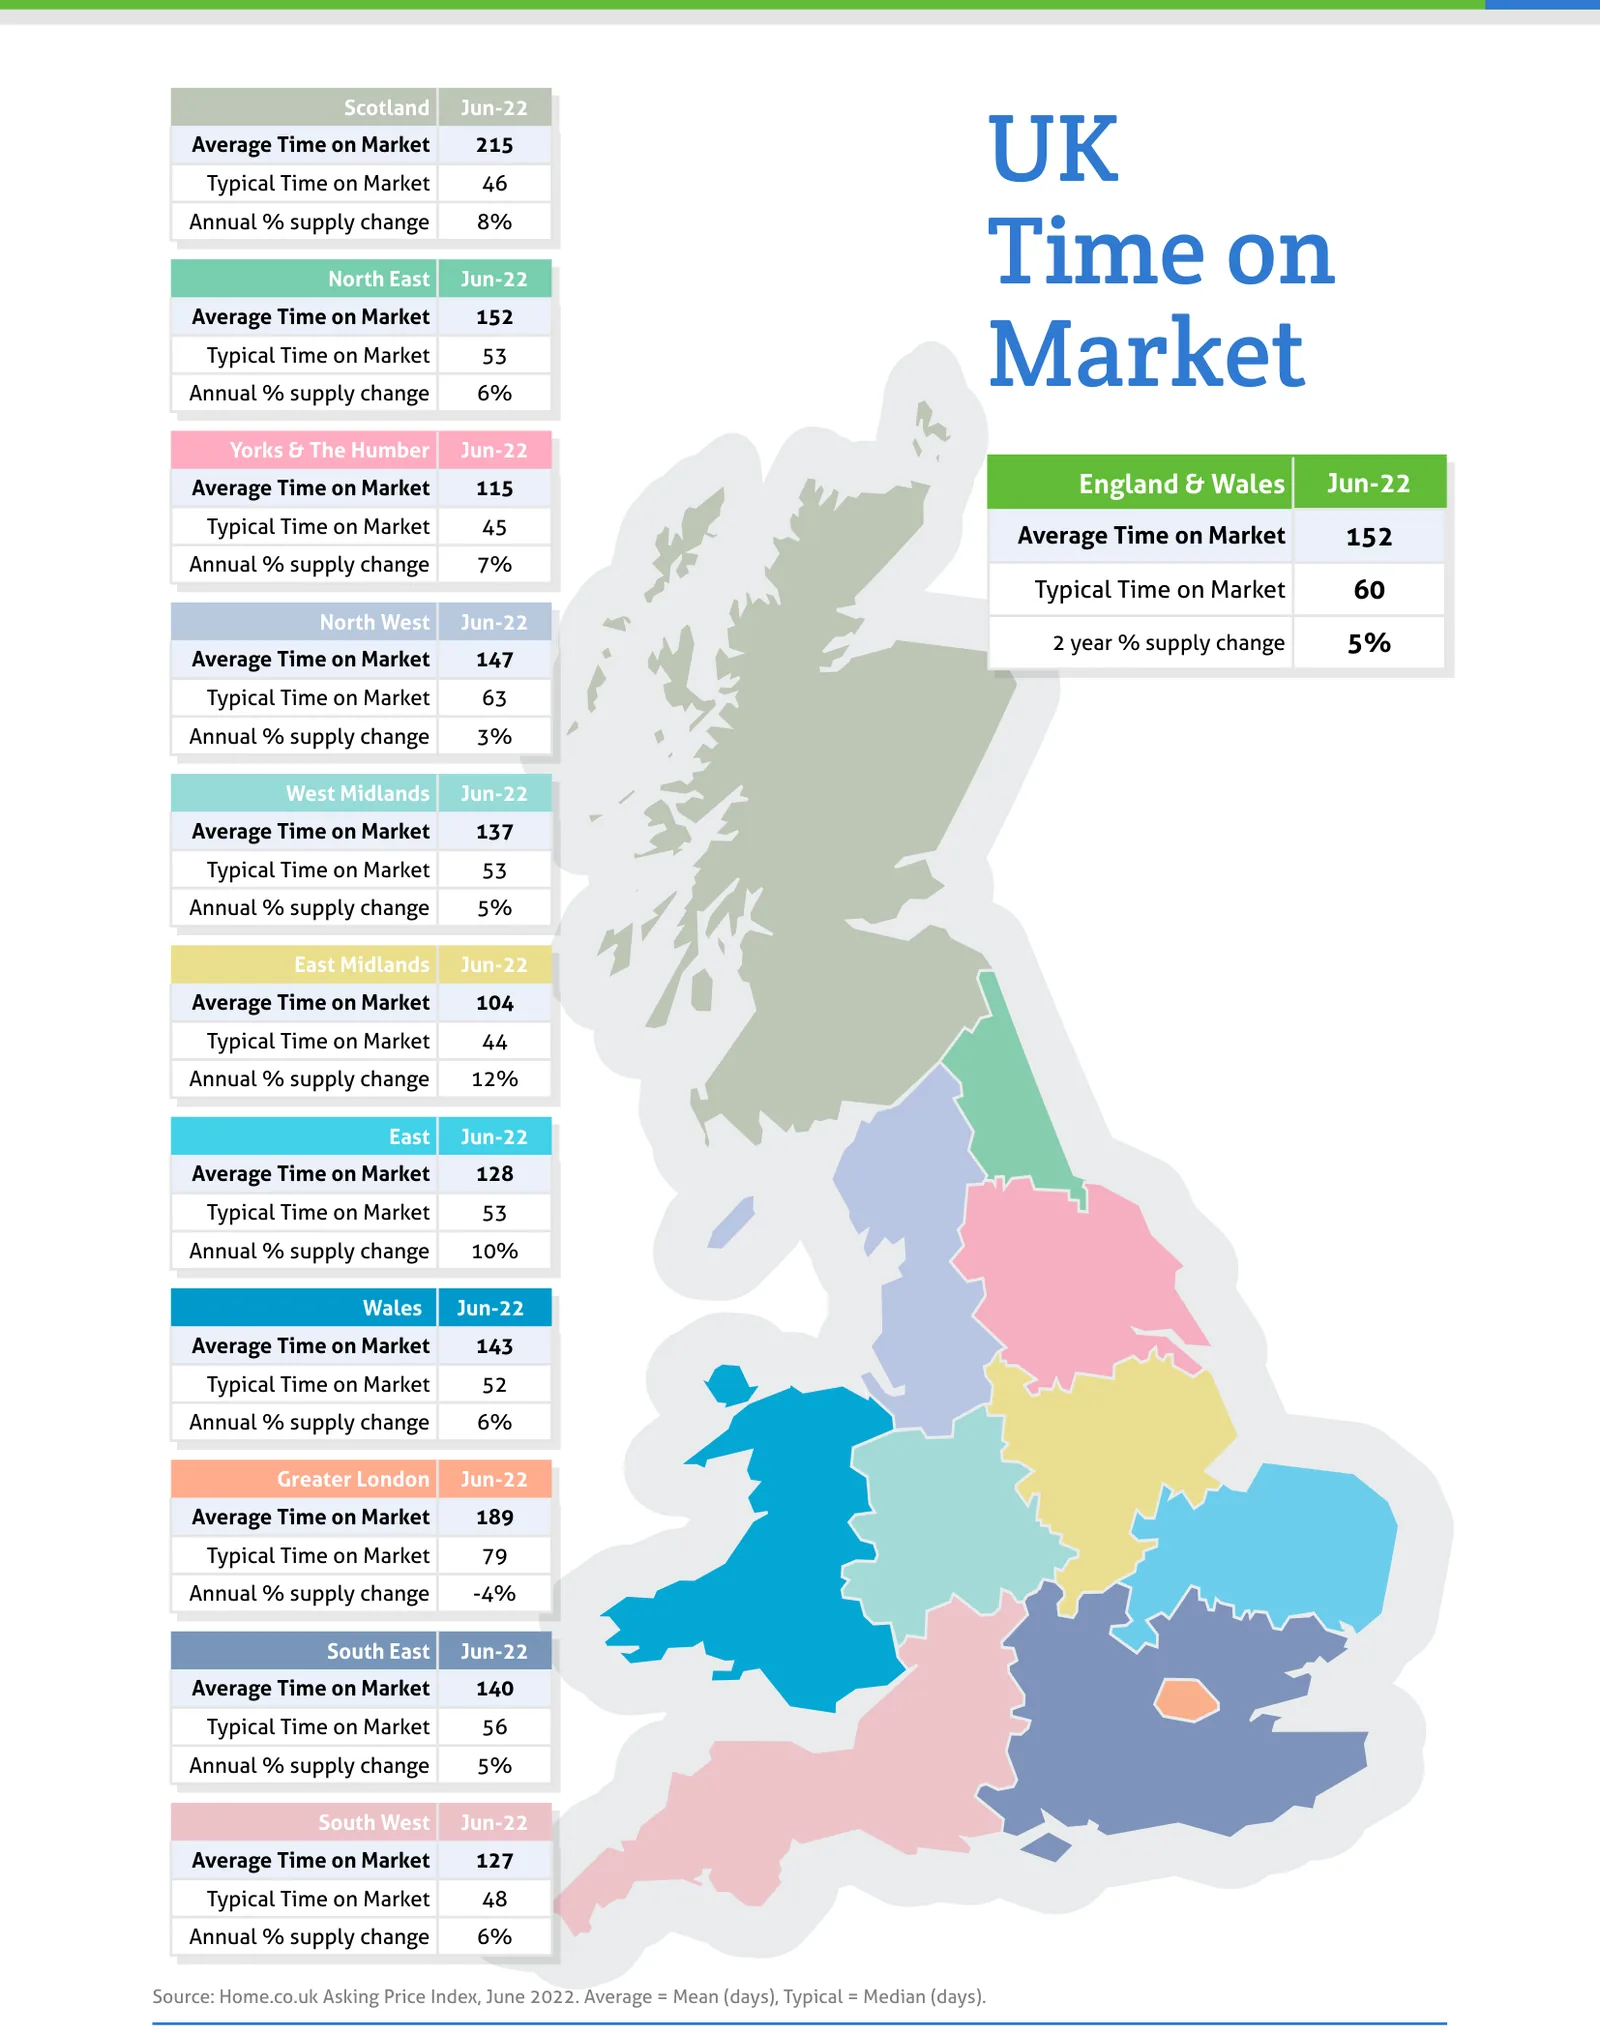
Source: Home.co.uk Asking Price Index, June 2022. Average = Mean (days), Typical = Median (days).
Regional tables
UK Asking Prices, Jun-22
| Region | Average Asking Price | Monthly % change | Annual % change |
|---|---|---|---|
| Scotland | £215,446 | 1.3% | 3.0% |
| North East | £185,784 | 0.9% | 4.8% |
| Yorks & The Humber | £242,151 | 1.3% | 6.0% |
| England & Wales | £360,715 | 0.9% | 6.5% |
| North West | £254,902 | 1.1% | 8.7% |
| West Midlands | £304,056 | 1.4% | 8.1% |
| East Midlands | £289,085 | 1.3% | 7.9% |
| East | £413,266 | 0.7% | 7.1% |
| Wales | £262,607 | 1.0% | 9.5% |
| Greater London | £564,126 | 0.7% | 3.3% |
| South East | £458,000 | 0.3% | 5.5% |
| South West | £392,407 | 1.3% | 10.0% |
UK Time on Market, Jun-22
| Region | Average Time on Market | Typical Time on Market | Annual % supply change |
|---|---|---|---|
| Scotland | 215 | 46 | 8% |
| North East | 152 | 53 | 6% |
| Yorks & The Humber | 115 | 45 | 7% |
| England & Wales | 152 | 60 | |
| North West | 147 | 63 | 3% |
| West Midlands | 137 | 53 | 5% |
| East Midlands | 104 | 44 | 12% |
| East | 128 | 53 | 10% |
| Wales | 143 | 52 | 6% |
| Greater London | 189 | 79 | -4% |
| South East | 140 | 56 | 5% |
| South West | 127 | 48 | 6% |
The report also prints '2 year % supply change' in 1 of its 12 region boxes (England & Wales 5%), so it is not a column of this table.
From the director's commentary
"What is clear is that that we have the wrong kind of inflation. Not the inevitable yet reassuring inflation that is the side effect of a booming economy but rather the Zimbabwe, French post-revolution or Weimar type that follows a sovereign debt crisis."
Doug Shephard, Director at Home.co.uk
Read the full June 2022 edition (PDF, 10 pages)
About the Home Asking Price Index
The Home Asking Price Index measures the change in the prices sellers ask for residential property across England, Wales and Scotland. Today it is computed every month from around half a million advertised homes and is mix-adjusted, so a change in what happens to be on the market does not move the figure; earlier editions state the sample they were built from. Because an asking price is set months before a sale completes, the index runs around five months ahead of completed-sale measures such as the UK House Price Index.
Every edition in the archive, back to October 2006, is listed on the index page. How we measure the UK property market explains the listing data behind it, and today's figures by area are on house prices and rental prices.
Text and figures above are quoted from the June 2022 edition as published, with punctuation normalised for the web, and are not revised. Later editions may restate them.
More in What is happening to house prices: the Home guide
Thinking about your next move?
See what your home's worth in seconds, with the UK's longest-running property data behind it.
Get an instant valuation