

























Home Asking Price Index, June 2021: sales supply plummets in the regions while London rents recover
England and Wales asking prices rose 1.1% in May, lifting annual growth to 9.0% while unsold stock fell to a record low of 279,019 properties.

This is the June 2021 edition of the Home Asking Price Index, released on 16 June 2021, under the headline:
Sales Supply Plummets in the Regions while London Rents Recover
The headlines and summary below are the report's own words, with the key figures as it published them, followed by the report's charts and regional tables as printed.
Headlines
- Monthly supply remains vastly below normal expectations in all regions (-37% compared to May 2019). The East of England is worst hit by scarcity (-47%) while Greater London shows the first month where supply has fallen below expectations (down 7% compared to May 2019).
- The total stock of property for sale in England and Wales has shrunk again, setting a further all-time low of 279,019, 31.6% lower than in June 2020 and 41.0% less than in June 2018.
- The pace of the market remains frantic as buyers feverishly grab what little sales stock remains available: Typical Time on Market for unsold property in England and Wales remains at just 76 days.
- Asking prices across England and Wales continue to soar, adding another 1.1% since last month and pushing up annualised average growth to 9.0% (the highest annualised growth since Sept 2014).
- Phenomenal demand chasing ever fewer properties has again forced up prices in every English region and Scotland since last month, with the largest hikes in the East Midlands (+2.1%), South West (+1.7%) and East of England (+1.5%).
- The East Midlands property market now leads the 12-month regional growth chart at 11.7%, followed closely by the East of England (11.5%), thereby outpacing the former leaders Yorkshire, Wales and the North West.
- Greater London remains the UK's worst-performing region with 5.1% annualised growth although early indicators suggest that this market may soon pick up.
- Rents show signs of a strong recovery in the Greater London lettings market. Whilst average rents are still down overall on a year ago, most boroughs show significant rises over the last three months. The greatest rises in asking rents over the last quarter were in the City (+30.1%), Wandsworth (+9.7%) and Westminster (+7.5%). The recovery is driven by returning demand and attenuation of supply.
- A marked scarcity of rental properties persists in all other English regions, Scotland and Wales, thereby driving up rents. Rent rises are in double digits in five of the nine English regions.
- The largest annualised average rent hikes are in the East of England (+11.1%) and the South West (+16.1%).
Summary
The home buying frenzy continues apace, driving up asking prices and radically reducing the stock of property for sale across most of the UK. The London sales market remains relatively slow and lack of demand due to COVID has suppressed prices, especially in more central areas. The London rental market, on the other hand, looks like it may have turned the corner after a disastrous performance during 2020 and the first quarter of this year. Significant rent rises over the last three months and a slowdown in supply indicates that demand is returning. Should this recovery continue, improving yields will help support the recovery of the London sales market going forward.
Scarcity continues to push up prices and rents in most parts of the country. Supply of new instructions remains surprisingly low compared to pre-COVID levels (down 37% in May 2021 vs. May 2019). Normally in such a hot market, potential vendors would rush to sell in order to cash in on frothy pricing. Not this time around, it seems, and the most likely cause of this reticence is the vibrant rental market that has a voracious appetite for new lettings stock. Double-digit rent rises and low void times are luring many owners to hang on to their properties and let them out instead.
Key figures
| Measure | Figure |
|---|---|
| Mix-adjusted average asking price annual growth | +9.0% |
| Monthly change in asking prices | +1.1% |
| Typical Time on Market | 76 days |
| Total unsold stock (England & Wales) | 279,019 |
| Stock change vs June 2020 | -31.6% |
| Stock change vs June 2018 | -41.0% |
| New instructions change (UK, vs May 2019) | -37% |
Figures are for England and Wales unless the report states otherwise, as published in the edition.
Charts from the report
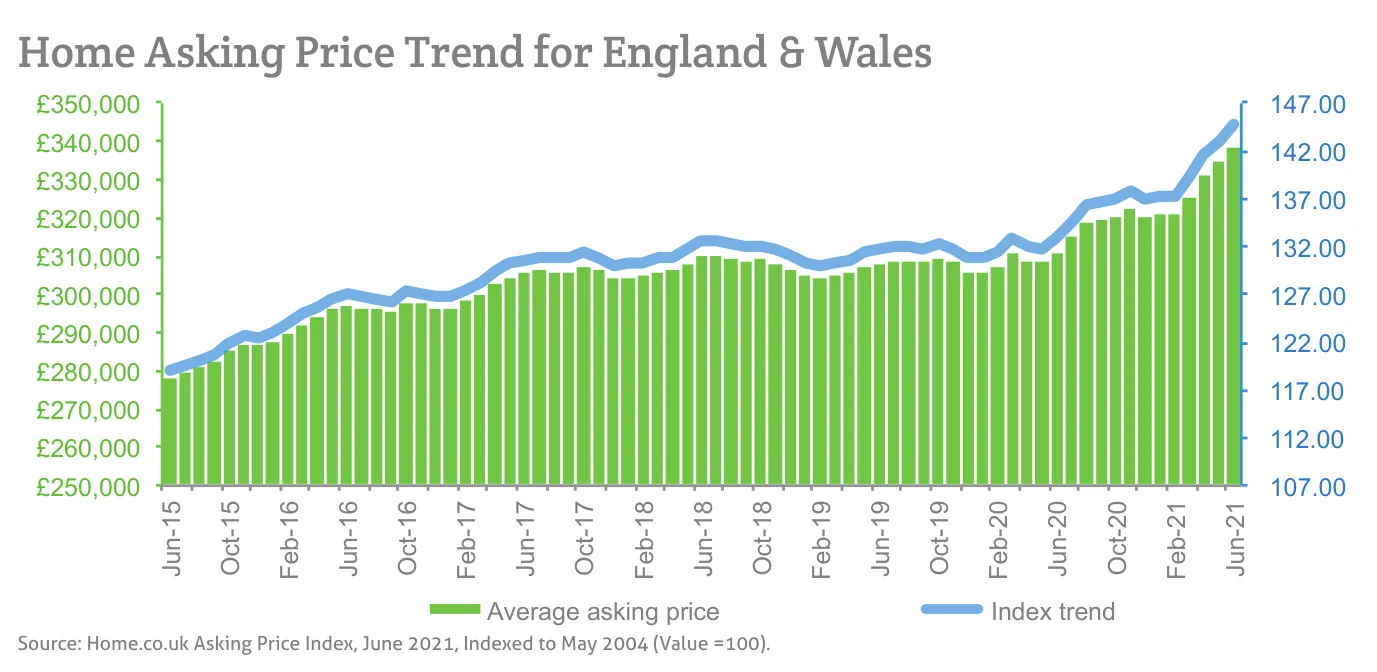
Source: Home.co.uk Asking Price Index, June 2021, Indexed to May 2004 (Value =100).
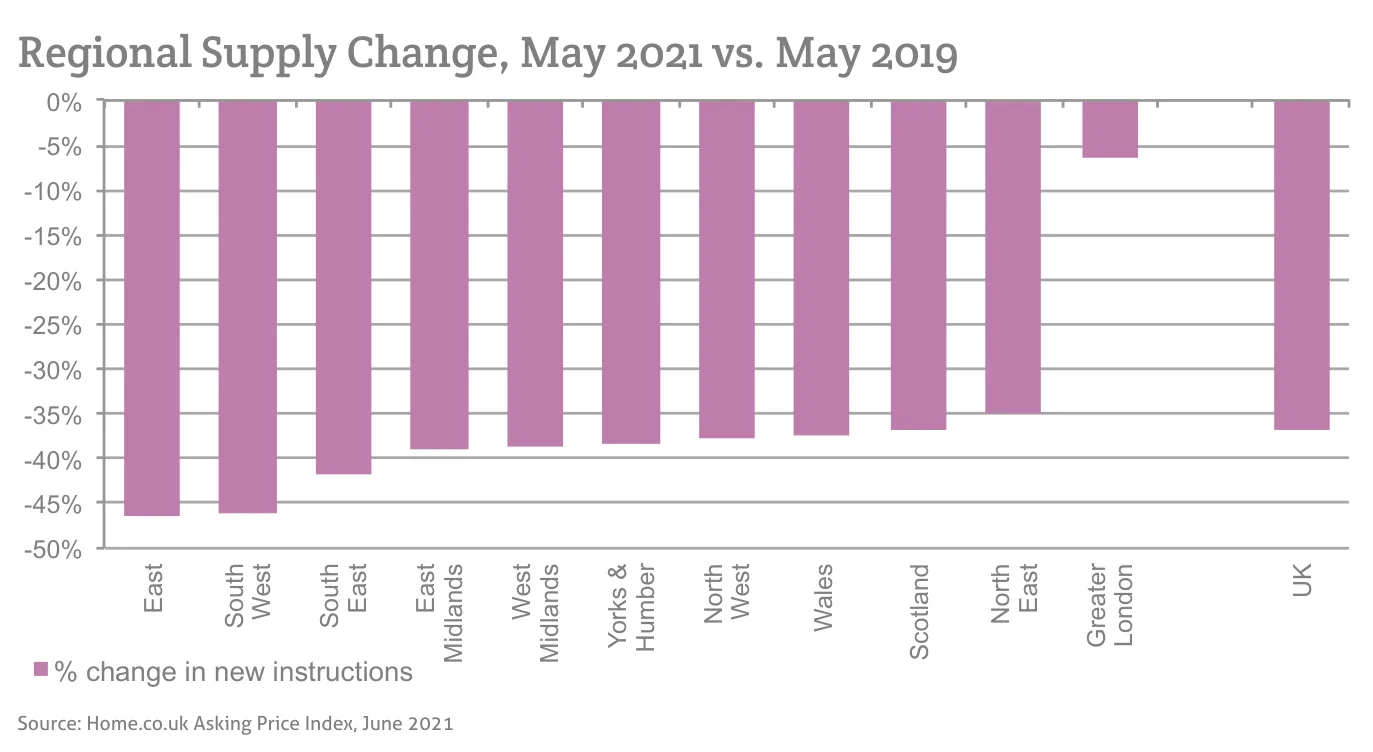
Source: Home.co.uk Asking Price Index, June 2021
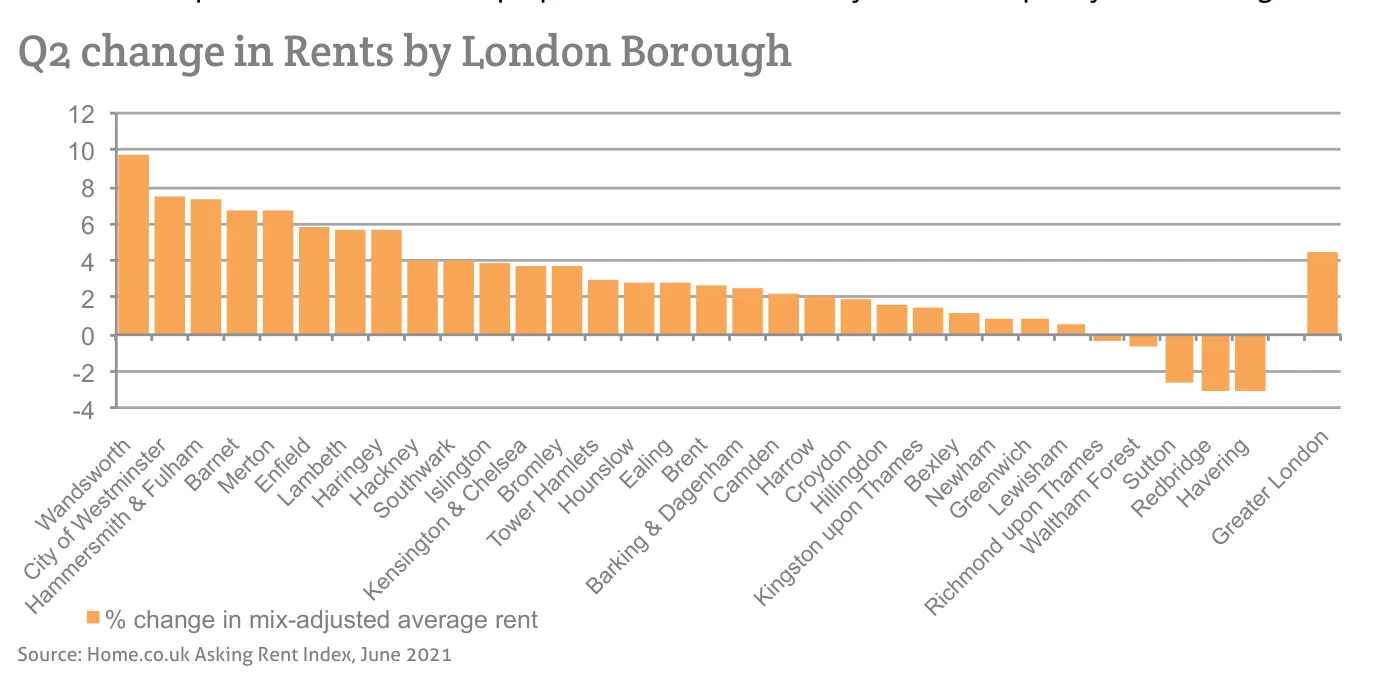
Source: Home.co.uk Asking Rent Index, June 2021
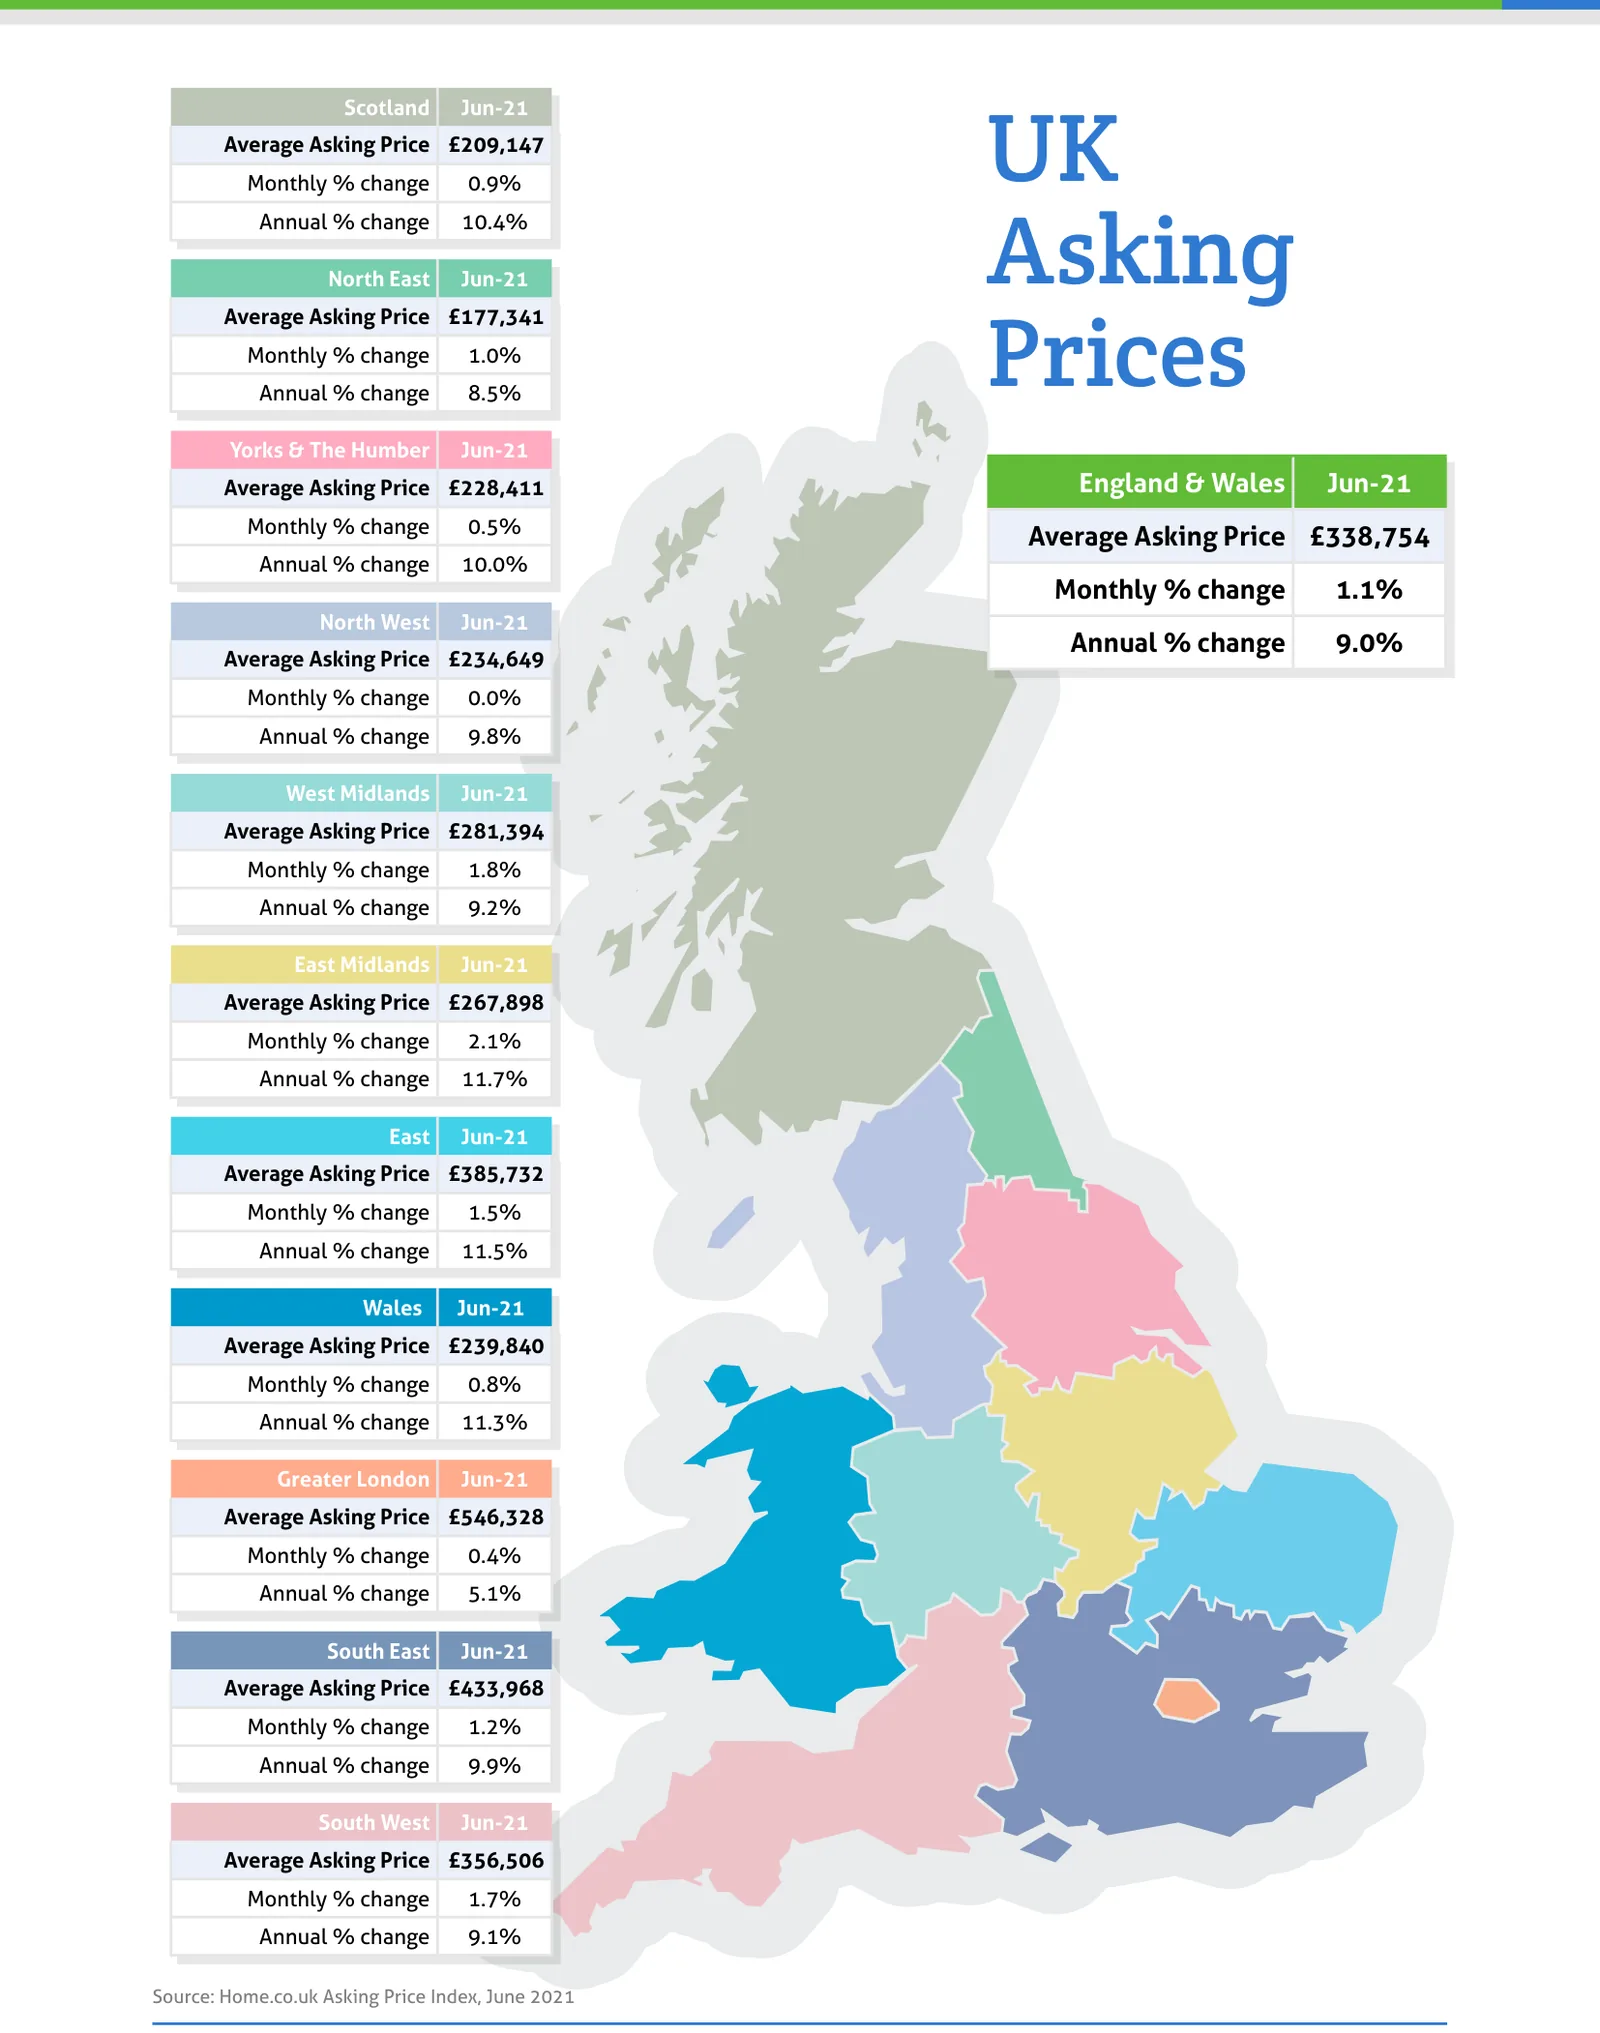
Source: Home.co.uk Asking Price Index, June 2021
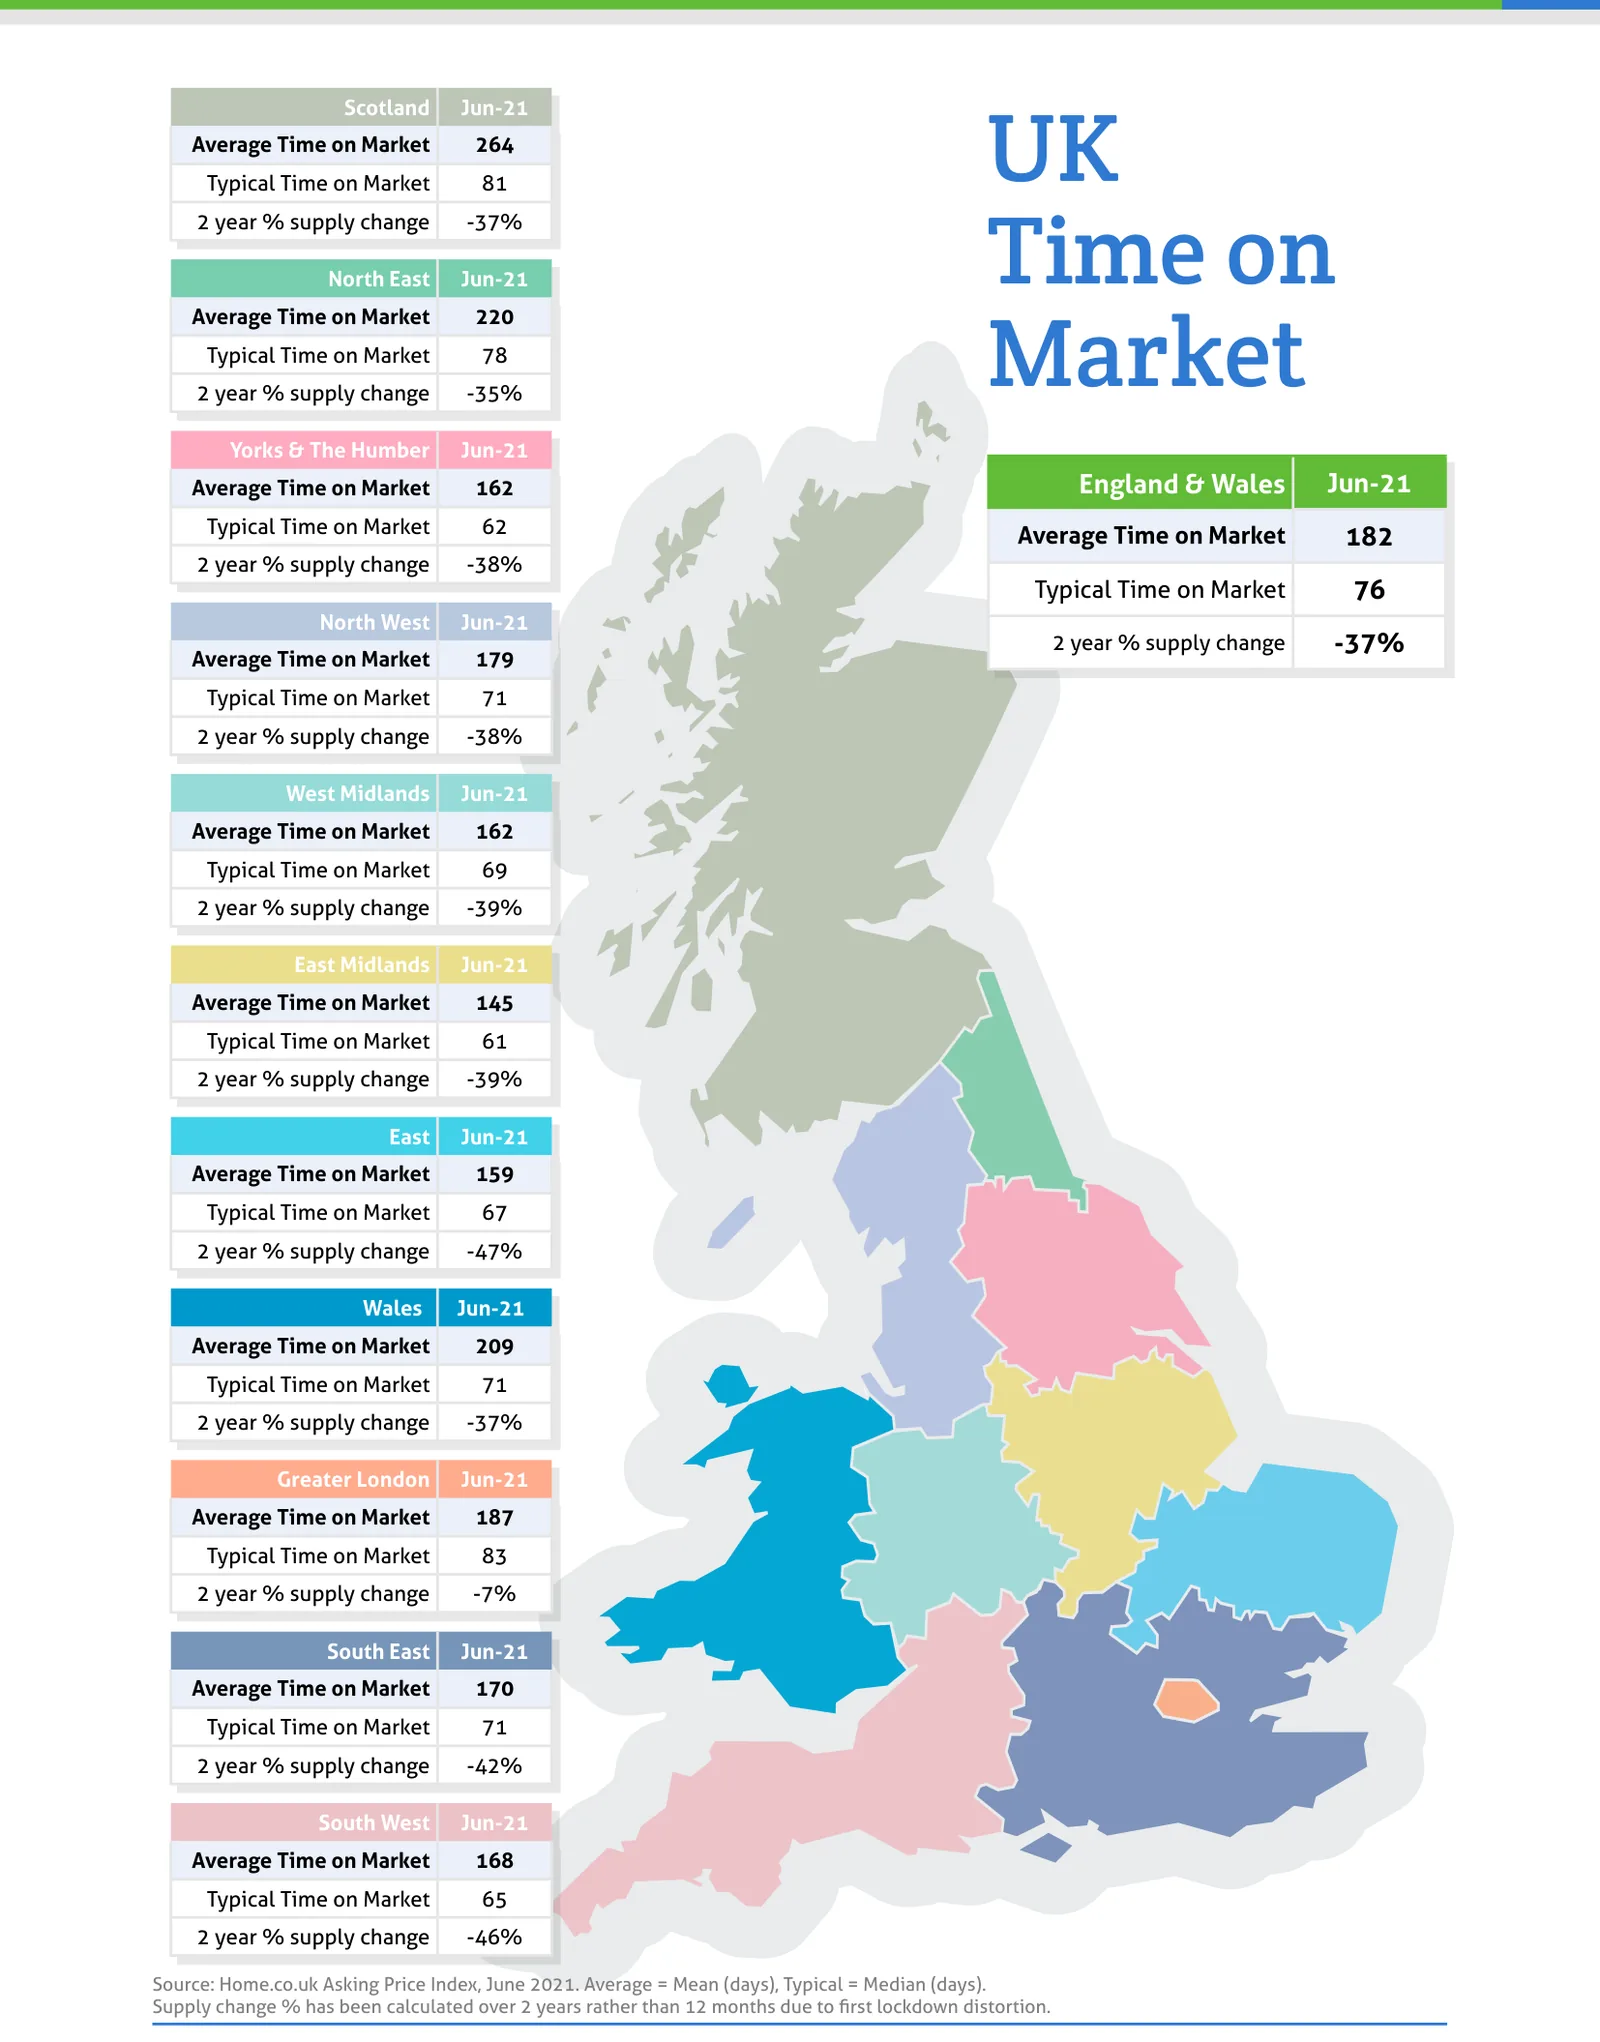
Source: Home.co.uk Asking Price Index, June 2021. Average = Mean (days), Typical = Median (days).
Regional tables
UK Asking Prices, Jun-21
| Region | Average Asking Price | Monthly % change | Annual % change |
|---|---|---|---|
| Scotland | £209,147 | 0.9% | 10.4% |
| North East | £177,341 | 1.0% | 8.5% |
| Yorks & The Humber | £228,411 | 0.5% | 10.0% |
| England & Wales | £338,754 | 1.1% | 9.0% |
| North West | £234,649 | 0.0% | 9.8% |
| West Midlands | £281,394 | 1.8% | 9.2% |
| East Midlands | £267,898 | 2.1% | 11.7% |
| East | £385,732 | 1.5% | 11.5% |
| Wales | £239,840 | 0.8% | 11.3% |
| Greater London | £546,328 | 0.4% | 5.1% |
| South East | £433,968 | 1.2% | 9.9% |
| South West | £356,506 | 1.7% | 9.1% |
UK Time on Market, Jun-21
| Region | Average Time on Market | Typical Time on Market | 2 year % supply change |
|---|---|---|---|
| Scotland | 264 | 81 | -37% |
| North East | 220 | 78 | -35% |
| Yorks & The Humber | 162 | 62 | -38% |
| England & Wales | 182 | 76 | -37% |
| North West | 179 | 71 | -38% |
| West Midlands | 162 | 69 | -39% |
| East Midlands | 145 | 61 | -39% |
| East | 159 | 67 | -47% |
| Wales | 209 | 71 | -37% |
| Greater London | 187 | 83 | -7% |
| South East | 170 | 71 | -42% |
| South West | 168 | 65 | -46% |
From the director's commentary
"The sudden return to growth in London rents portends a wider recovery in the capital's property market. Of course, the sales market will be slower to respond to returning demand but, should this trend continue, the uplift in buyer interest and prices is inevitable."
Doug Shephard, Director at Home.co.uk
Read the full June 2021 edition (PDF, 7 pages)
About the Home Asking Price Index
The Home Asking Price Index measures the change in the prices sellers ask for residential property across England, Wales and Scotland. Today it is computed every month from around half a million advertised homes and is mix-adjusted, so a change in what happens to be on the market does not move the figure; earlier editions state the sample they were built from. Because an asking price is set months before a sale completes, the index runs around five months ahead of completed-sale measures such as the UK House Price Index.
Every edition in the archive, back to October 2006, is listed on the index page. How we measure the UK property market explains the listing data behind it, and today's figures by area are on house prices and rental prices.
Text and figures above are quoted from the June 2021 edition as published, with punctuation normalised for the web, and are not revised. Later editions may restate them.
More in What is happening to house prices: the Home guide
Thinking about your next move?
See what your home's worth in seconds, with the UK's longest-running property data behind it.
Get an instant valuation