

























Home Asking Price Index, June 2018: oversupply and overpricing threaten to stall market
Asking prices in England and Wales rose 0.7% this month but annual growth slowed to just 1.4%, while total stock rose 8.5% year-on-year.

This is the June 2018 edition of the Home Asking Price Index, released on 12 June 2018, under the headline:
Oversupply and Overpricing Threaten to Stall Market
The headlines and summary below are the report's own words, with the key figures as it published them, followed by the report's charts and regional tables as printed.
Headlines
- The largest monthly price increases were detected in Scotland (1.4%) and the West Midlands (1.3%).
- Typical Time on Market continues to rise in London (+14%), the South East (+15%) and East (+17%) year-on-year.
- The North West joins markets in the East Midlands and the South West at the start of the cooling cycle, as Typical Time on Market figures increase year-on-year.
- Prices have risen in all English regions, Scotland and Wales since last month, with the exception of London where there was no change.
- Typical Time on Market for England and Wales is now 81 days, three days more than in June 2017.
- Supply changes show a clear market shift compared to a year ago: up by 11% across the UK, with the biggest increases found in the East of England (+20%) and the South West (+21%) year-on-year (YoY).
- Home prices notched up another 0.7% this month, buoyed by a flood of overpriced properties.
- The total stock of properties on the market in England and Wales continues to rise (8.5% YoY) and is now at its highest level since July 2015.
- In a counter trend, the number of rental properties entering the market is down 12% compared to a year ago.
- The mix-adjusted average growth for England and Wales is only 1.4% year-on-year: well below the rate of inflation.
Summary
Analysis of the UK property market at the regional level provides the observer with a much more refined picture of the current market dynamic. Currently, the diversity of fortune is extraordinary. On the one hand, Wales is enjoying the most market momentum for ten years as well as the greatest rate of price growth across the UK. On the other hand, London is suffering both sliding prices and rising supply (which usually means the worst is yet to come).
The property drought that helped drive prices to notable highs over the last five years has come to an end. Supply is up considerably on last year, especially in post-boom regions, and properties are spending longer on the market overall. Price cutting has also surged; the number of on-market reductions in May reached a level last seen in Oct 2012. These metrics clearly show that now, overall, the market is entering a slowdown phase in the property cycle. In short, the downturn that started when the London bubble began to deflate has now spread across sufficient regions that the national figures reflect the same. However, this message has not yet reached many of the vendors that placed their properties on the market last month with optimistically high prices.
Key figures
| Measure | Figure |
|---|---|
| Typical Time on Market (England and Wales) | 81 days |
| Monthly price change | +0.7% |
| Mix-adjusted annual growth (England and Wales) | 1.4% |
| Total stock change (England and Wales, YoY) | +8.5% |
| Supply change (UK, YoY) | +11% |
| Rental properties on market (UK, YoY) | -12% |
Figures are for England and Wales unless the report states otherwise, as published in the edition.
Charts from the report
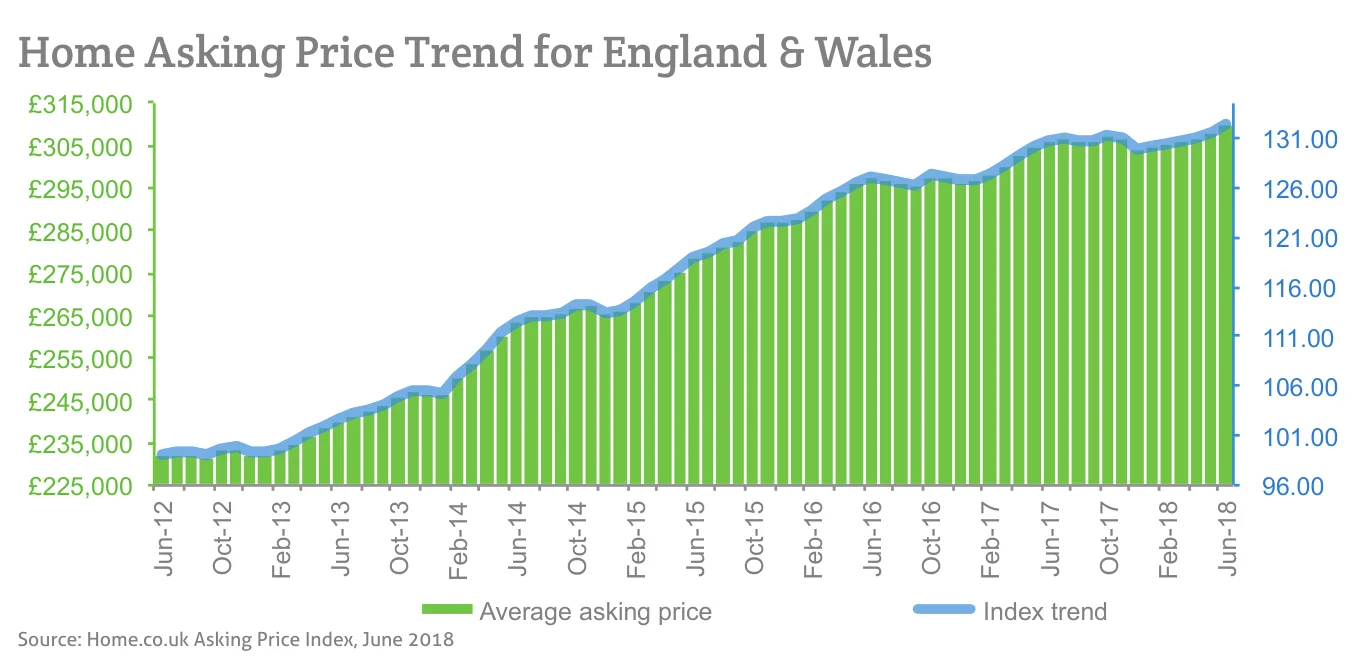
Source: Home.co.uk Asking Price Index, June 2018
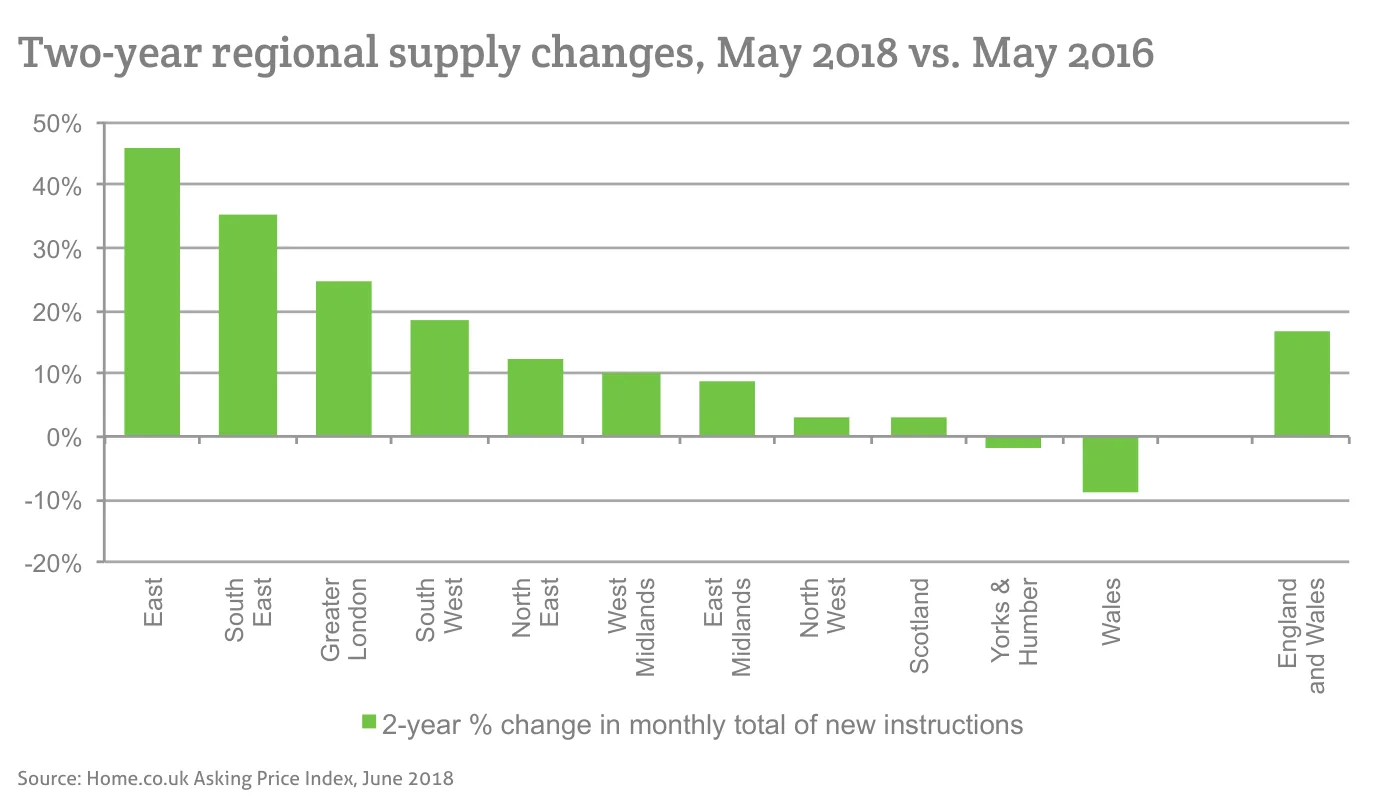
Source: Home.co.uk Asking Price Index, June 2018
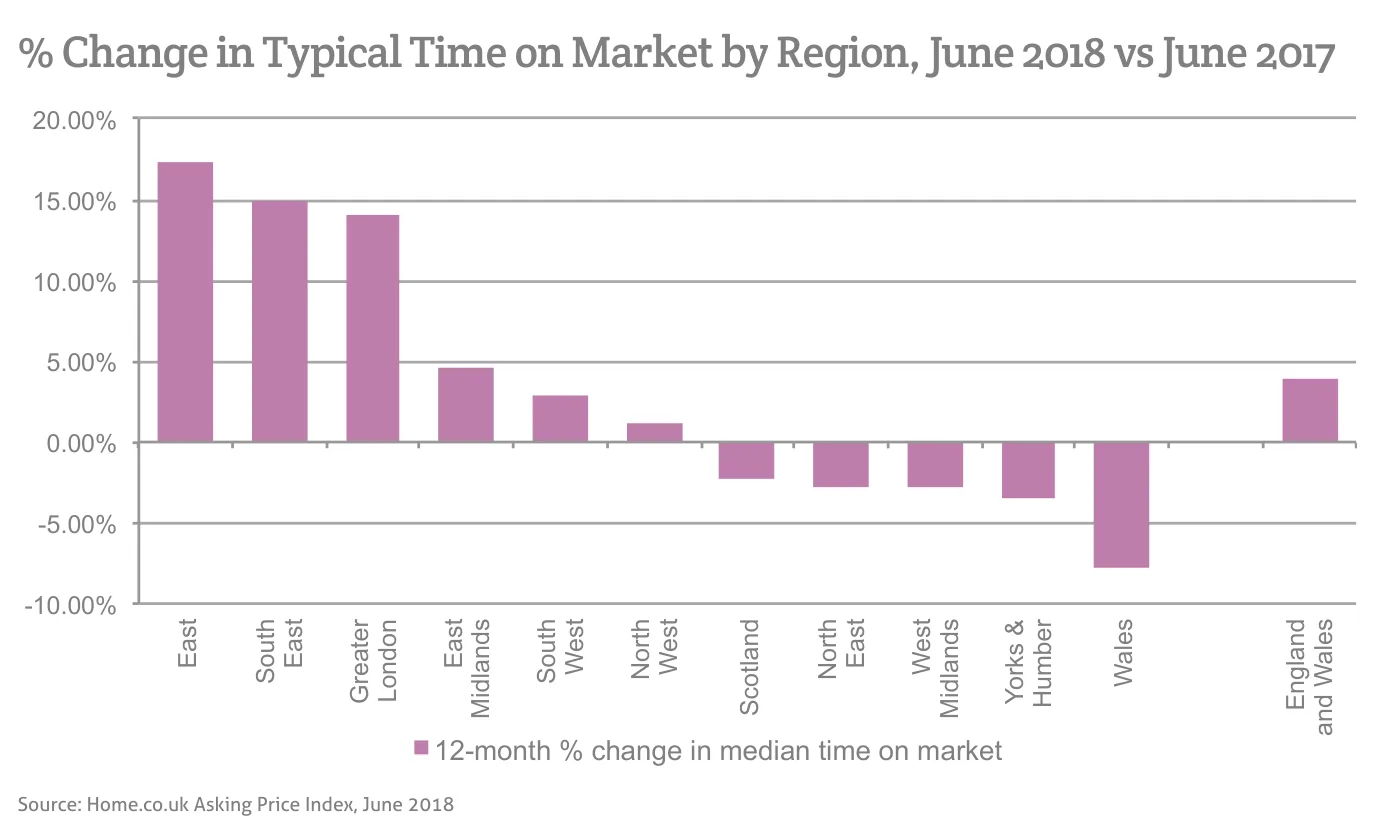
Source: Home.co.uk Asking Price Index, June 2018
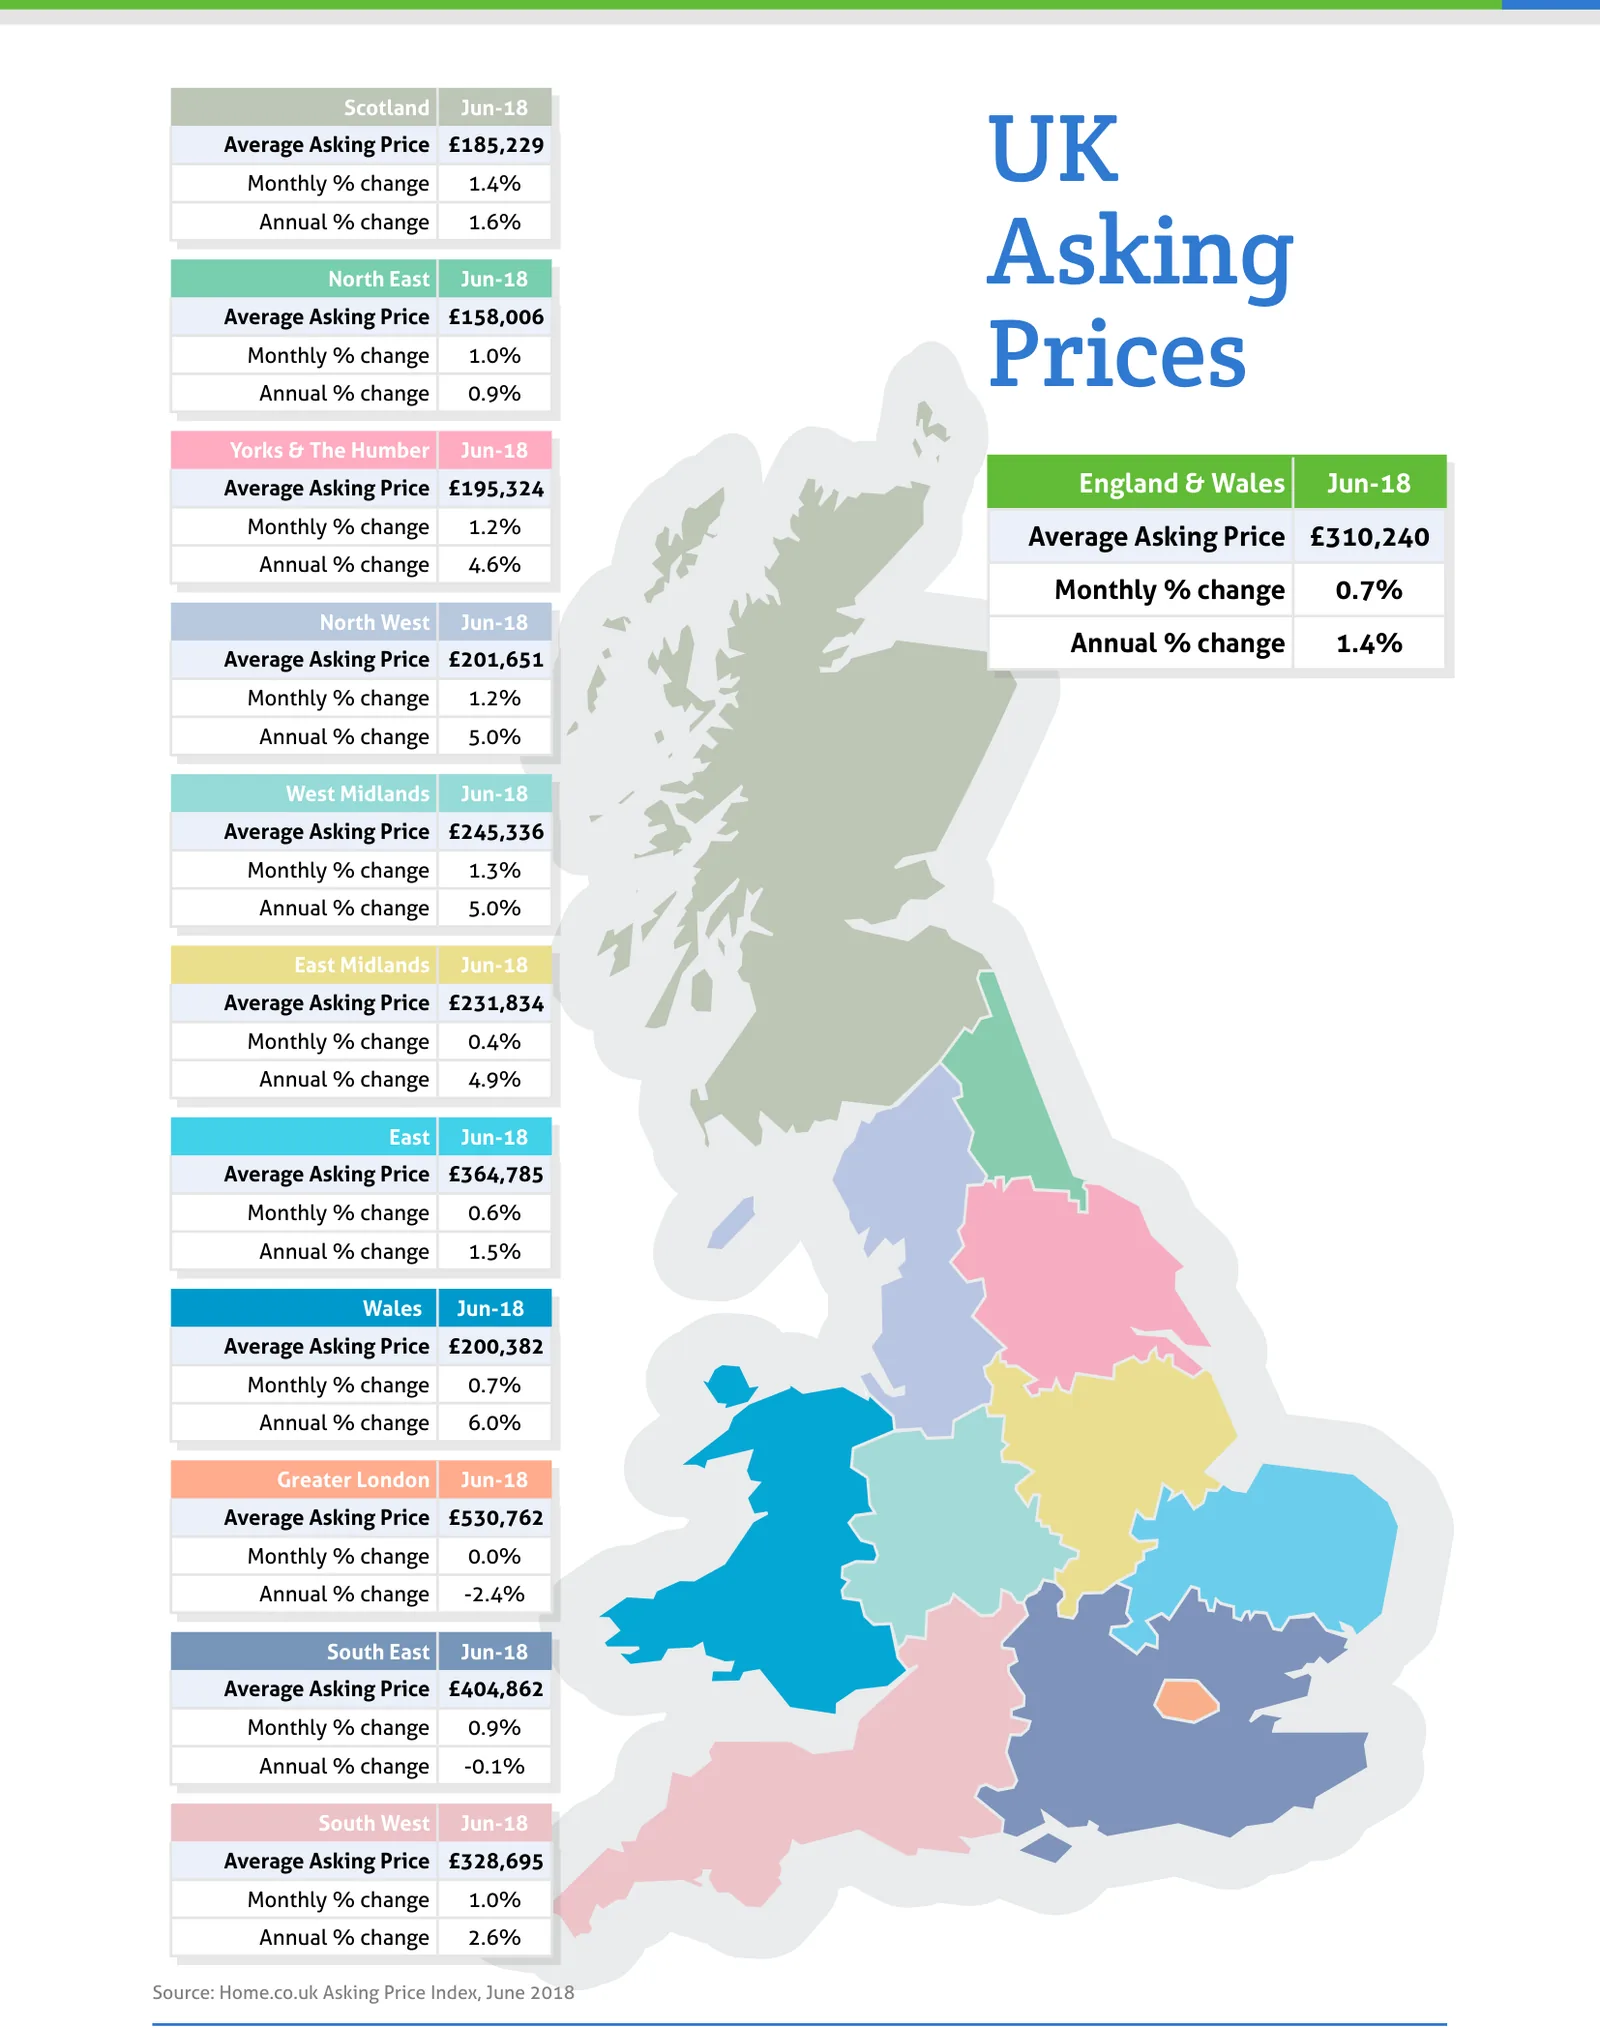
Source: Home.co.uk Asking Price Index, June 2018
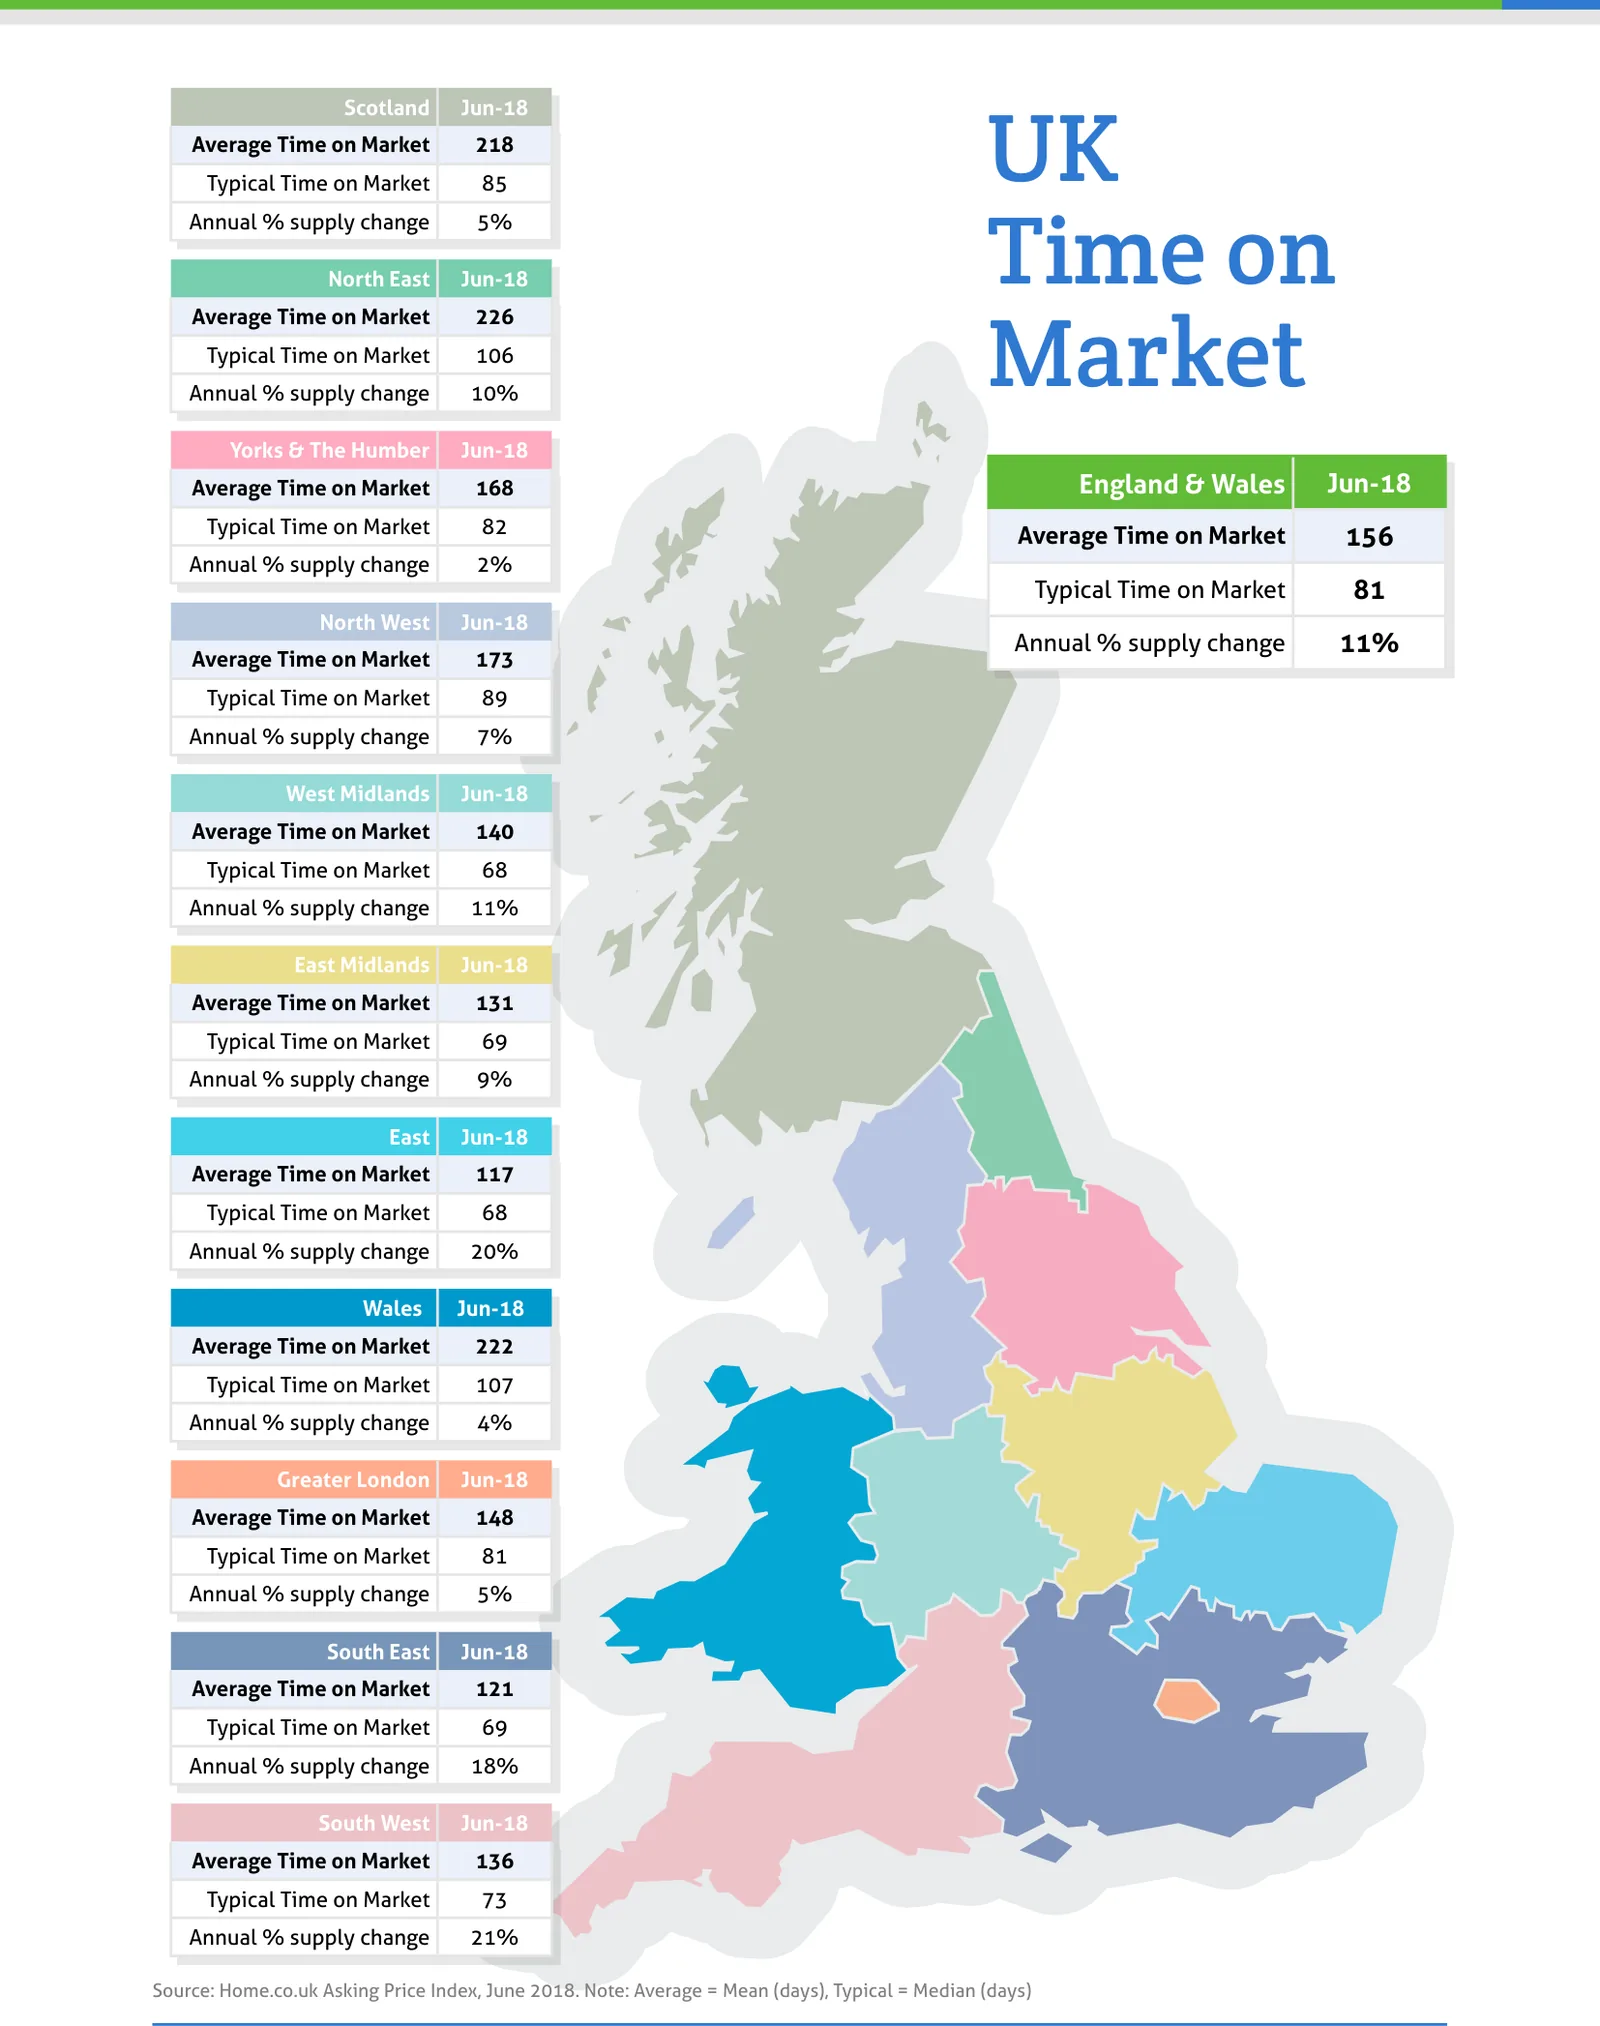
Source: Home.co.uk Asking Price Index, June 2018. Note: Average = Mean (days), Typical = Median (days)
Regional tables
UK Asking Prices, Jun-18
| Region | Average Asking Price | Monthly % change | Annual % change |
|---|---|---|---|
| Scotland | £185,229 | 1.4% | 1.6% |
| North East | £158,006 | 1.0% | 0.9% |
| Yorks & The Humber | £195,324 | 1.2% | 4.6% |
| England & Wales | £310,240 | 0.7% | 1.4% |
| North West | £201,651 | 1.2% | 5.0% |
| West Midlands | £245,336 | 1.3% | 5.0% |
| East Midlands | £231,834 | 0.4% | 4.9% |
| East | £364,785 | 0.6% | 1.5% |
| Wales | £200,382 | 0.7% | 6.0% |
| Greater London | £530,762 | 0.0% | -2.4% |
| South East | £404,862 | 0.9% | -0.1% |
| South West | £328,695 | 1.0% | 2.6% |
UK Time on Market, Jun-18
| Region | Average Time on Market | Typical Time on Market | Annual % supply change |
|---|---|---|---|
| Scotland | 218 | 85 | 5% |
| North East | 226 | 106 | 10% |
| Yorks & The Humber | 168 | 82 | 2% |
| England & Wales | 156 | 81 | 11% |
| North West | 173 | 89 | 7% |
| West Midlands | 140 | 68 | 11% |
| East Midlands | 131 | 69 | 9% |
| East | 117 | 68 | 20% |
| Wales | 222 | 107 | 4% |
| Greater London | 148 | 81 | 5% |
| South East | 121 | 69 | 18% |
| South West | 136 | 73 | 21% |
From the director's commentary
"So, despite record-low interest rates and no hikes envisaged in the near term, government intervention in the market is triggering forced sales. These vendor landlords have done their maths and they know that if they continue to let the property, even with a rent hike, they will be losing money overall."
Doug Shephard, Director at Home.co.uk
Read the full June 2018 edition (PDF, 7 pages)
About the Home Asking Price Index
The Home Asking Price Index measures the change in the prices sellers ask for residential property across England, Wales and Scotland. Today it is computed every month from around half a million advertised homes and is mix-adjusted, so a change in what happens to be on the market does not move the figure; earlier editions state the sample they were built from. Because an asking price is set months before a sale completes, the index runs around five months ahead of completed-sale measures such as the UK House Price Index.
Every edition in the archive, back to October 2006, is listed on the index page. How we measure the UK property market explains the listing data behind it, and today's figures by area are on house prices and rental prices.
Text and figures above are quoted from the June 2018 edition as published, with punctuation normalised for the web, and are not revised. Later editions may restate them.
More in What is happening to house prices: the Home guide
Thinking about your next move?
See what your home's worth in seconds, with the UK's longest-running property data behind it.
Get an instant valuation