

























Home Asking Price Index, June 2011: prices stall as buyers harder to find
Average asking prices in England and Wales stayed flat in June, with time on market rising and price reductions up 34% year on year.

This is the June 2011 edition of the Home Asking Price Index, released on 13 June 2011, under the headline:
Prices Stall as Buyers Harder to Find
The headlines and summary below are the report's own words, with the key figures as it published them, followed by the report's charts and regional tables as printed.
Headlines
- The mix-adjusted average Asking Price for homes on the market in England and Wales remains unchanged since May.
- Home prices fell 0.2% in Greater London over the second quarter.
- The number of properties reduced in price last month surged to 88,815, 34% more than in May 2010.
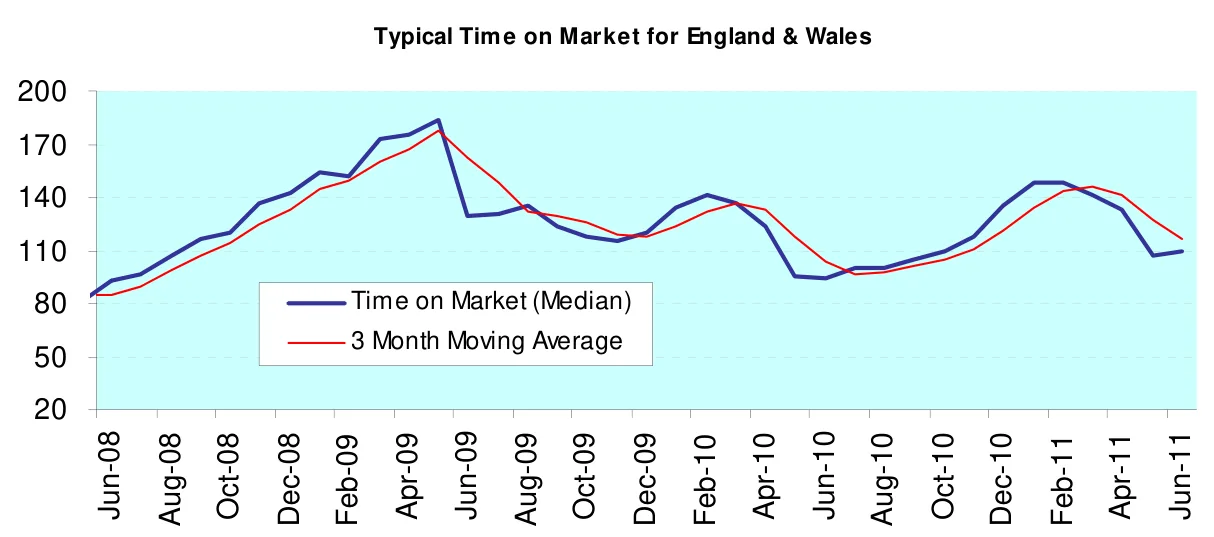
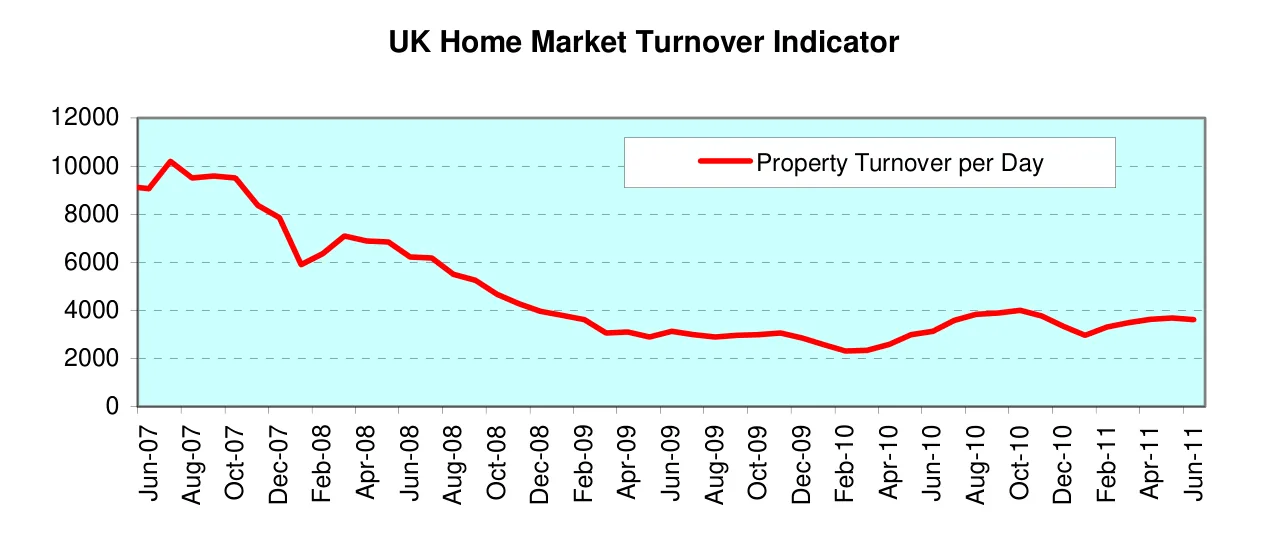
- Typical time on market has increased 2 days to 109 days (median) since May and is now 16% longer than in June 2010.
- Supply of new properties to market fell back ca. 5,000 to 129,726 in June, 2% less than in June 2010.
- Annual change in asking prices: -0.8%
- 6-month change in asking prices: 0.4%
Summary
The strong, seasonal recovery in home prices following the low in February has faltered. Rising time on market and stalled prices suggest strongly that this summer's price maximum is probably already achieved and, hence, will be somewhat below last year's high, perpetuating the slow slide in house prices year on year. Increasing price-cutting activity adds to the gloomy picture for UK house prices: 34% more properties were reduced in price in May 2011 than May 2010. Confidence among sellers is waning with properties beginning to spend longer on the market and buyers are harder to find. The number of properties discounted whilst on the market increased last month to around 12% of the total sales market. Supply of properties has weakened, however: 2% fewer properties appeared on the market in May 2011 than May 2010.
Homebuyers with cash or sizeable deposits appear to be increasingly limited in number, although reportedly this trend has been countered somewhat by larger numbers of first-time buyers and buy-to-let investors. Mortgage lenders are beginning to improve the deals on offer in particular the Northern Rock is offering 90% mortgages once again. Overall, demand remains subdued compared with pre-crisis levels due to economic pressures.
Key figures
| Measure | Figure |
|---|---|
| Average asking price (England & Wales) | £229,155 |
| Annual change in asking prices | -0.8% |
| 6-month change in asking prices | 0.4% |
| Typical time on market (median) | 109 days |
| Properties reduced in price | 88,815 |
| Supply of new properties to market | 129,726 |
Figures are for England and Wales unless the report states otherwise, as published in the edition.
Charts from the report
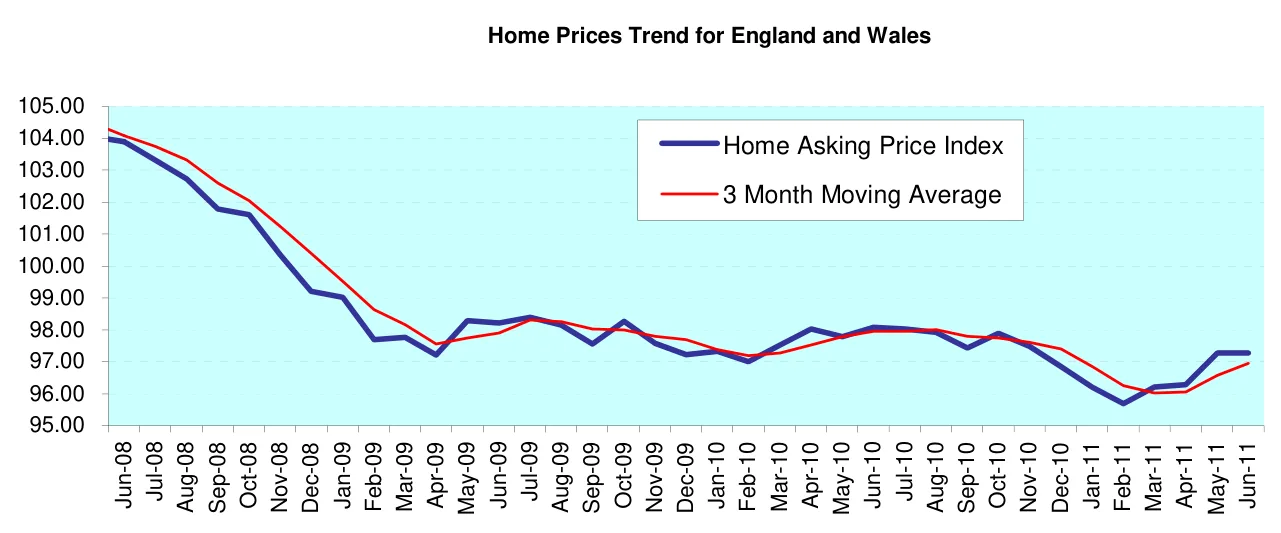
Laspeyres Index based on Weighted Arithmetic Mean of Weighted Arithmetic Mean of Regional House Prices. [May04 = 100]
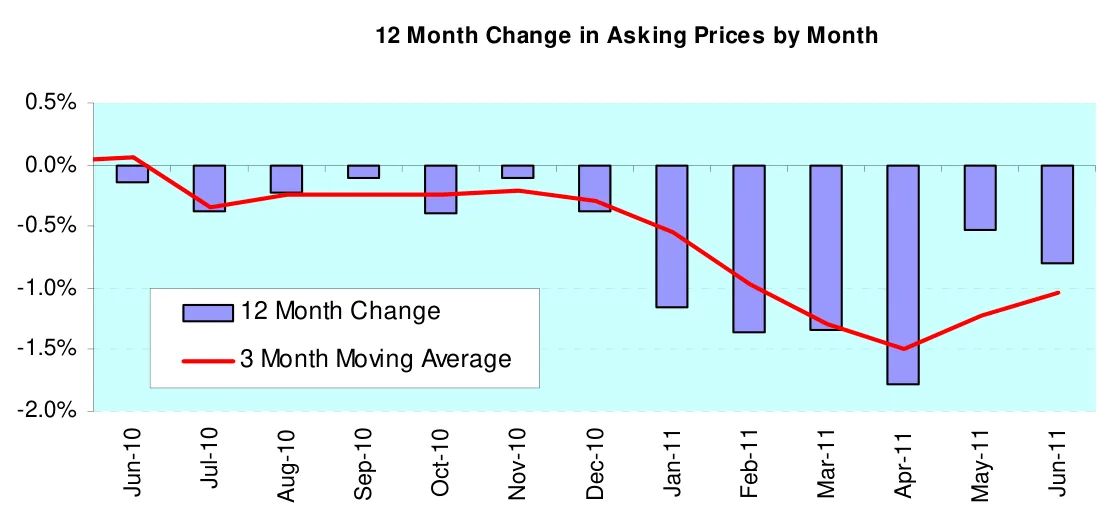
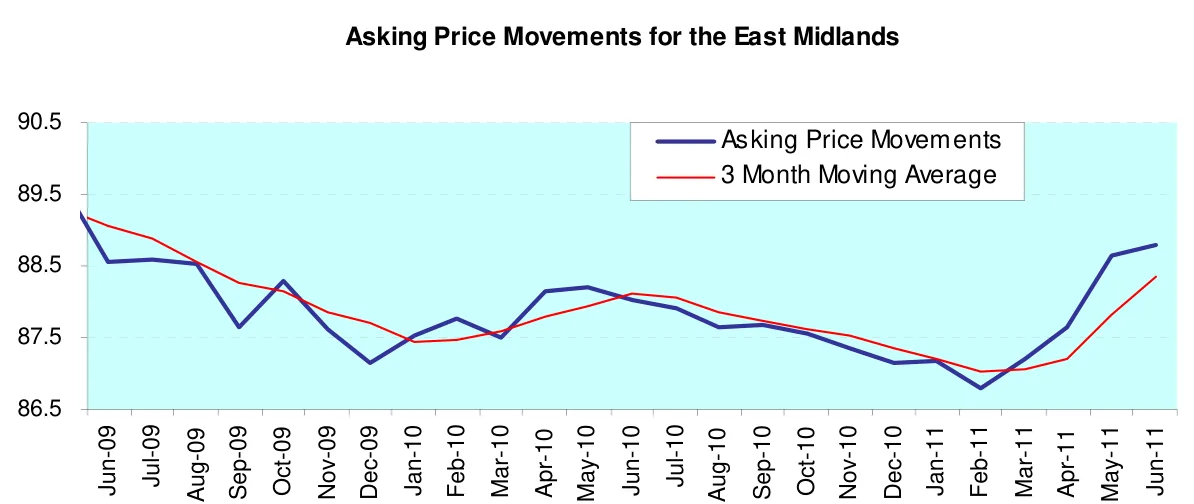
Laspeyres Indices based on Weighted Arithmetic Mean of Regional House Prices [May04 = 100]
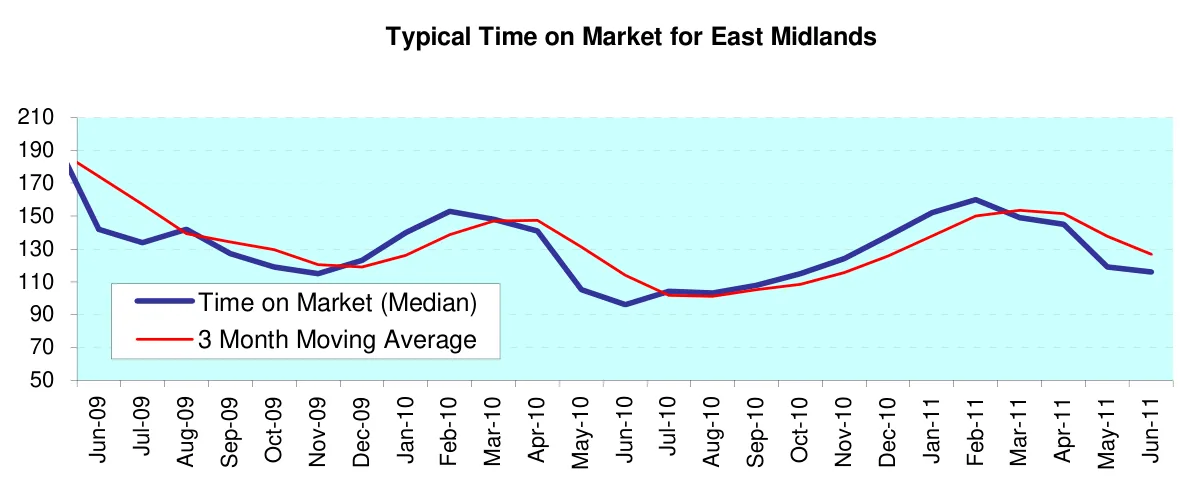
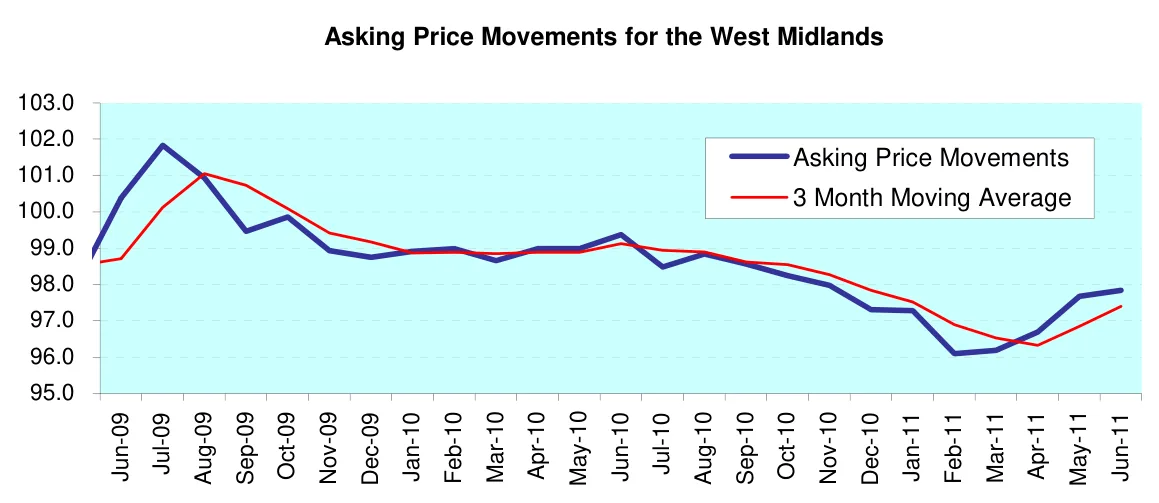
Laspeyres Index based on Weighted Arithmetic Mean of Regional House Prices [May04 = 100]
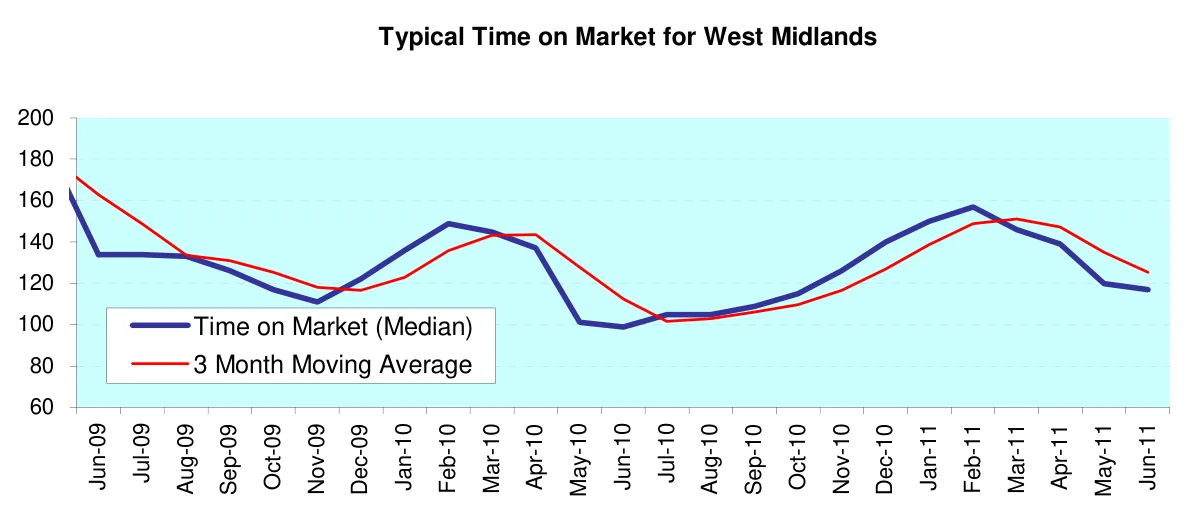
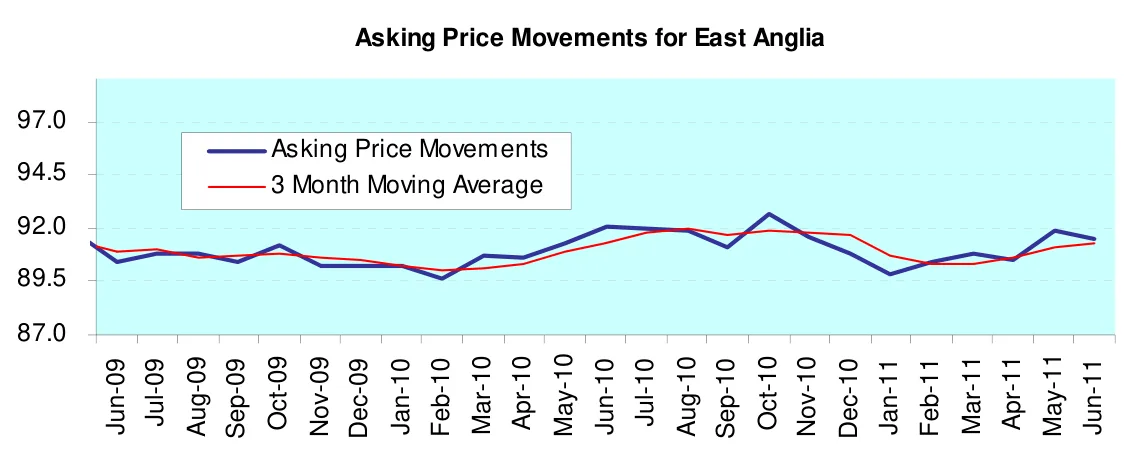
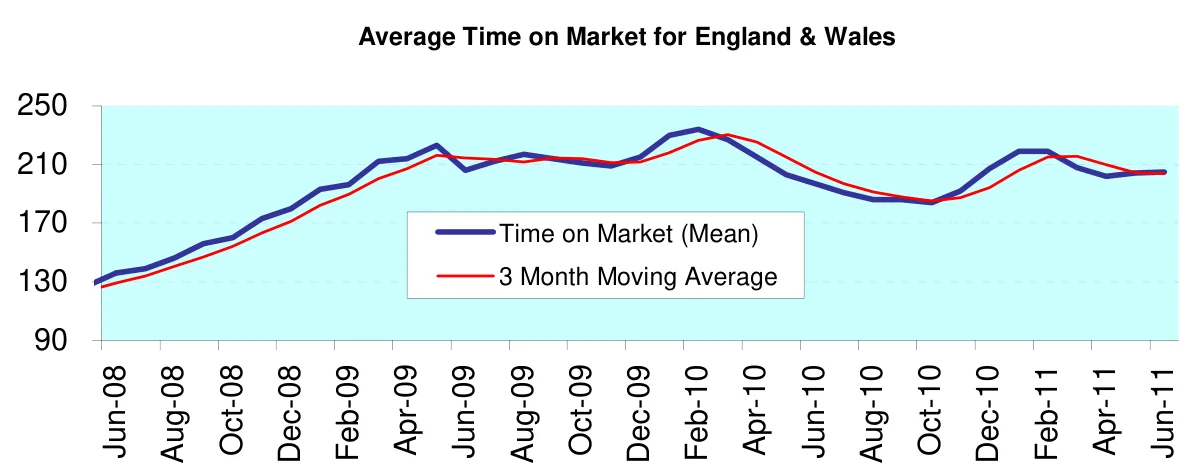
Laspeyres Index based on Weighted Arithmetic Mean of Regional House Prices [May04 = 100]
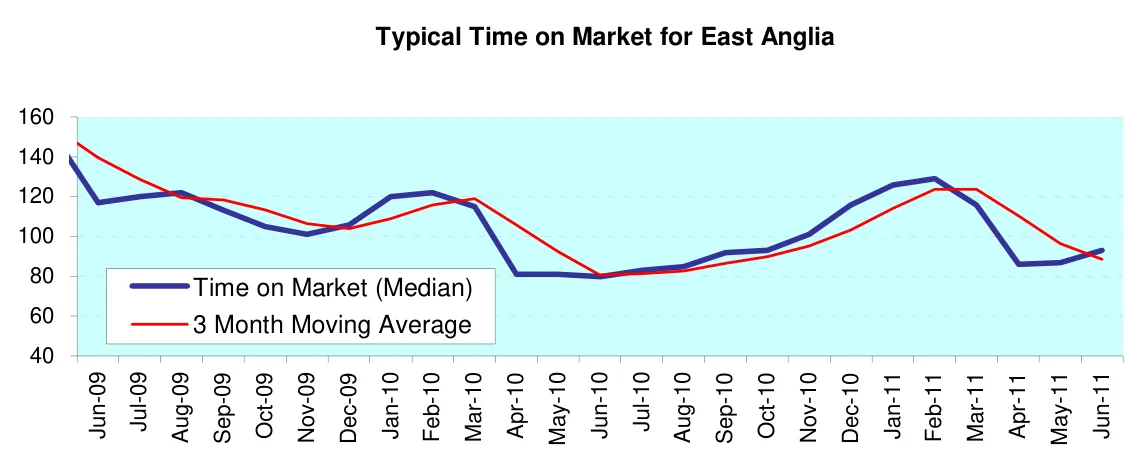
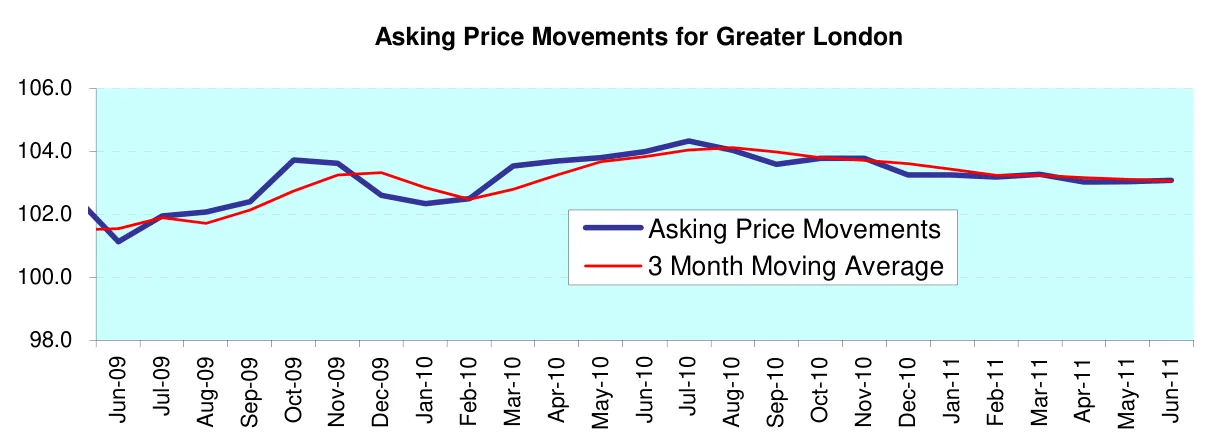
Laspeyres Index based on Weighted Arithmetic Mean of Regional House Prices [May04 = 100]
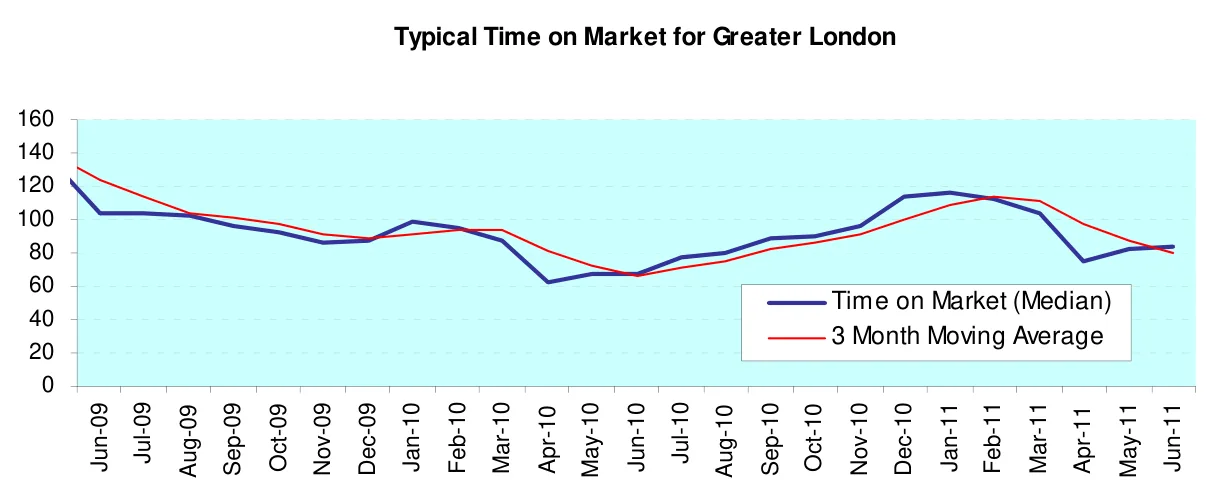
Source: HM Land Registry
Regional tables
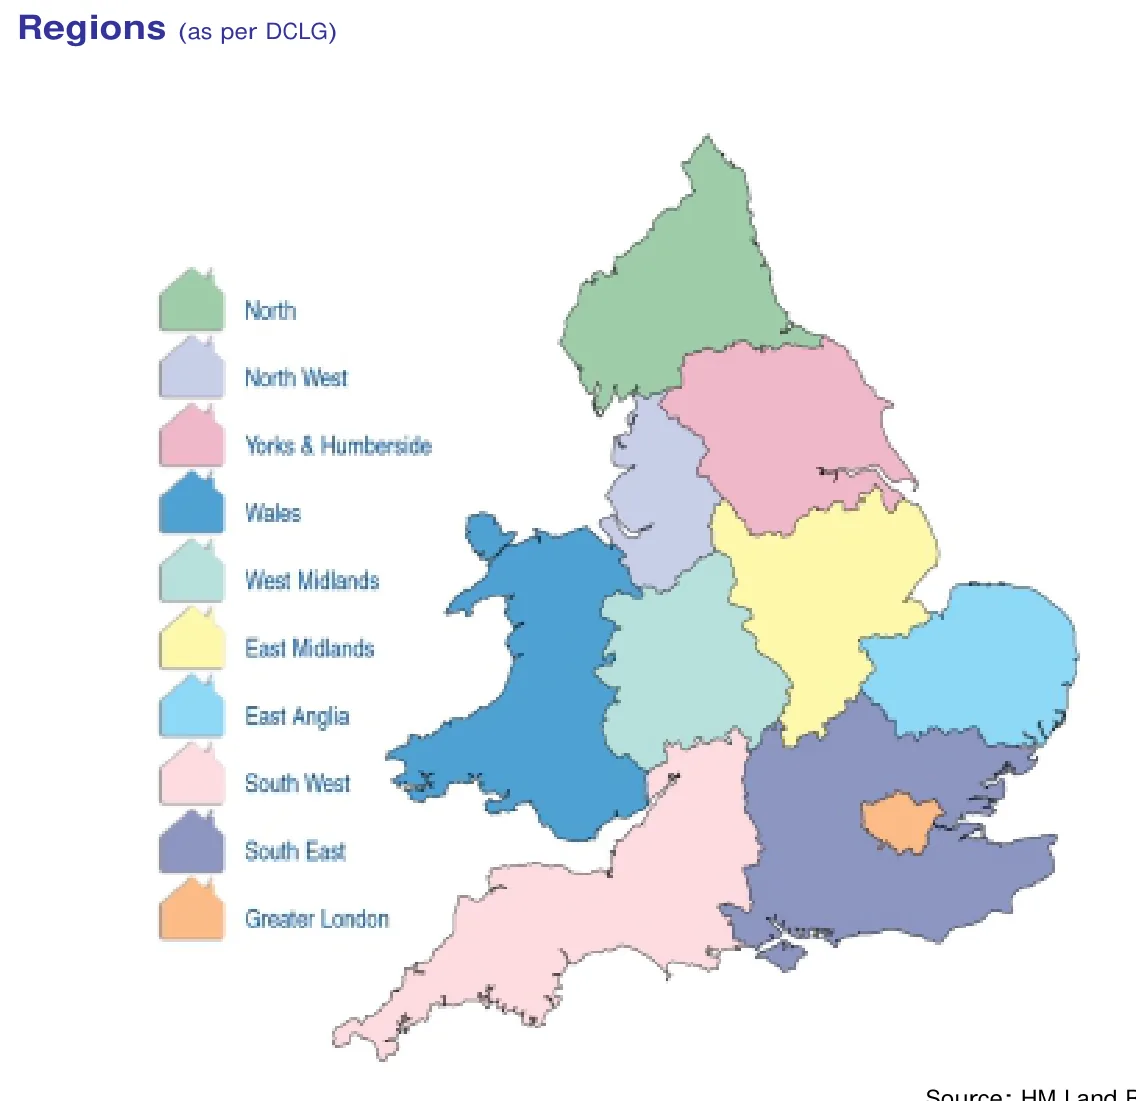
Regional Asking Prices for June 2011, showing gains and losses since March 2011 and current typical time
| Current average price | 3-month change | ToM (days) | |
|---|---|---|---|
| Scotland | £164,193 | +3.0% | 120 |
| South East | £285,192 | +2.2% | 81 |
| East Midlands | £173,439 | +1.8% | 116 |
| West Midlands | £188,196 | +1.7% | 117 |
| South West | £250,888 | +1.5% | 94 |
| North West | £173,901 | +1.3% | 138 |
| Yorkshire and Humber | £168,770 | +0.9% | 147 |
| North East | £152,582 | +0.9% | 200 |
| East Anglia | £241,156 | +0.8% | 93 |
| Wales | £175,255 | +0.8% | 150 |
| Greater London | £341,018 | -0.2% | 84 |
| England & Wales | £229,155 | +1.1% | 109 |
on market.
Read the full June 2011 edition (PDF, 12 pages)
About the Home Asking Price Index
The Home Asking Price Index measures the change in the prices sellers ask for residential property across England, Wales and Scotland. Today it is computed every month from around half a million advertised homes and is mix-adjusted, so a change in what happens to be on the market does not move the figure; earlier editions state the sample they were built from. Because an asking price is set months before a sale completes, the index runs around five months ahead of completed-sale measures such as the UK House Price Index.
Every edition in the archive, back to October 2006, is listed on the index page. How we measure the UK property market explains the listing data behind it, and today's figures by area are on house prices and rental prices.
Text and figures above are quoted from the June 2011 edition as published, with punctuation normalised for the web, and are not revised. Later editions may restate them.
More in What is happening to house prices: the Home guide
Thinking about your next move?
See what your home's worth in seconds, with the UK's longest-running property data behind it.
Get an instant valuation