

























Home Asking Price Index, July 2023: prices flatline as stock levels surge
Asking prices across England and Wales stayed flat in June while unsold stock rose to 425,624, its highest level in thirty months.

This is the July 2023 edition of the Home Asking Price Index, released on 12 July 2023, under the headline:
Prices Flatline as Stock Levels Surge
The headlines and summary below are the report's own words, with the key figures as it published them, followed by the report's charts and regional tables as printed.
Headlines
- Asking prices across England and Wales remain unchanged since last month, as is to be expected on the basis of seasonality, but mortgage woes will also have contributed to more conservative pricing. Meanwhile, year-on-year growth slid further into the negative (-1.5%).
- The Typical Time on Market for unsold property in England and Wales decreased by one day during June to make the current median a relatively healthy 78 days, although this will be partly driven by an increased influx of new instructions.
- The total sales stock count for England and Wales surged above the 10-year average during June, adding around 16,000 properties to make the current total 425,624. This signals that the era of scarcity-driven growth is drawing to a close.
- Asking prices continued to rise during June in the South West, North West, Wales and Yorkshire. However, prices in all other English regions and Scotland either fell or remained unchanged. The sharpest drop, surprisingly, was in Scotland (-0.6%).
- The supply rate of new instructions entering the market has improved: up 11% vs. June 2022 but down 8% vs. June 2018. The largest year-on-year rise is in the South West (+18%).
- Typical Time on Market during June rose in all English regions with the exception of the North East, which was down one day, as was Scotland.
- The Scottish property market continues to be the leader in terms of annualised regional price growth (3.7%), while growth in London remains the most negative at -3.5%.
- Rents across the UK continue to rise overall (11.8% annualised) and are now led by the West Midlands (up 18.1%) where supply of available properties to let has fallen year-on-year.
- The current rent growth leaders in London asking rents are the boroughs of Bexley, Kensington and Hillingdon (+40%, +39% and +34% annualised respectively).
Summary
Home price growth has stalled and the stock of unsold property has surpassed the 10-year average to reach a new 30-month high. However, it should be noted that both prices and stock levels typically peak during the summer. It is, therefore, not yet clear whether or not the UK housing market has become collateral damage in the Bank of England's belated efforts in the war on inflation, as was the case in 2008.
Rapidly rising stock levels are always a cause for concern. Pricing had, until now, been benefitting from low stock levels, but last month's surge over the 10-year average gives cause for anxiety. However, stock levels were recovering from rock bottom after the COVID boom depleted agents' portfolios to unprecedentedly low levels. Also, it should be noted that supply of new instructions remains subdued compared to pre-COVID years and is currently 8% less than in June 2018.
Last month's rash decision by the Bank of England to hike the base rate by a further 0.5% to 5.0% has certainly rattled some nerves. The UK property market was steadily regaining confidence in the wake of the rapid price correction at the end of last year with a return to slow growth, but now many fear that increased borrowing costs, along with negative sentiment in the media, may tip the market into a downward spiral.
Key figures
| Measure | Figure |
|---|---|
| Annual price change (England & Wales) | -1.5% |
| Typical Time on Market | 78 days |
| New stock added in June | around 16,000 properties |
| New instructions vs June 2022 | +11% |
| New instructions vs June 2018 | -8% |
| UK average asking rent annual change | 11.8% |
Figures are for England and Wales unless the report states otherwise, as published in the edition.
Charts from the report
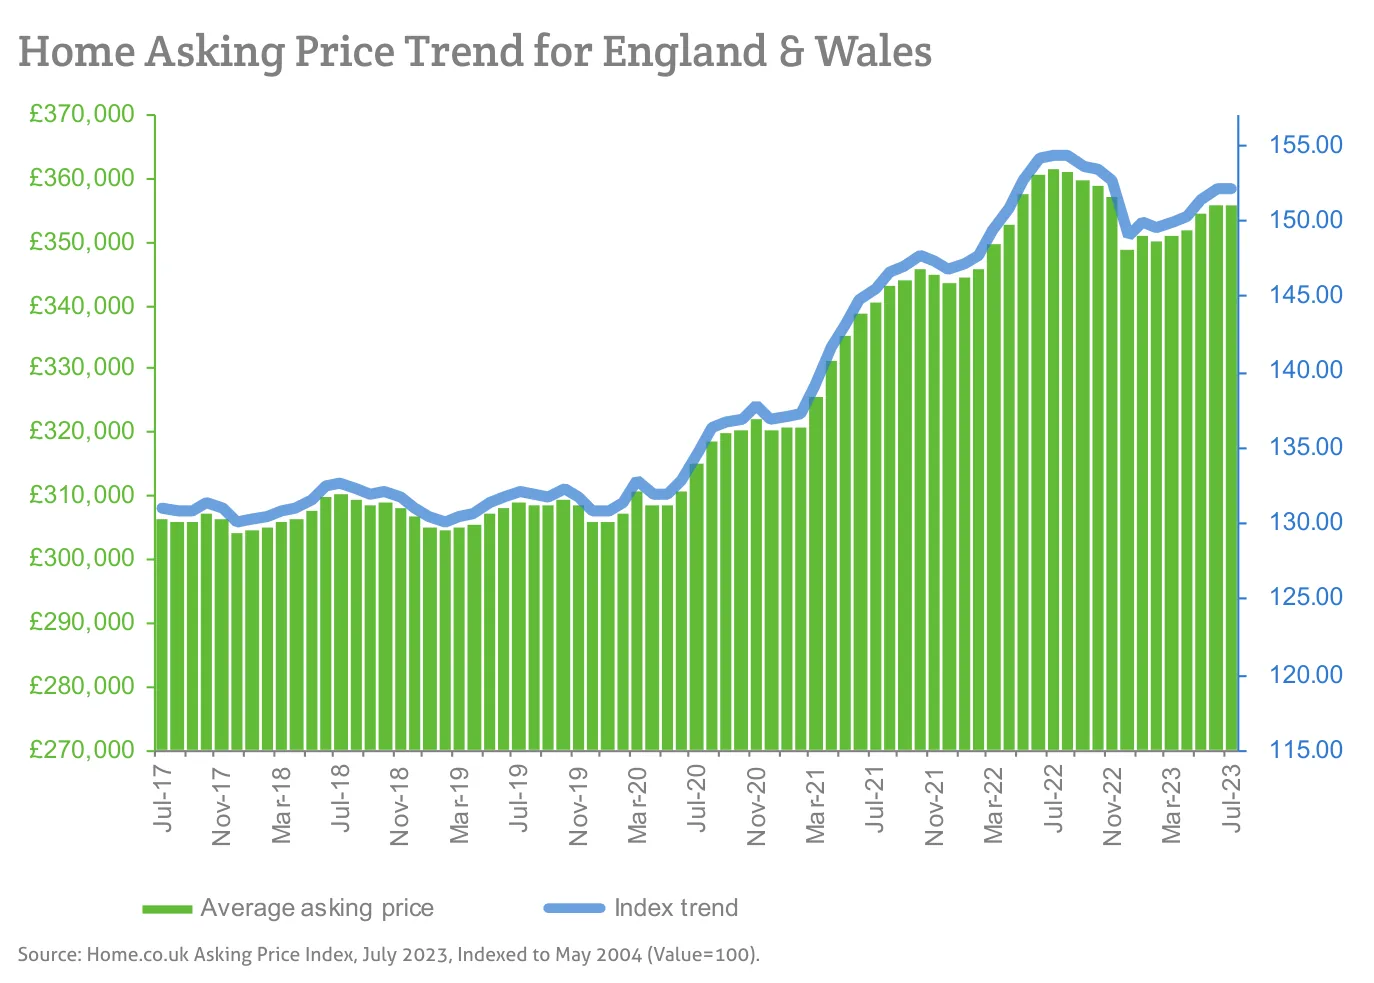
Source: Home.co.uk Asking Price Index, July 2023, Indexed to May 2004 (Value=100).
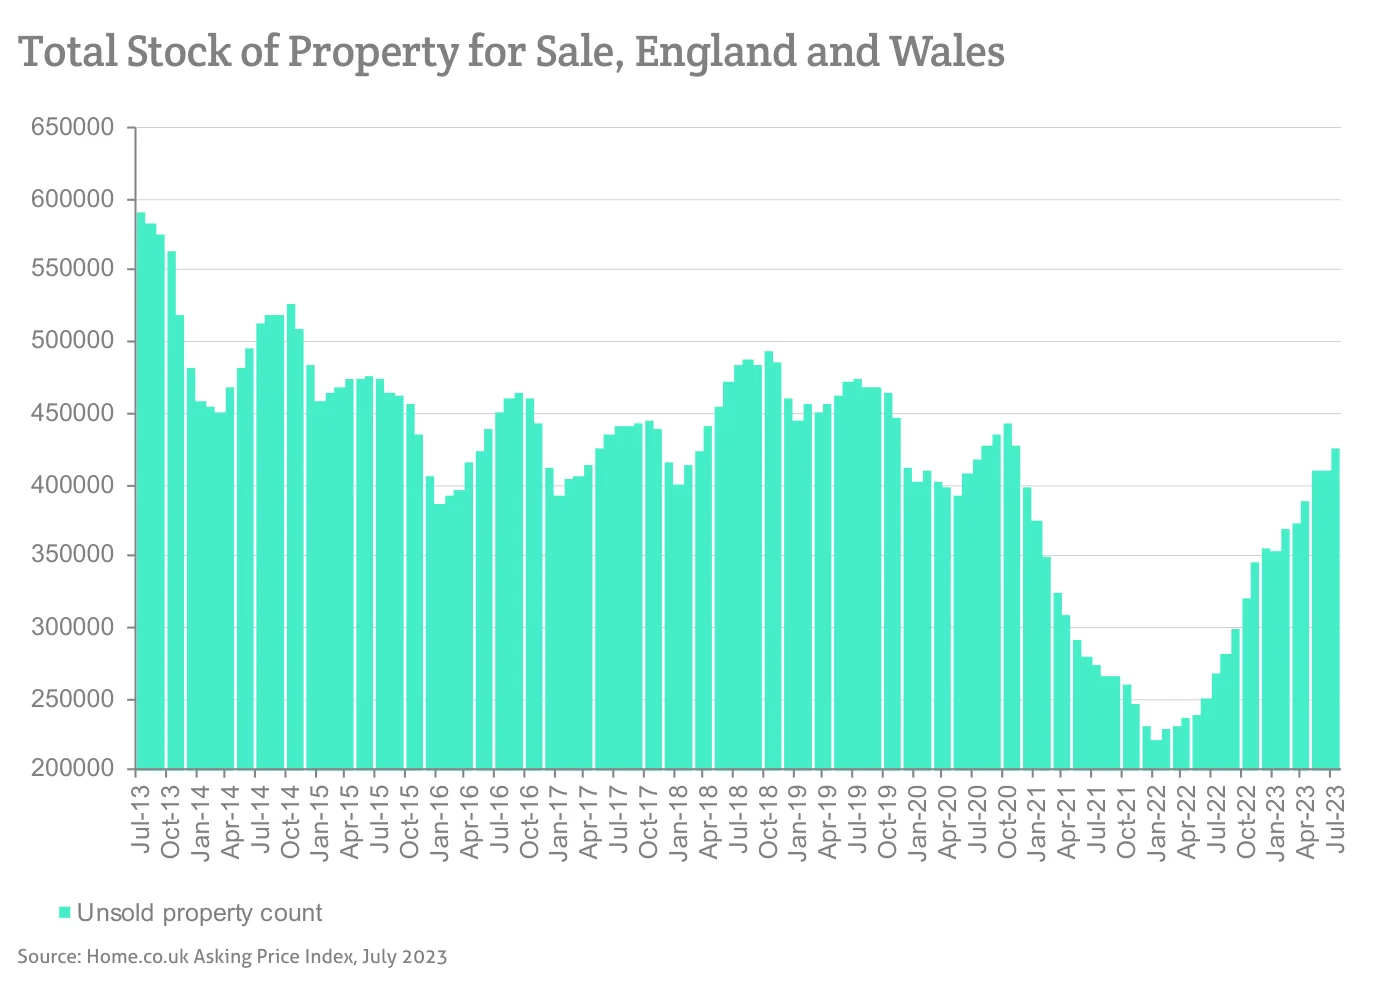
Source: Home.co.uk Asking Price Index, July 2023
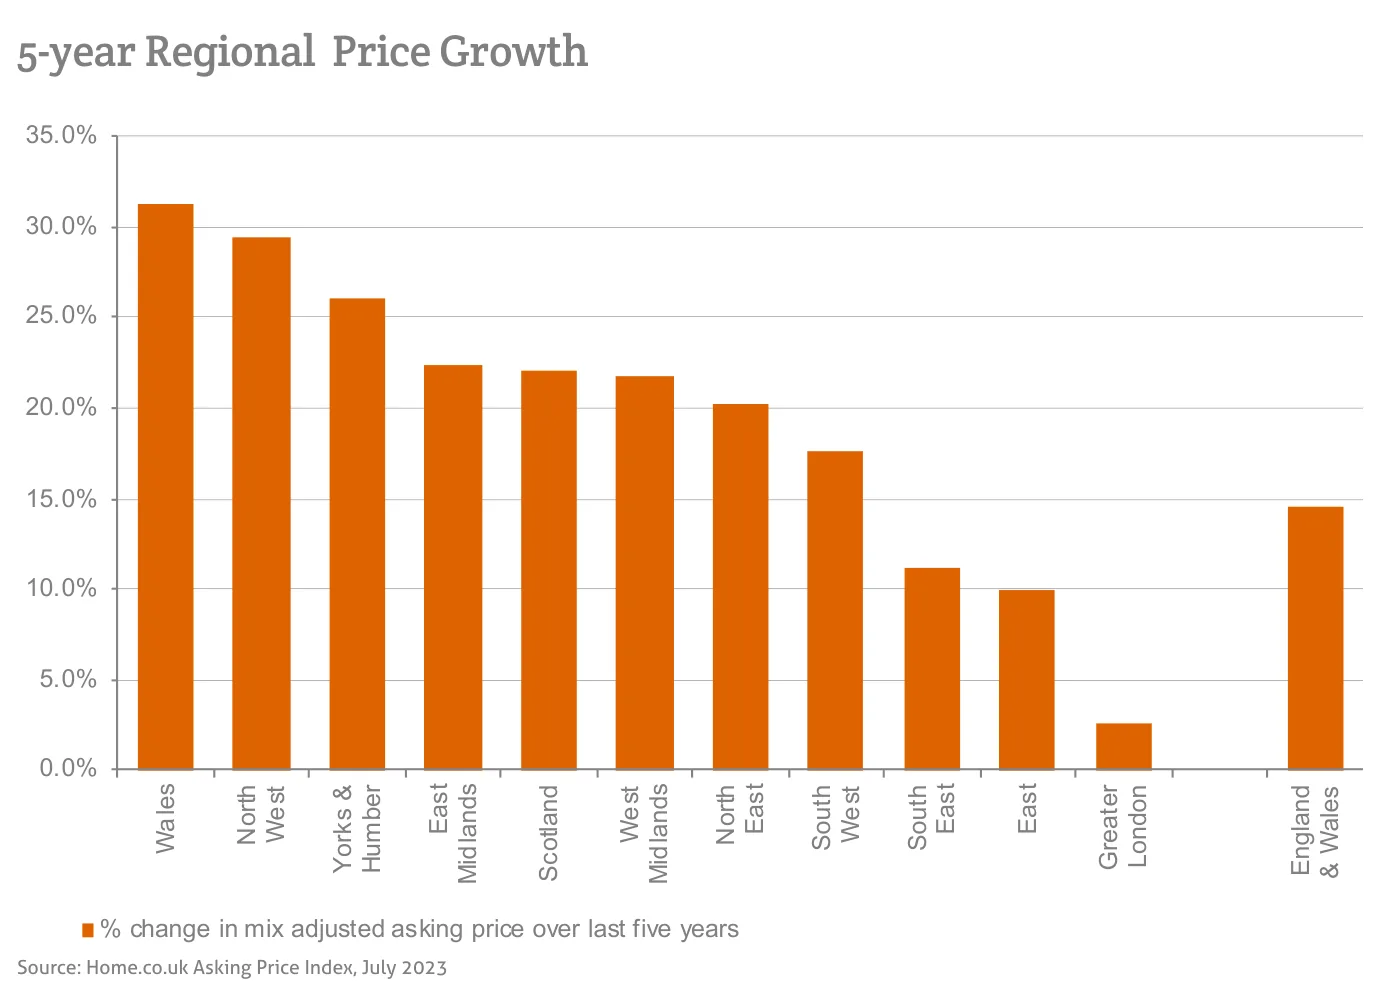
Source: Home.co.uk Asking Price Index, July 2023
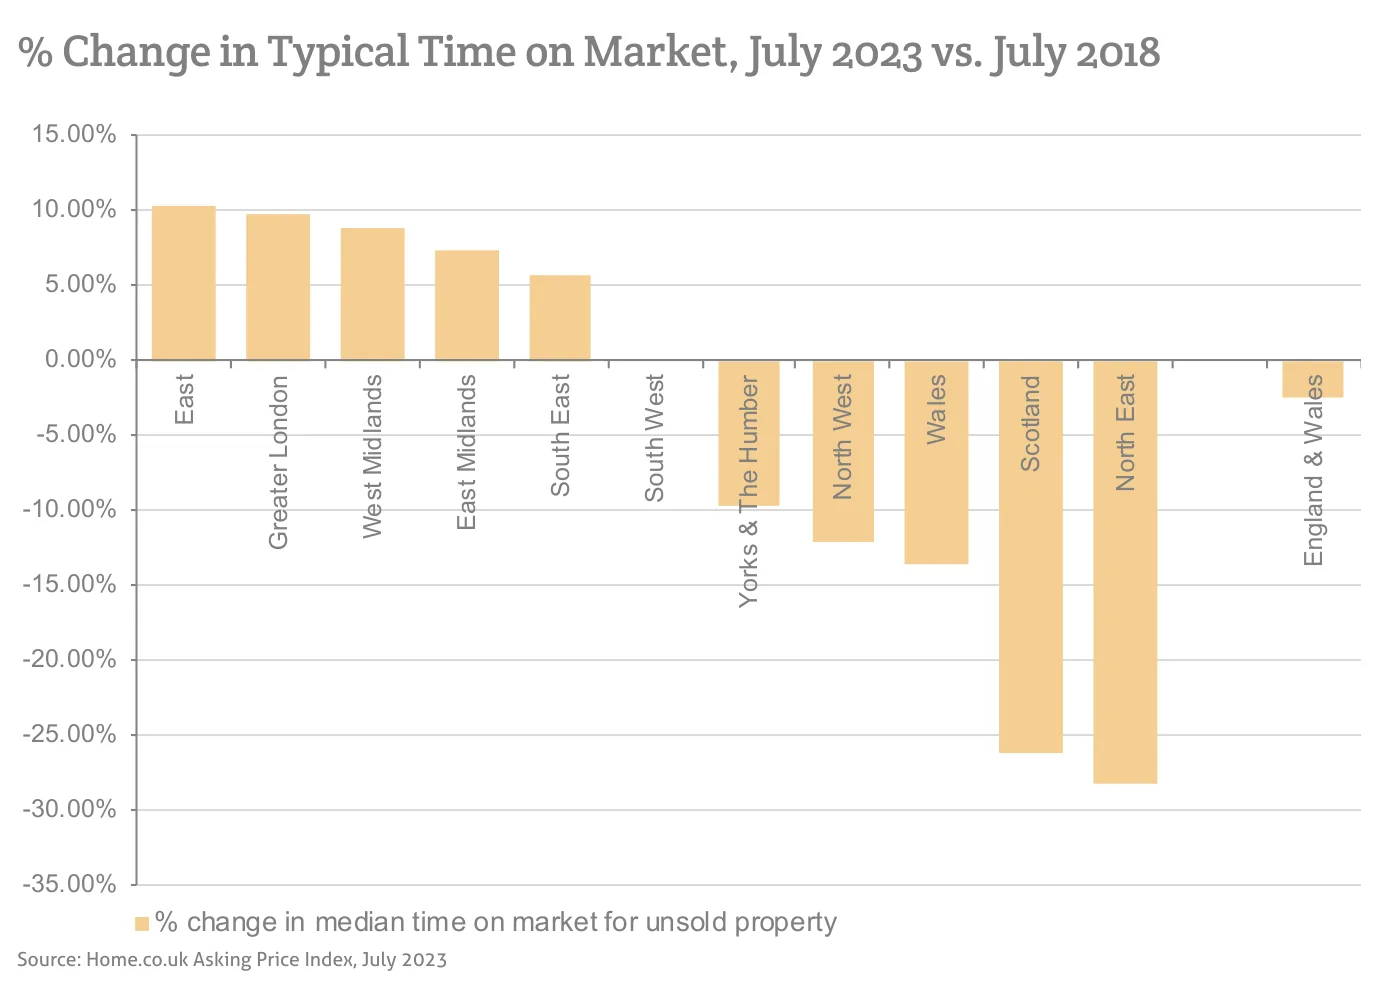
Source: Home.co.uk Asking Price Index, July 2023
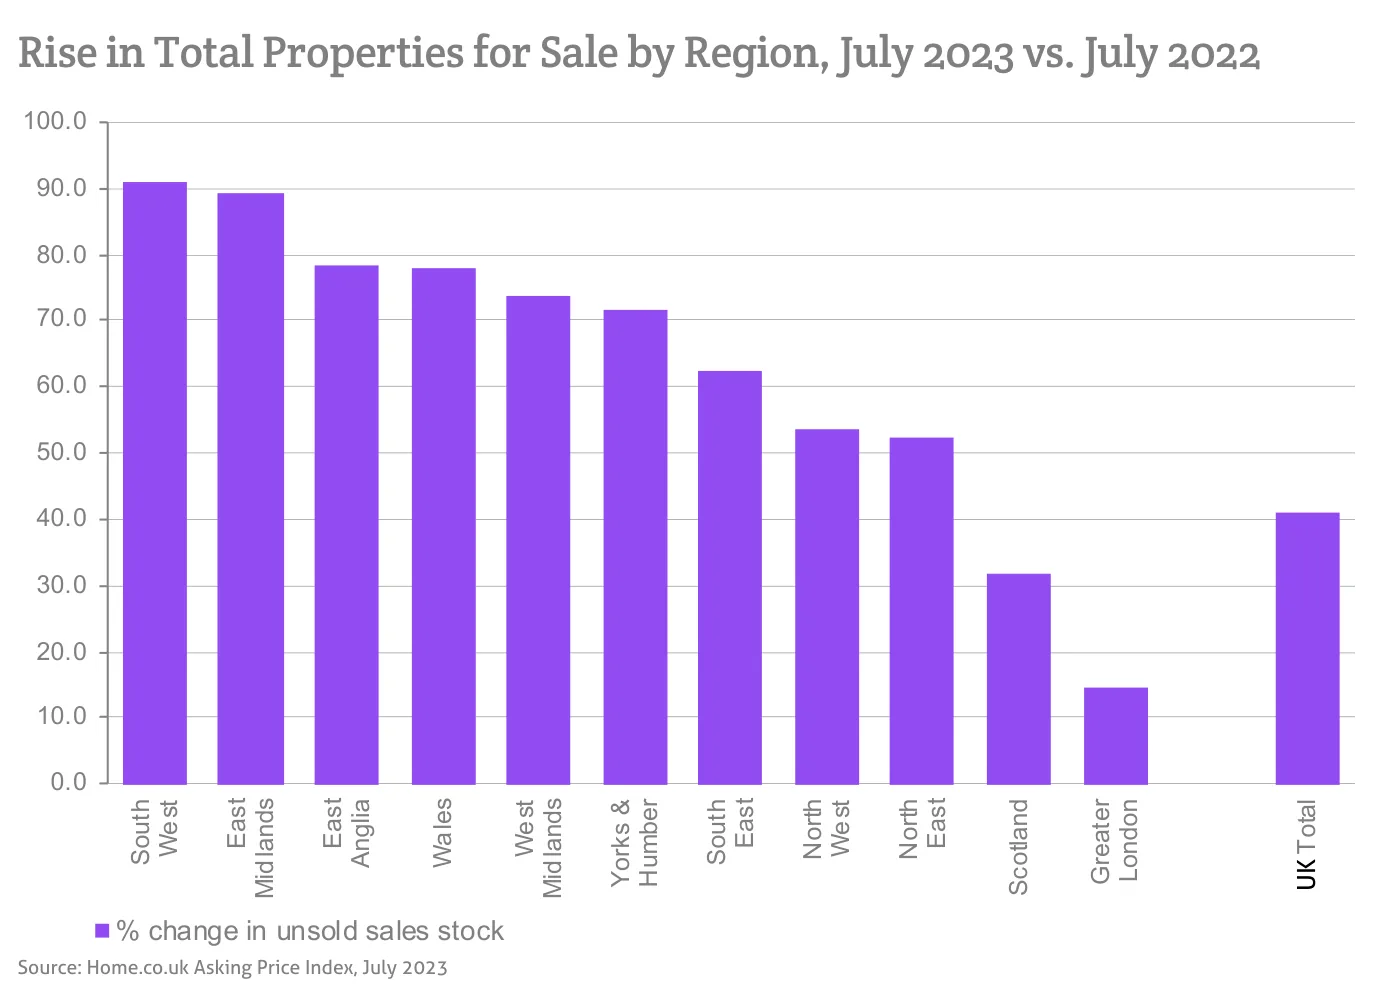
Source: Home.co.uk Asking Price Index, July 2023
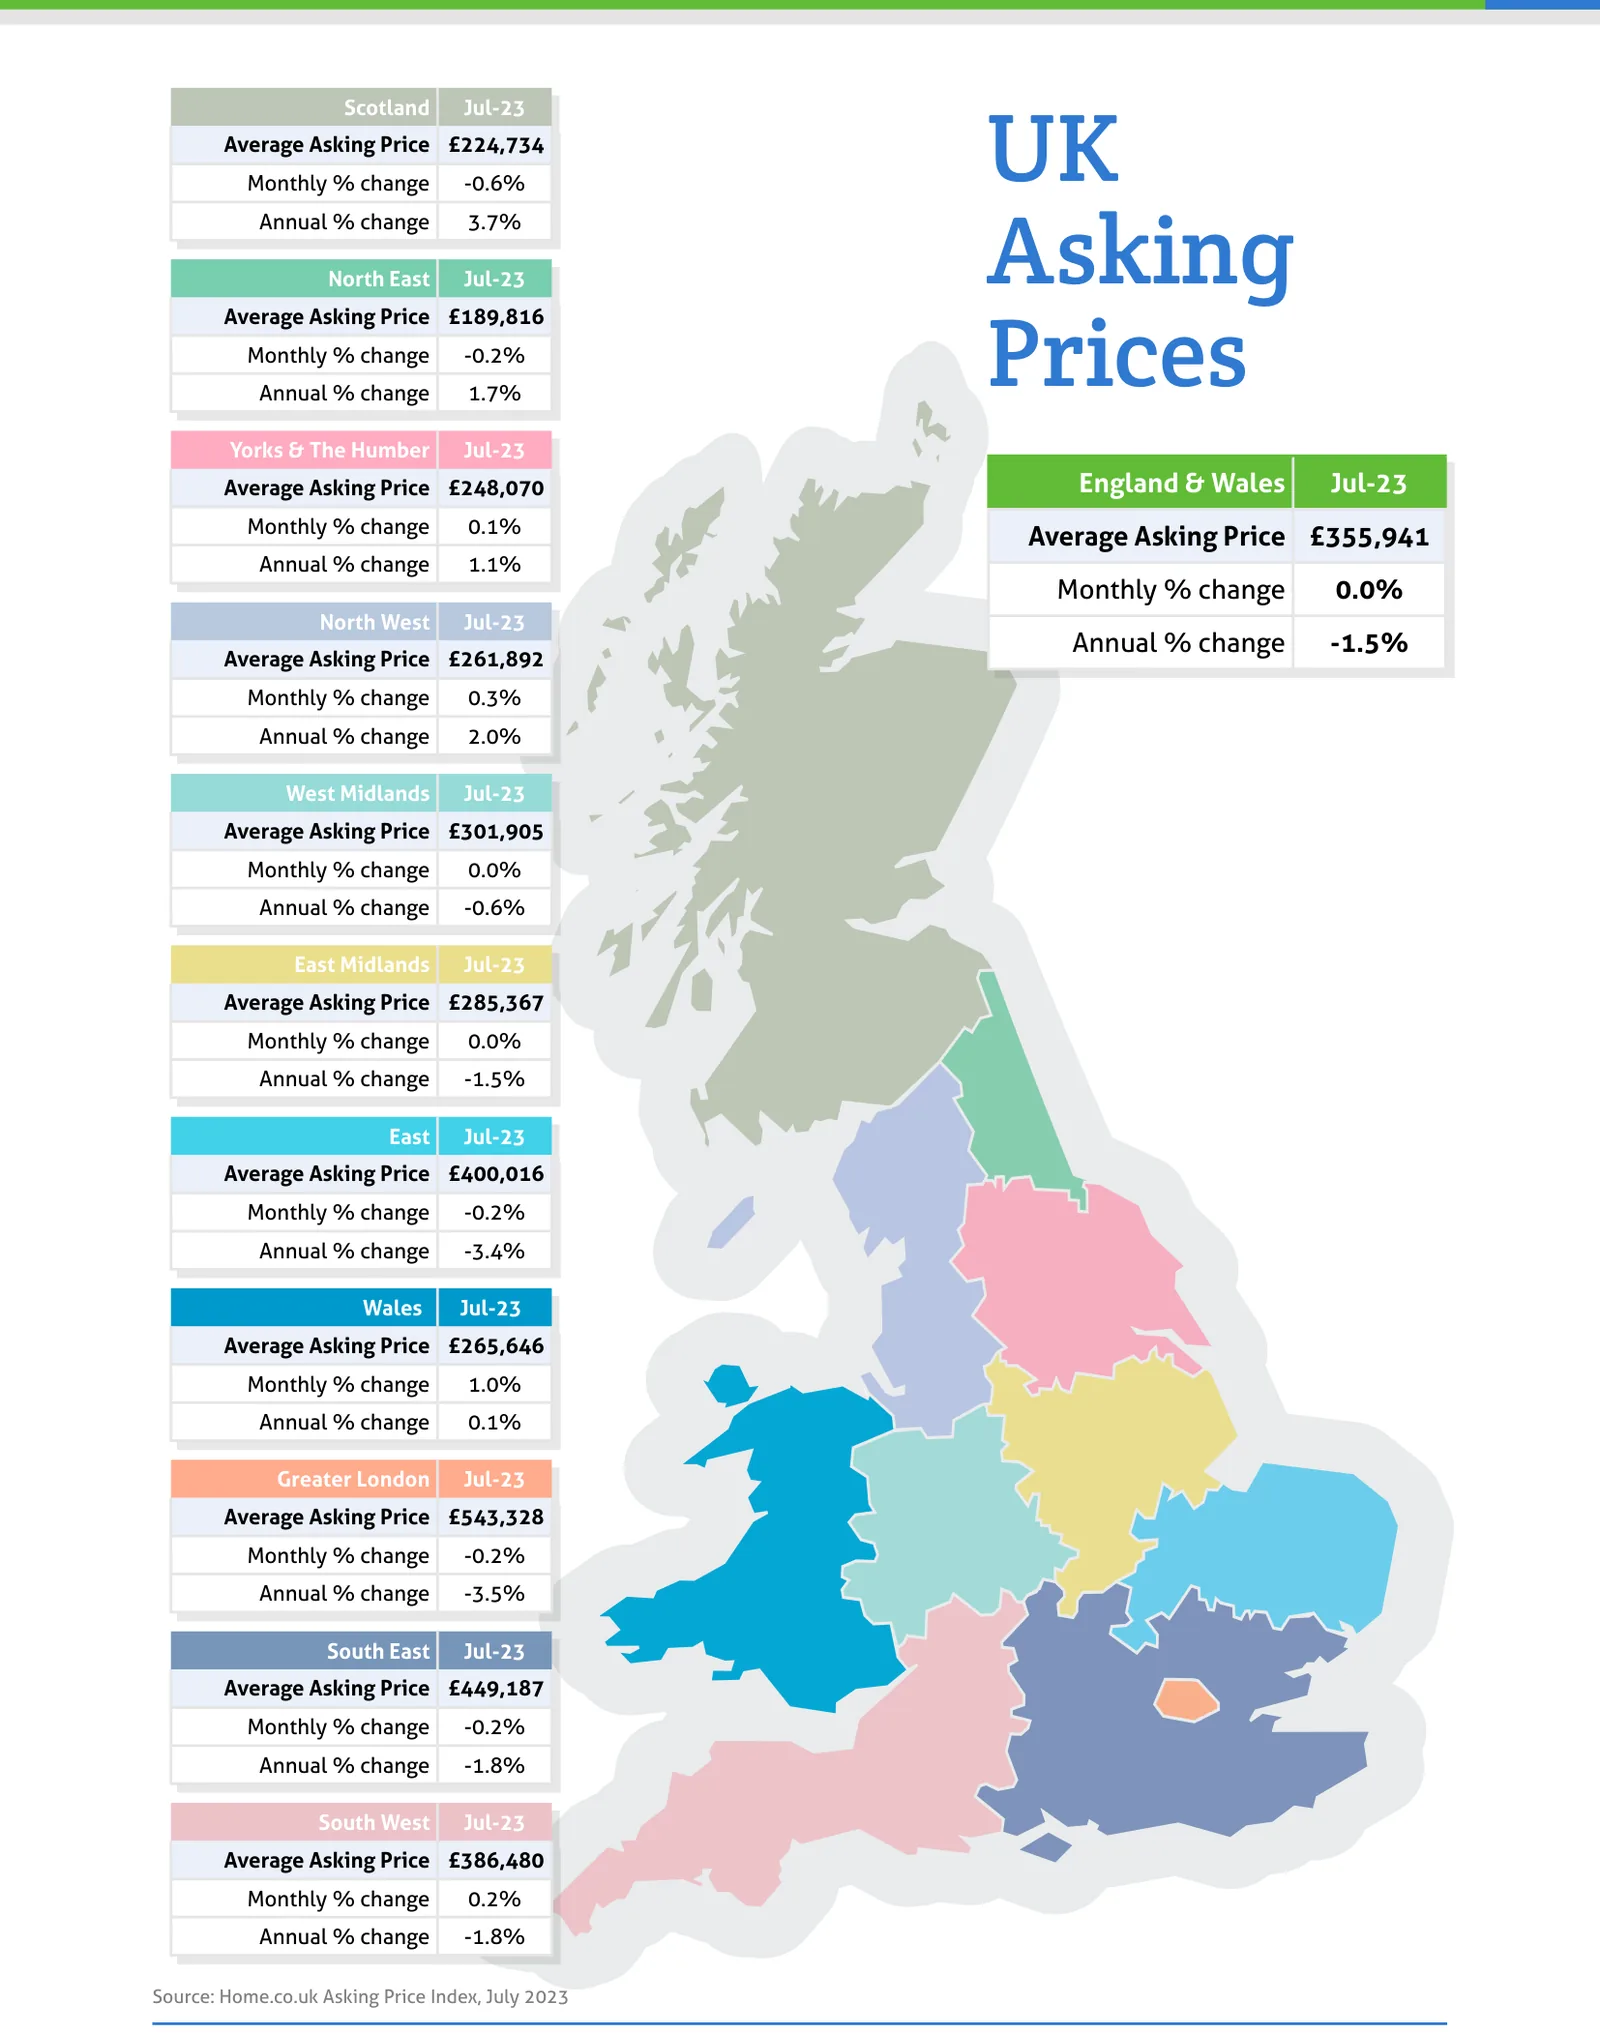
Source: Home.co.uk Asking Price Index, July 2023
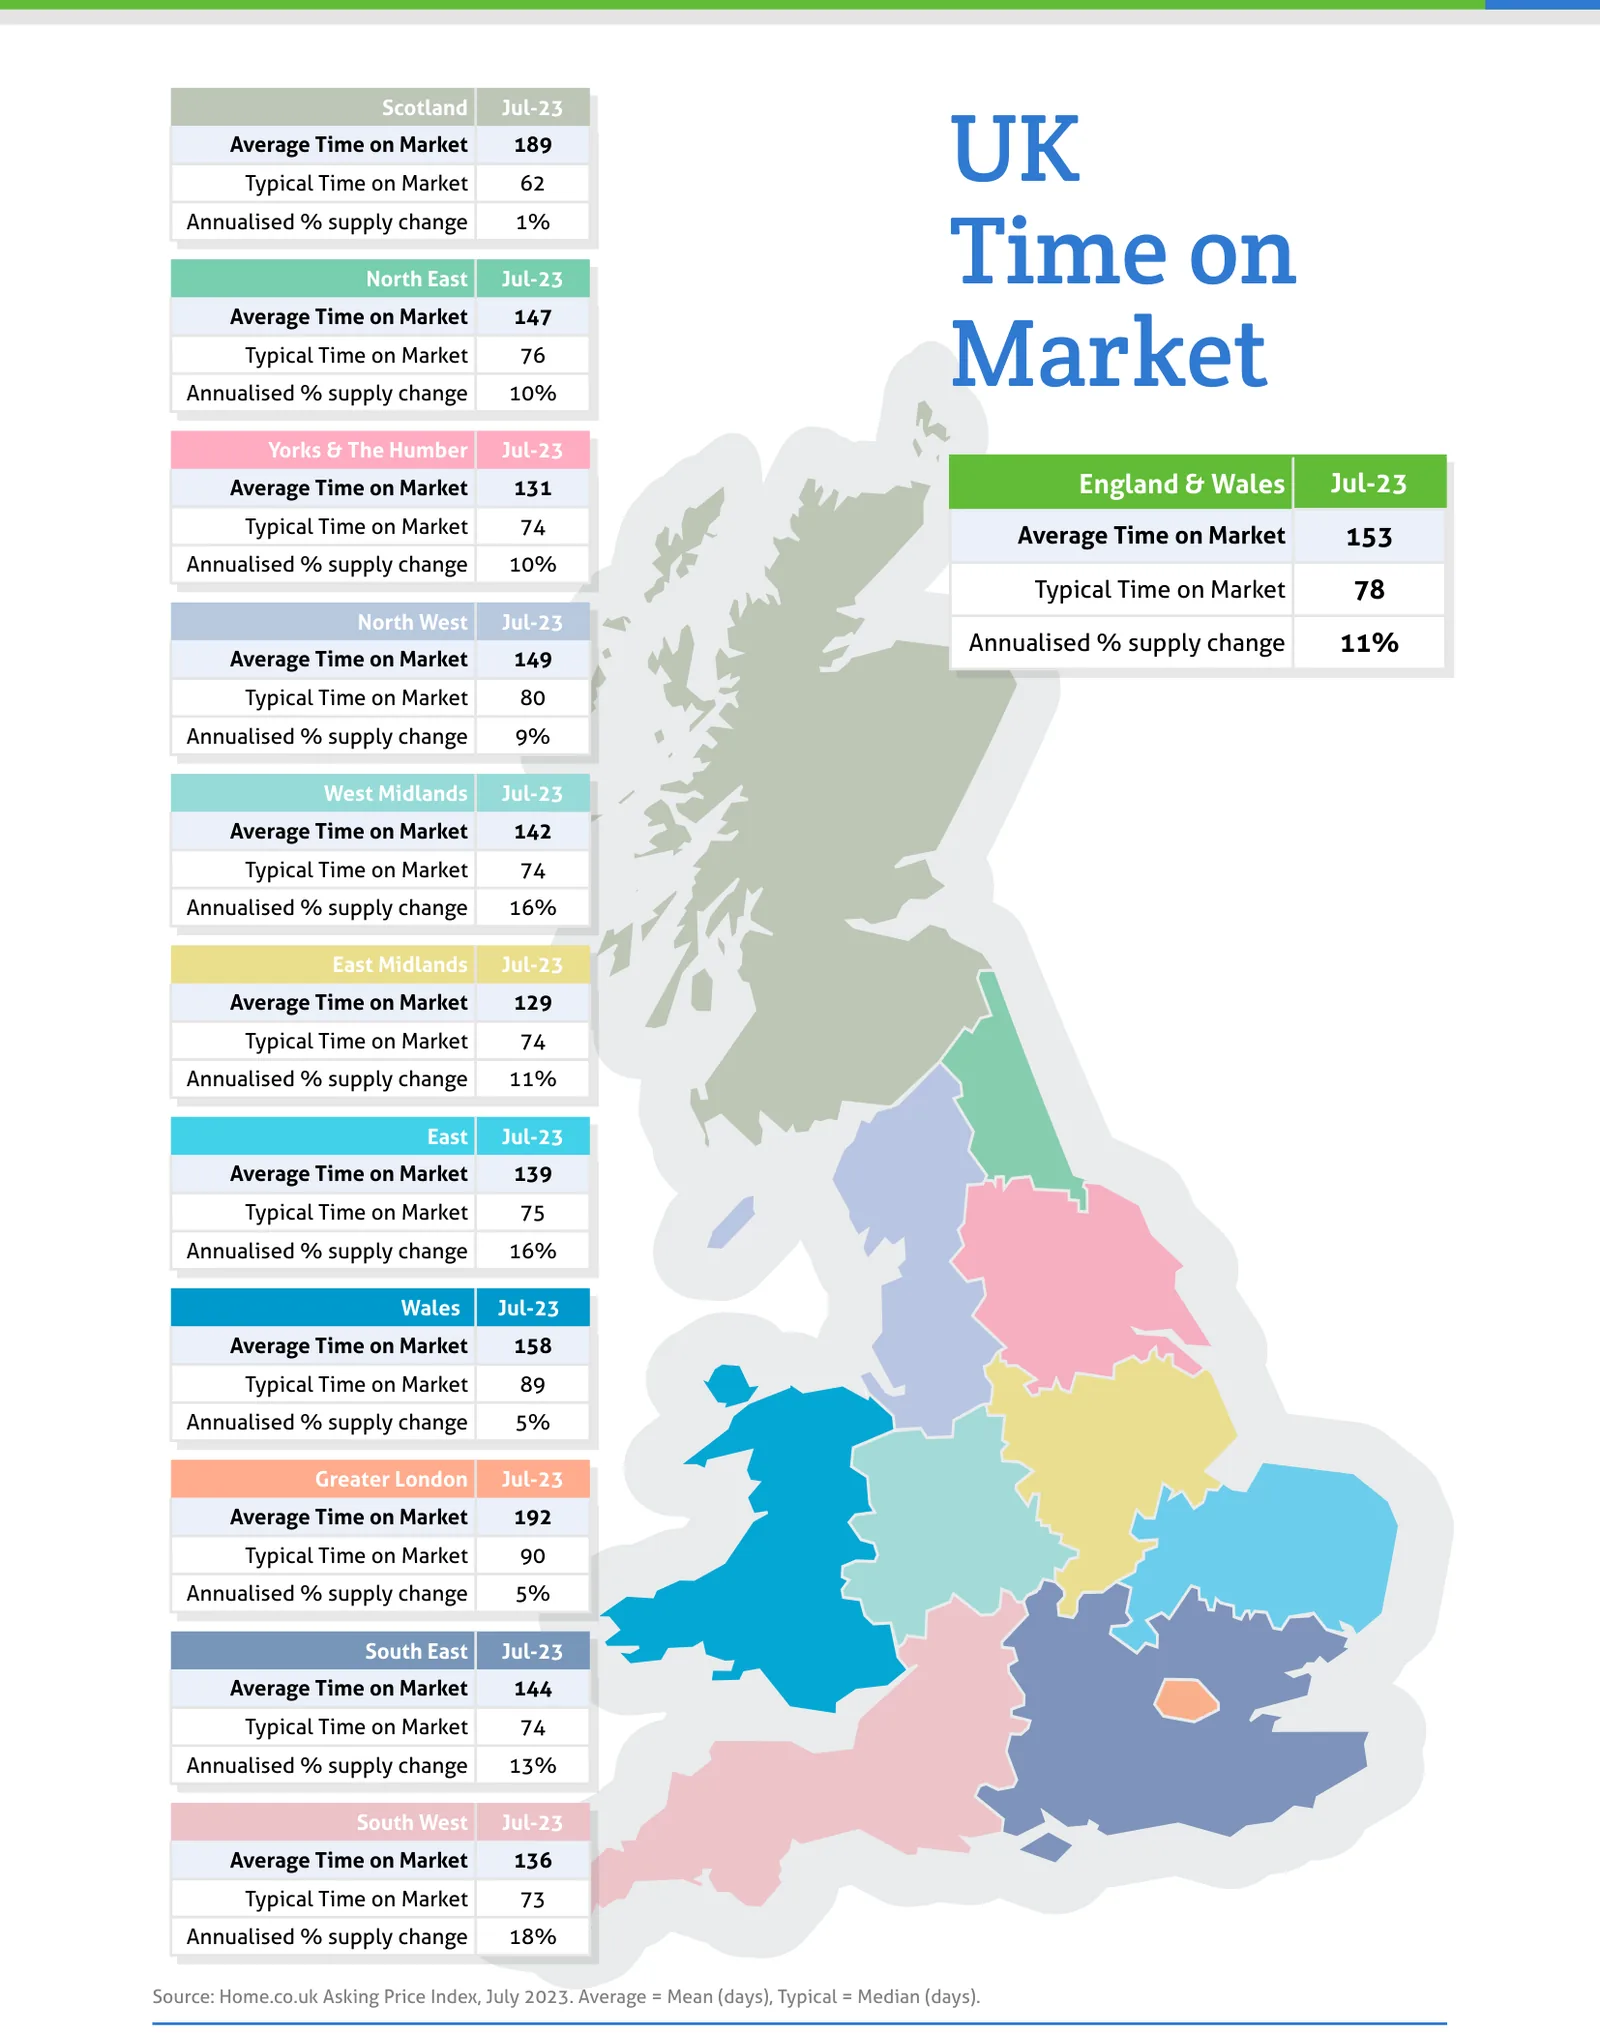
Source: Home.co.uk Asking Price Index, July 2023. Average = Mean (days), Typical = Median (days).
Regional tables
UK Asking Prices, Jul-23
| Region | Average Asking Price | Monthly % change | Annual % change |
|---|---|---|---|
| Scotland | £224,734 | -0.6% | 3.7% |
| North East | £189,816 | -0.2% | 1.7% |
| Yorks & The Humber | £248,070 | 0.1% | 1.1% |
| England & Wales | £355,941 | 0.0% | -1.5% |
| North West | £261,892 | 0.3% | 2.0% |
| West Midlands | £301,905 | 0.0% | -0.6% |
| East Midlands | £285,367 | 0.0% | -1.5% |
| East | £400,016 | -0.2% | -3.4% |
| Wales | £265,646 | 1.0% | 0.1% |
| Greater London | £543,328 | -0.2% | -3.5% |
| South East | £449,187 | -0.2% | -1.8% |
| South West | £386,480 | 0.2% | -1.8% |
UK Time on Market, Jul-23
| Region | Average Time on Market | Typical Time on Market | Annualised % supply change |
|---|---|---|---|
| Scotland | 189 | 62 | 1% |
| North East | 147 | 76 | 10% |
| Yorks & The Humber | 131 | 74 | 10% |
| England & Wales | 153 | 78 | 11% |
| North West | 149 | 80 | 9% |
| West Midlands | 142 | 74 | 16% |
| East Midlands | 129 | 74 | 11% |
| East | 139 | 75 | 16% |
| Wales | 158 | 89 | 5% |
| Greater London | 192 | 90 | 5% |
| South East | 144 | 74 | 13% |
| South West | 136 | 73 | 18% |
From the director's commentary
"It's not a pretty outlook and I expect that landlords may well continue to be used as cash cows, with the government claiming that rising rents are some kind of 'windfall'. Meanwhile, the UK's housing crisis worsens, with badly needed investment in the sector becoming too expensive (and risky) for the majority of market participants."
Doug Shephard, Director at Home.co.uk
Read the full July 2023 edition (PDF, 10 pages)
About the Home Asking Price Index
The Home Asking Price Index measures the change in the prices sellers ask for residential property across England, Wales and Scotland. Today it is computed every month from around half a million advertised homes and is mix-adjusted, so a change in what happens to be on the market does not move the figure; earlier editions state the sample they were built from. Because an asking price is set months before a sale completes, the index runs around five months ahead of completed-sale measures such as the UK House Price Index.
Every edition in the archive, back to October 2006, is listed on the index page. How we measure the UK property market explains the listing data behind it, and today's figures by area are on house prices and rental prices.
Text and figures above are quoted from the July 2023 edition as published, with punctuation normalised for the web, and are not revised. Later editions may restate them.
More in What is happening to house prices: the Home guide
Thinking about your next move?
See what your home's worth in seconds, with the UK's longest-running property data behind it.
Get an instant valuation