

























Home Asking Price Index, July 2021: regional supply at record lows as London primes for recovery
Asking prices across England and Wales rose again in July as unsold stock hit a new low despite tapering Stamp Duty relief.

This is the July 2021 edition of the Home Asking Price Index, released on 14 July 2021, under the headline:
Regional Supply at Record Lows as London Primes for Recovery
The headlines and summary below are the report's own words, with the key figures as it published them, followed by the report's charts and regional tables as printed.
Headlines
- The tapering of the Stamp Duty holiday is having no apparent calming effect on the market. In fact, the pace has quickened as buyers feverishly mop up the little sales stock available: Typical Time on Market for unsold property in England and Wales has fallen further to a mere 73 days (the lowest July figure since 2007).
- Asking prices across England and Wales continue to rise overall as demand continues to overwhelm supply, adding another 0.6% since last month, although the annualised average has slipped to 8.0%.
- Monthly supply remains vastly below normal expectations in all regions (-32% compared to June 2019). The South West is worst hit by scarcity (-44%) while Greater London, in contrast to all other regions, shows supply is only slightly below expectations (down 4% compared to June 2019).
- The total stock of property for sale in England and Wales has fallen again to a new low of 273,531, 34.6% lower than in June 2020 and 43.4% less than in June 2018.
- Fierce demand has again forced up prices in every English region (except London), Wales and Scotland since last month, with the largest hikes in the East (+1.4%) and South West (+1.0%).
- The East of England property market now leads the 12-month regional growth chart at 11.4%, followed closely by the East Midlands (11.3%) and further outpacing the former leading regions of Yorkshire, Wales and the North West.
- Greater London remains the UK's worst-performing region with 3.7% annualised growth, although there are clear indications that this sales market may soon pick up.
- Rents continue to recover in the Greater London lettings market. Annualised growth in asking rents has now moved into positive territory for the first time since the COVID exodus began (+1.3%) and all boroughs without exception indicate rent rises over the last three months. The most impressive rises in asking rents over just the last six months are in the City (+36.0%), Kensington and Chelsea (+20.0%), Westminster (+17.7%) and Wandsworth (+16.7%), suggesting that the wealthy are returning and creating significant demand.
- A marked reduction in supply of rental properties now persists in all English regions, Scotland and Wales, thereby supporting the recent record hikes outside of London. However, rent rises in the regions are slowing as some demand now shifts back towards central London.
- The largest annualised average rent hikes remain in the East of England (+11.0%) and the South West (+14.6%).
Summary
The UK property market shows little or no sign of cooling despite the tapering of the Stamp Duty tax break. Unsold property is spending even less time on the market and prices continue their upward march overall, despite a lacklustre London market. The total stock of property for sale continues its downward trajectory, recording new lows each month. Supply of property entering the market remains extremely low outside of London and even there the monthly total has fallen back to below expectations. Demand for rental property in central London is returning swiftly, accompanied by huge hikes in asking rents. Confidence is returning and will likely soon rekindle the capital's sales market where growth has been near zero over the last five years.
The East Midlands and East of England continue to lead in terms of regional price growth. Annualised home price inflation is just above 11% in both these regions, supported by vast demand and a dearth of supply. As with the rest of the country, the tapering off of the Stamp Duty holiday will likely reduce buyer demand in these sales markets but, such is the very low level of supply, price pressure looks set to remain upward. We therefore expect that prices and rents will continue to rise in concert, albeit at a slower pace, until there is a notable loosening of supply in either market.
Key figures
| Measure | Figure |
|---|---|
| Typical Time on Market | 73 days |
| Monthly asking price change | +0.6% |
| Annual asking price change | +8.0% |
| Total unsold stock | 273,531 |
| Supply change vs June 2019 | -32% |
| Stock decline vs June 2020 | -34.6% |
| Stock decline vs June 2018 | -43.4% |
Figures are for England and Wales unless the report states otherwise, as published in the edition.
Charts from the report
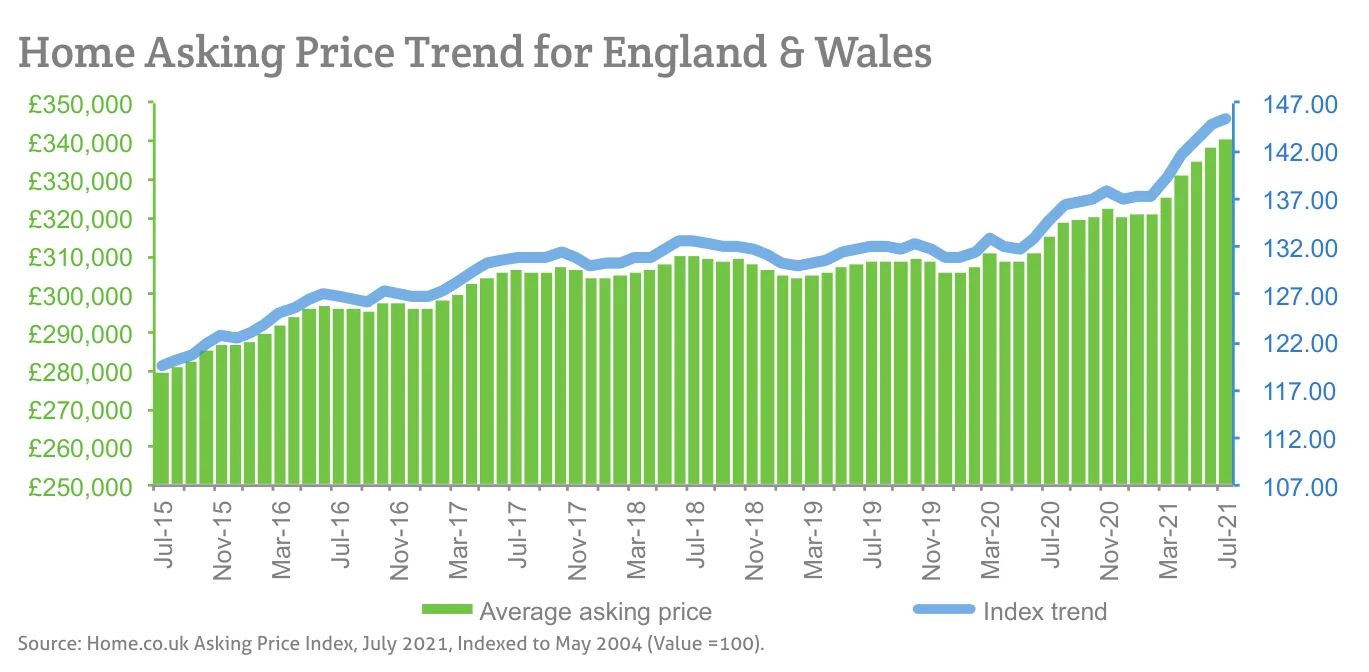
Source: Home.co.uk Asking Price Index, July 2021, Indexed to May 2004 (Value =100).
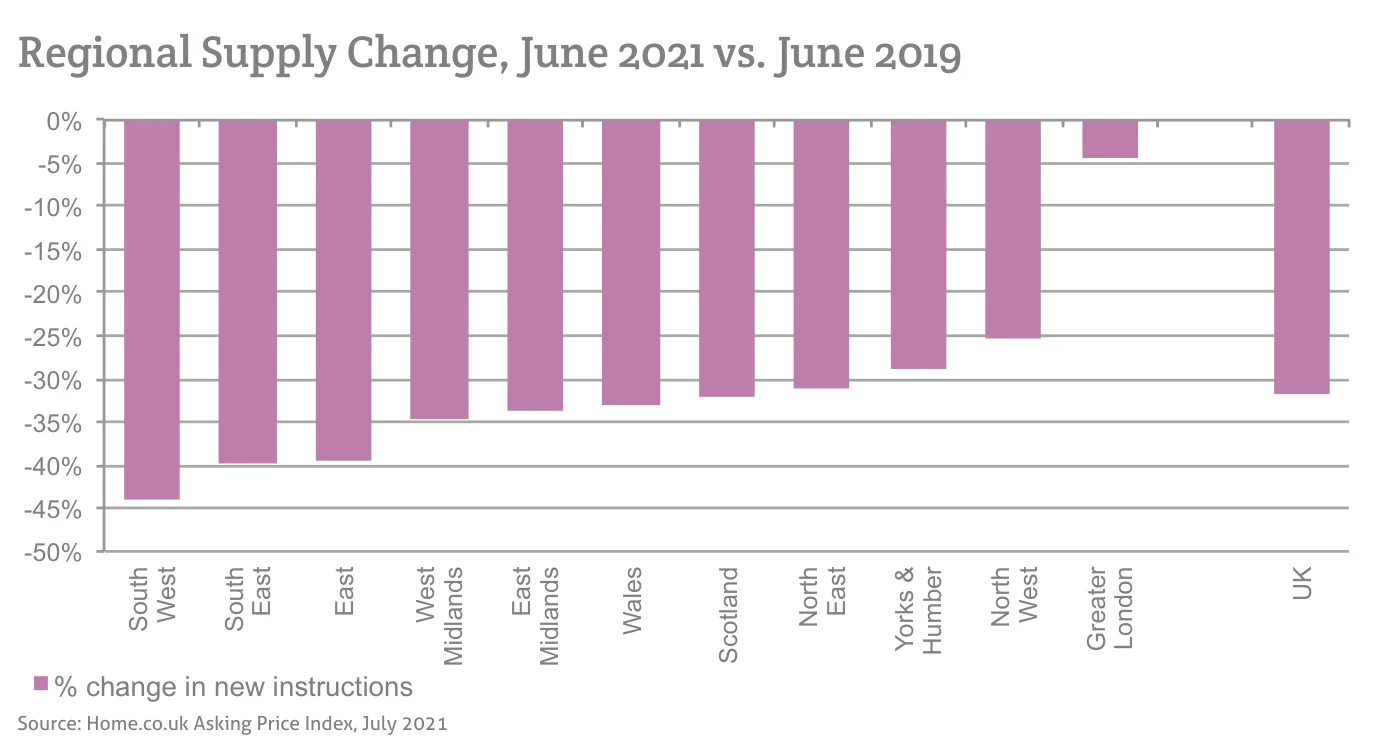
Source: Home.co.uk Asking Price Index, July 2021
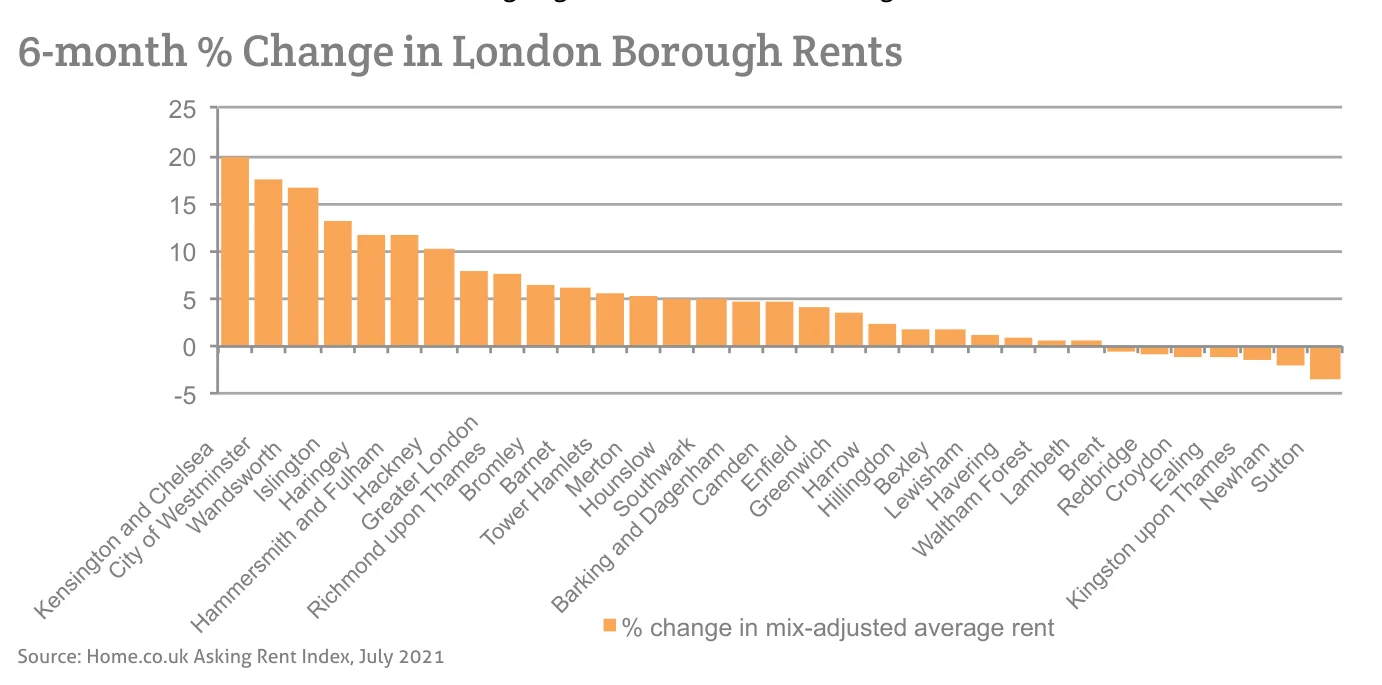
Source: Home.co.uk Asking Rent Index, July 2021
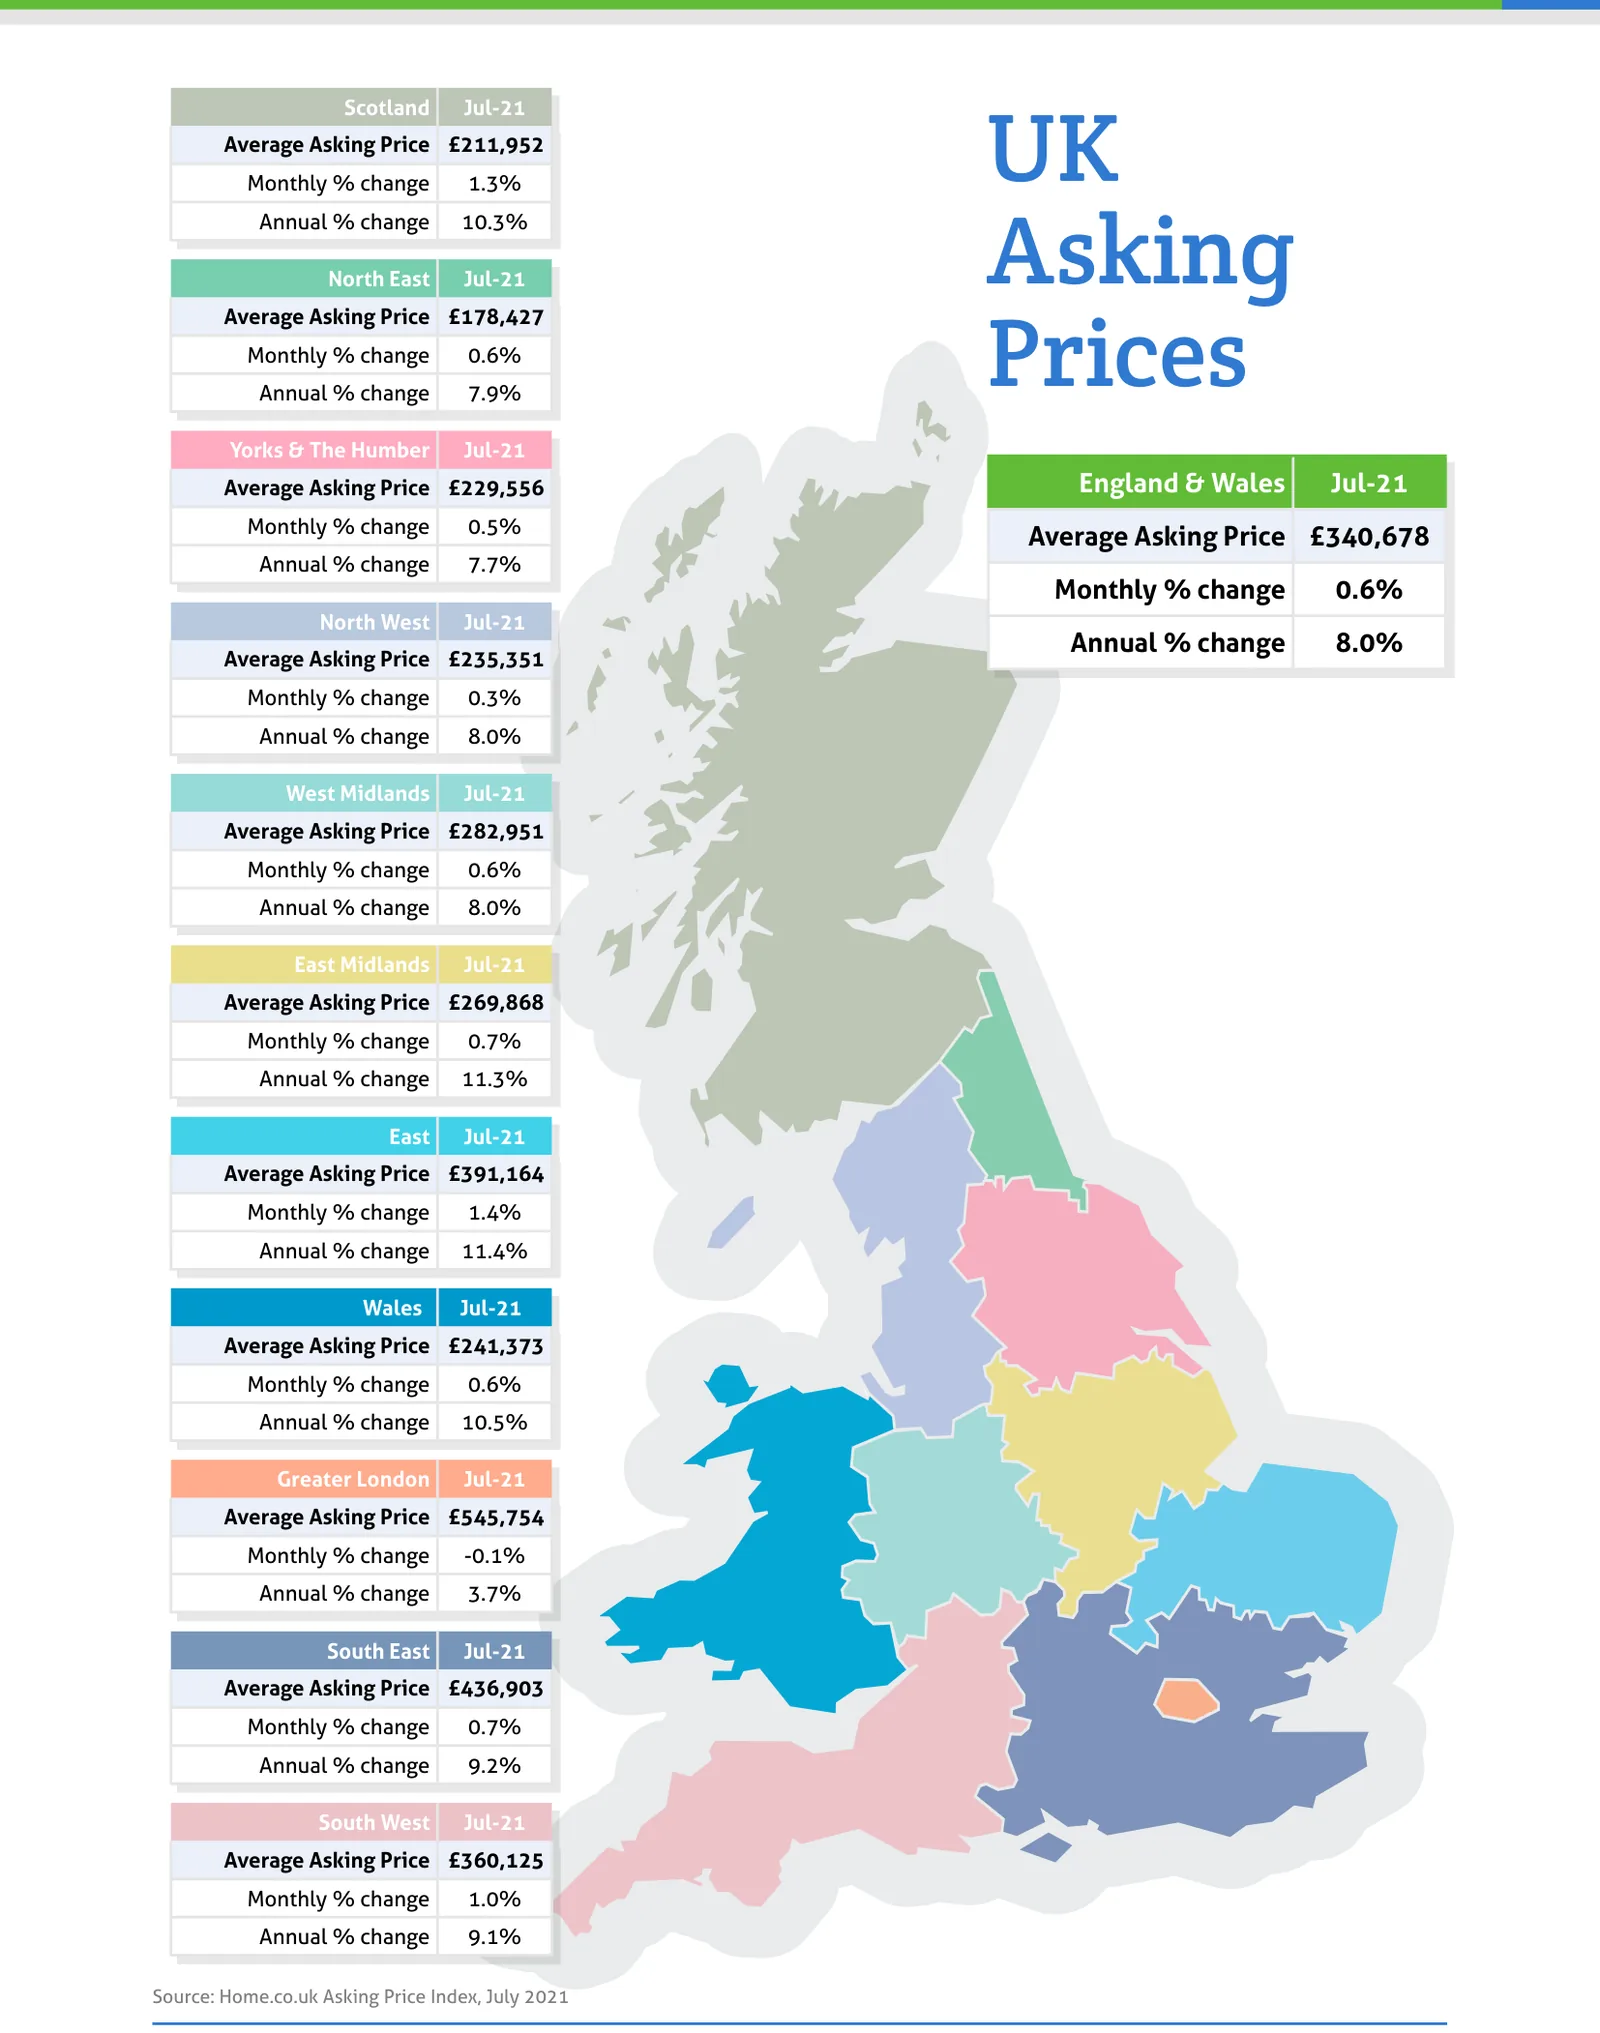
Source: Home.co.uk Asking Price Index, July 2021
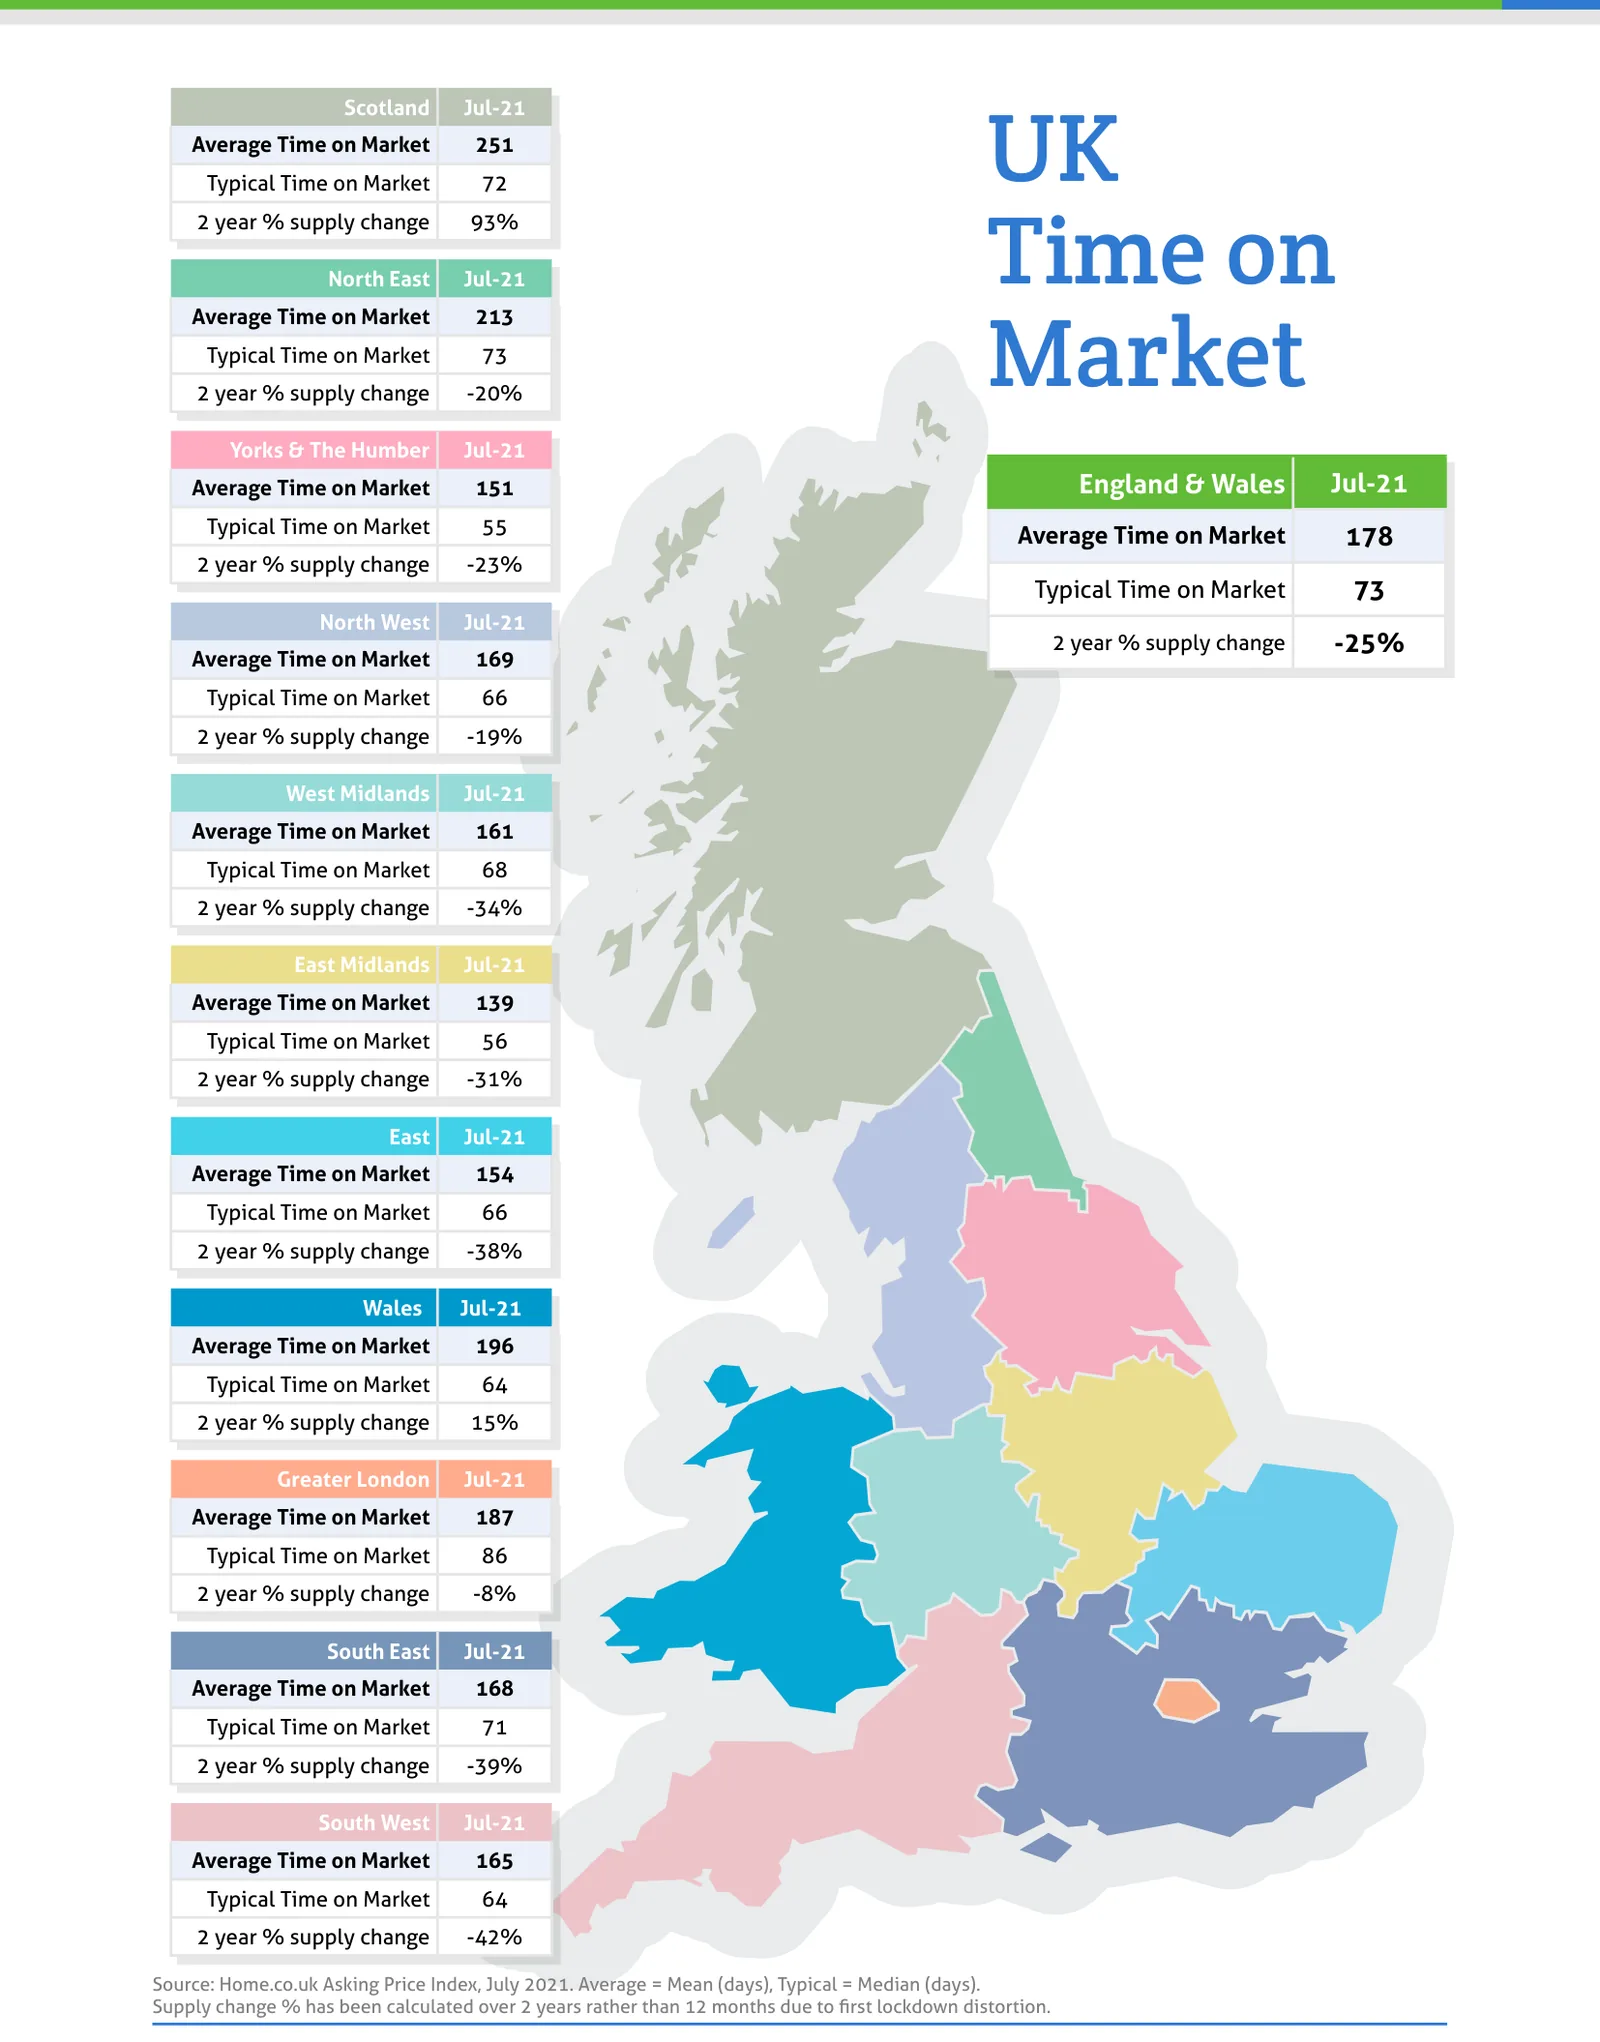
Source: Home.co.uk Asking Price Index, July 2021. Average = Mean (days), Typical = Median (days).
Regional tables
UK Asking Prices, Jul-21
| Region | Average Asking Price | Monthly % change | Annual % change |
|---|---|---|---|
| Scotland | £211,952 | 1.3% | 10.3% |
| North East | £178,427 | 0.6% | 7.9% |
| Yorks & The Humber | £229,556 | 0.5% | 7.7% |
| England & Wales | £340,678 | 0.6% | 8.0% |
| North West | £235,351 | 0.3% | 8.0% |
| West Midlands | £282,951 | 0.6% | 8.0% |
| East Midlands | £269,868 | 0.7% | 11.3% |
| East | £391,164 | 1.4% | 11.4% |
| Wales | £241,373 | 0.6% | 10.5% |
| Greater London | £545,754 | -0.1% | 3.7% |
| South East | £436,903 | 0.7% | 9.2% |
| South West | £360,125 | 1.0% | 9.1% |
UK Time on Market, Jul-21
| Region | Average Time on Market | Typical Time on Market | 2 year % supply change |
|---|---|---|---|
| Scotland | 251 | 72 | 93% |
| North East | 213 | 73 | -20% |
| Yorks & The Humber | 151 | 55 | -23% |
| England & Wales | 178 | 73 | -25% |
| North West | 169 | 66 | -19% |
| West Midlands | 161 | 68 | -34% |
| East Midlands | 139 | 56 | -31% |
| East | 154 | 66 | -38% |
| Wales | 196 | 64 | 15% |
| Greater London | 187 | 86 | -8% |
| South East | 168 | 71 | -39% |
| South West | 165 | 64 | -42% |
From the director's commentary
"It is clear that mortgage forbearance and the furlough scheme have essentially disconnected the housing market from the economic woes of the coronavirus pandemic. Even repossessions have been temporarily reduced from around 1,700 per quarter to a mere 300 or so."
Doug Shephard, Director at Home.co.uk
Read the full July 2021 edition (PDF, 7 pages)
About the Home Asking Price Index
The Home Asking Price Index measures the change in the prices sellers ask for residential property across England, Wales and Scotland. Today it is computed every month from around half a million advertised homes and is mix-adjusted, so a change in what happens to be on the market does not move the figure; earlier editions state the sample they were built from. Because an asking price is set months before a sale completes, the index runs around five months ahead of completed-sale measures such as the UK House Price Index.
Every edition in the archive, back to October 2006, is listed on the index page. How we measure the UK property market explains the listing data behind it, and today's figures by area are on house prices and rental prices.
Text and figures above are quoted from the July 2021 edition as published, with punctuation normalised for the web, and are not revised. Later editions may restate them.
More in What is happening to house prices: the Home guide
Thinking about your next move?
See what your home's worth in seconds, with the UK's longest-running property data behind it.
Get an instant valuation