

























Home Asking Price Index, July 2017: house price growth falls further behind inflation
Average asking prices in England and Wales rose 3.3% year on year in July 2017, falling roughly 1.2% in real terms as inflation outpaced growth.

This is the July 2017 edition of the Home Asking Price Index, released on 12 July 2017, under the headline:
House Price Growth Falls Further Behind Inflation
The headlines and summary below are the report's own words, with the key figures as it published them, followed by the report's charts and regional tables as printed.
Headlines
- Home prices nudge up by 0.2% month-on-month and 3.3% year-on-year but fall by around 1.2% in real terms.
- Greater London prices edge up by 0.1% this month but average prices there remain unchanged since July 2016.
- Longer marketing times in the East of England, South East and Greater London reveal the slowdown occurring in these formerly vigorous property markets.
- Again, the West Midlands and East Midlands top the monthly price rises, joined by Scotland and Wales, with rises of 0.8%, 0.6%, 0.7%, 0.6% respectively.
- Typical Time on Market rises by four days to 82 days, the same as in July 2016 (England and Wales).
- The number of properties entering the UK market is up overall by 5% YoY.
- Supply has surged further in the East, London and South East, by 18%, 21% and 14% respectively compared to June 2016.
Summary
The UK property market has clearly entered a period of stagflation. Our data suggests that home price growth has been lower than inflation for six consecutive months. Whilst the average asking price is 3.3% more than in July 2016, the Retail Price Index (RPI) is rising faster (4.1% in May, according to the Office for National Statistics, and we estimate the current value to be around 4.5%) making home prices fall overall, in real terms, by around 1.2%.
At present, only four regions are showing genuine real rises in asset values, namely: the East of England, the East Midlands, the West Midlands and the South West. Forecasts are for the RPI to 'spike' and fall back to around 3% over the next few years. However, in the wake of the London boom, UK home prices look set to endure several years of low growth, hence this stagflationary period could be rather prolonged.
With Greater London, the worst performing area, showing zero price growth year-on-year, it is the regions that are supporting the current overall growth figure. The main contributors are the East of England, the East Midlands, the West Midlands and the South West, all with year-on-year price rises above 4%. However, an unseasonal price dip in the East of England suggests that mounting supply (up 18% in the region) coupled with record high pricing is taking its toll on demand. Hence, looking forward, this region may not contribute to the overall growth figures as before.
Key figures
| Measure | Figure |
|---|---|
| Average asking price (England & Wales) | £306,603 |
| Monthly change (England & Wales) | 0.2% |
| Annual change (England & Wales) | 3.3% |
| Real terms price change | -1.2% |
| RPI (May, ONS) | 4.1% |
| Estimated current RPI | 4.5% |
| Typical Time on Market (England and Wales) | 82 days |
| New instructions (UK, YoY) | 5% |
Figures are for England and Wales unless the report states otherwise, as published in the edition.
Charts from the report
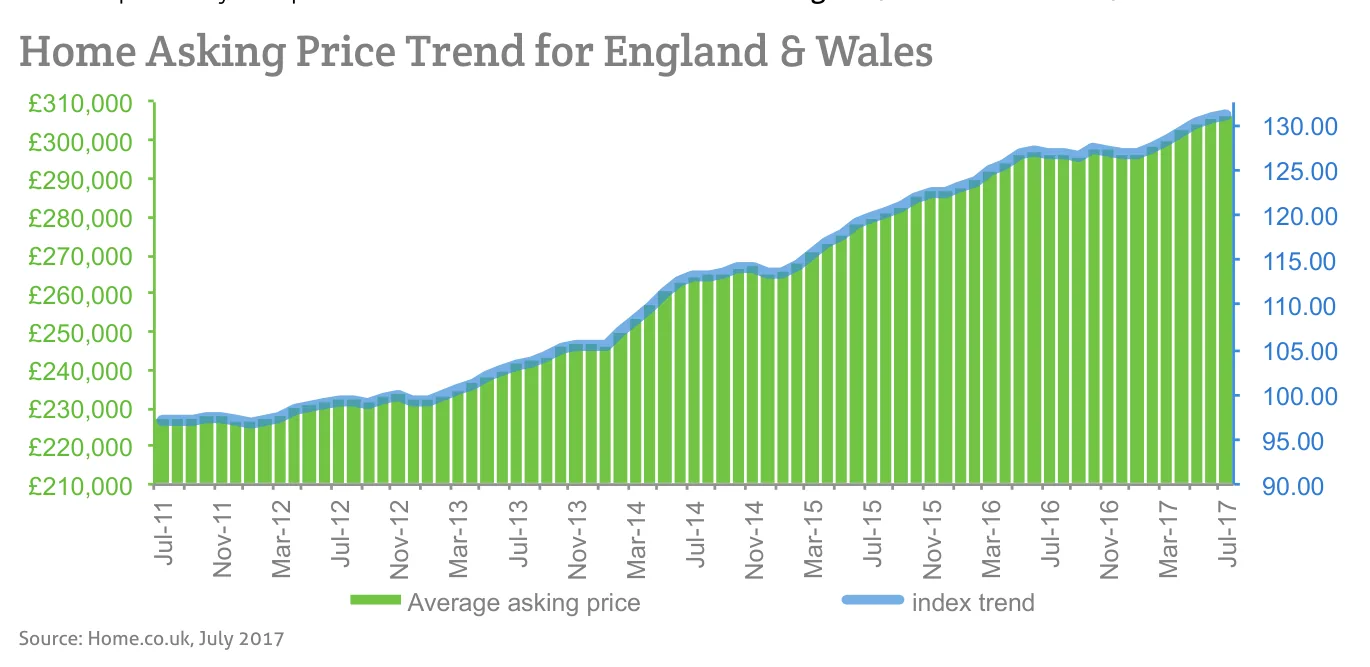
Source: Home.co.uk, July 2017
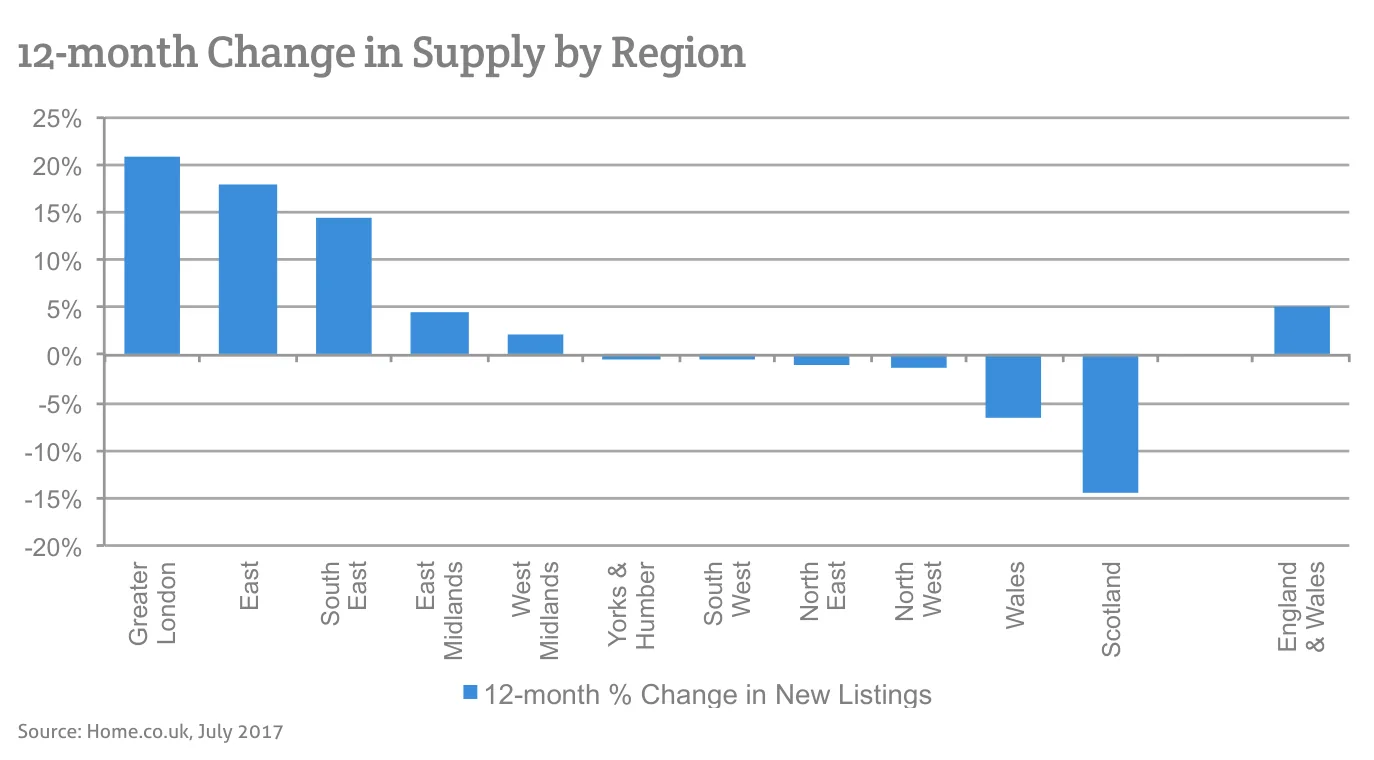
Source: Home.co.uk, July 2017
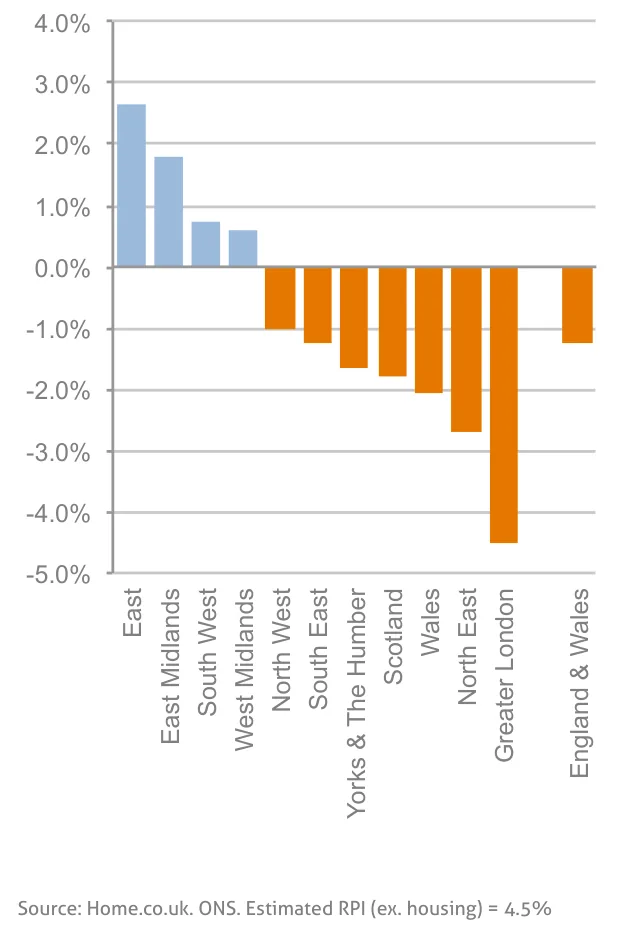
Source: Home.co.uk. ONS. Estimated RPI (ex. housing) = 4.5%
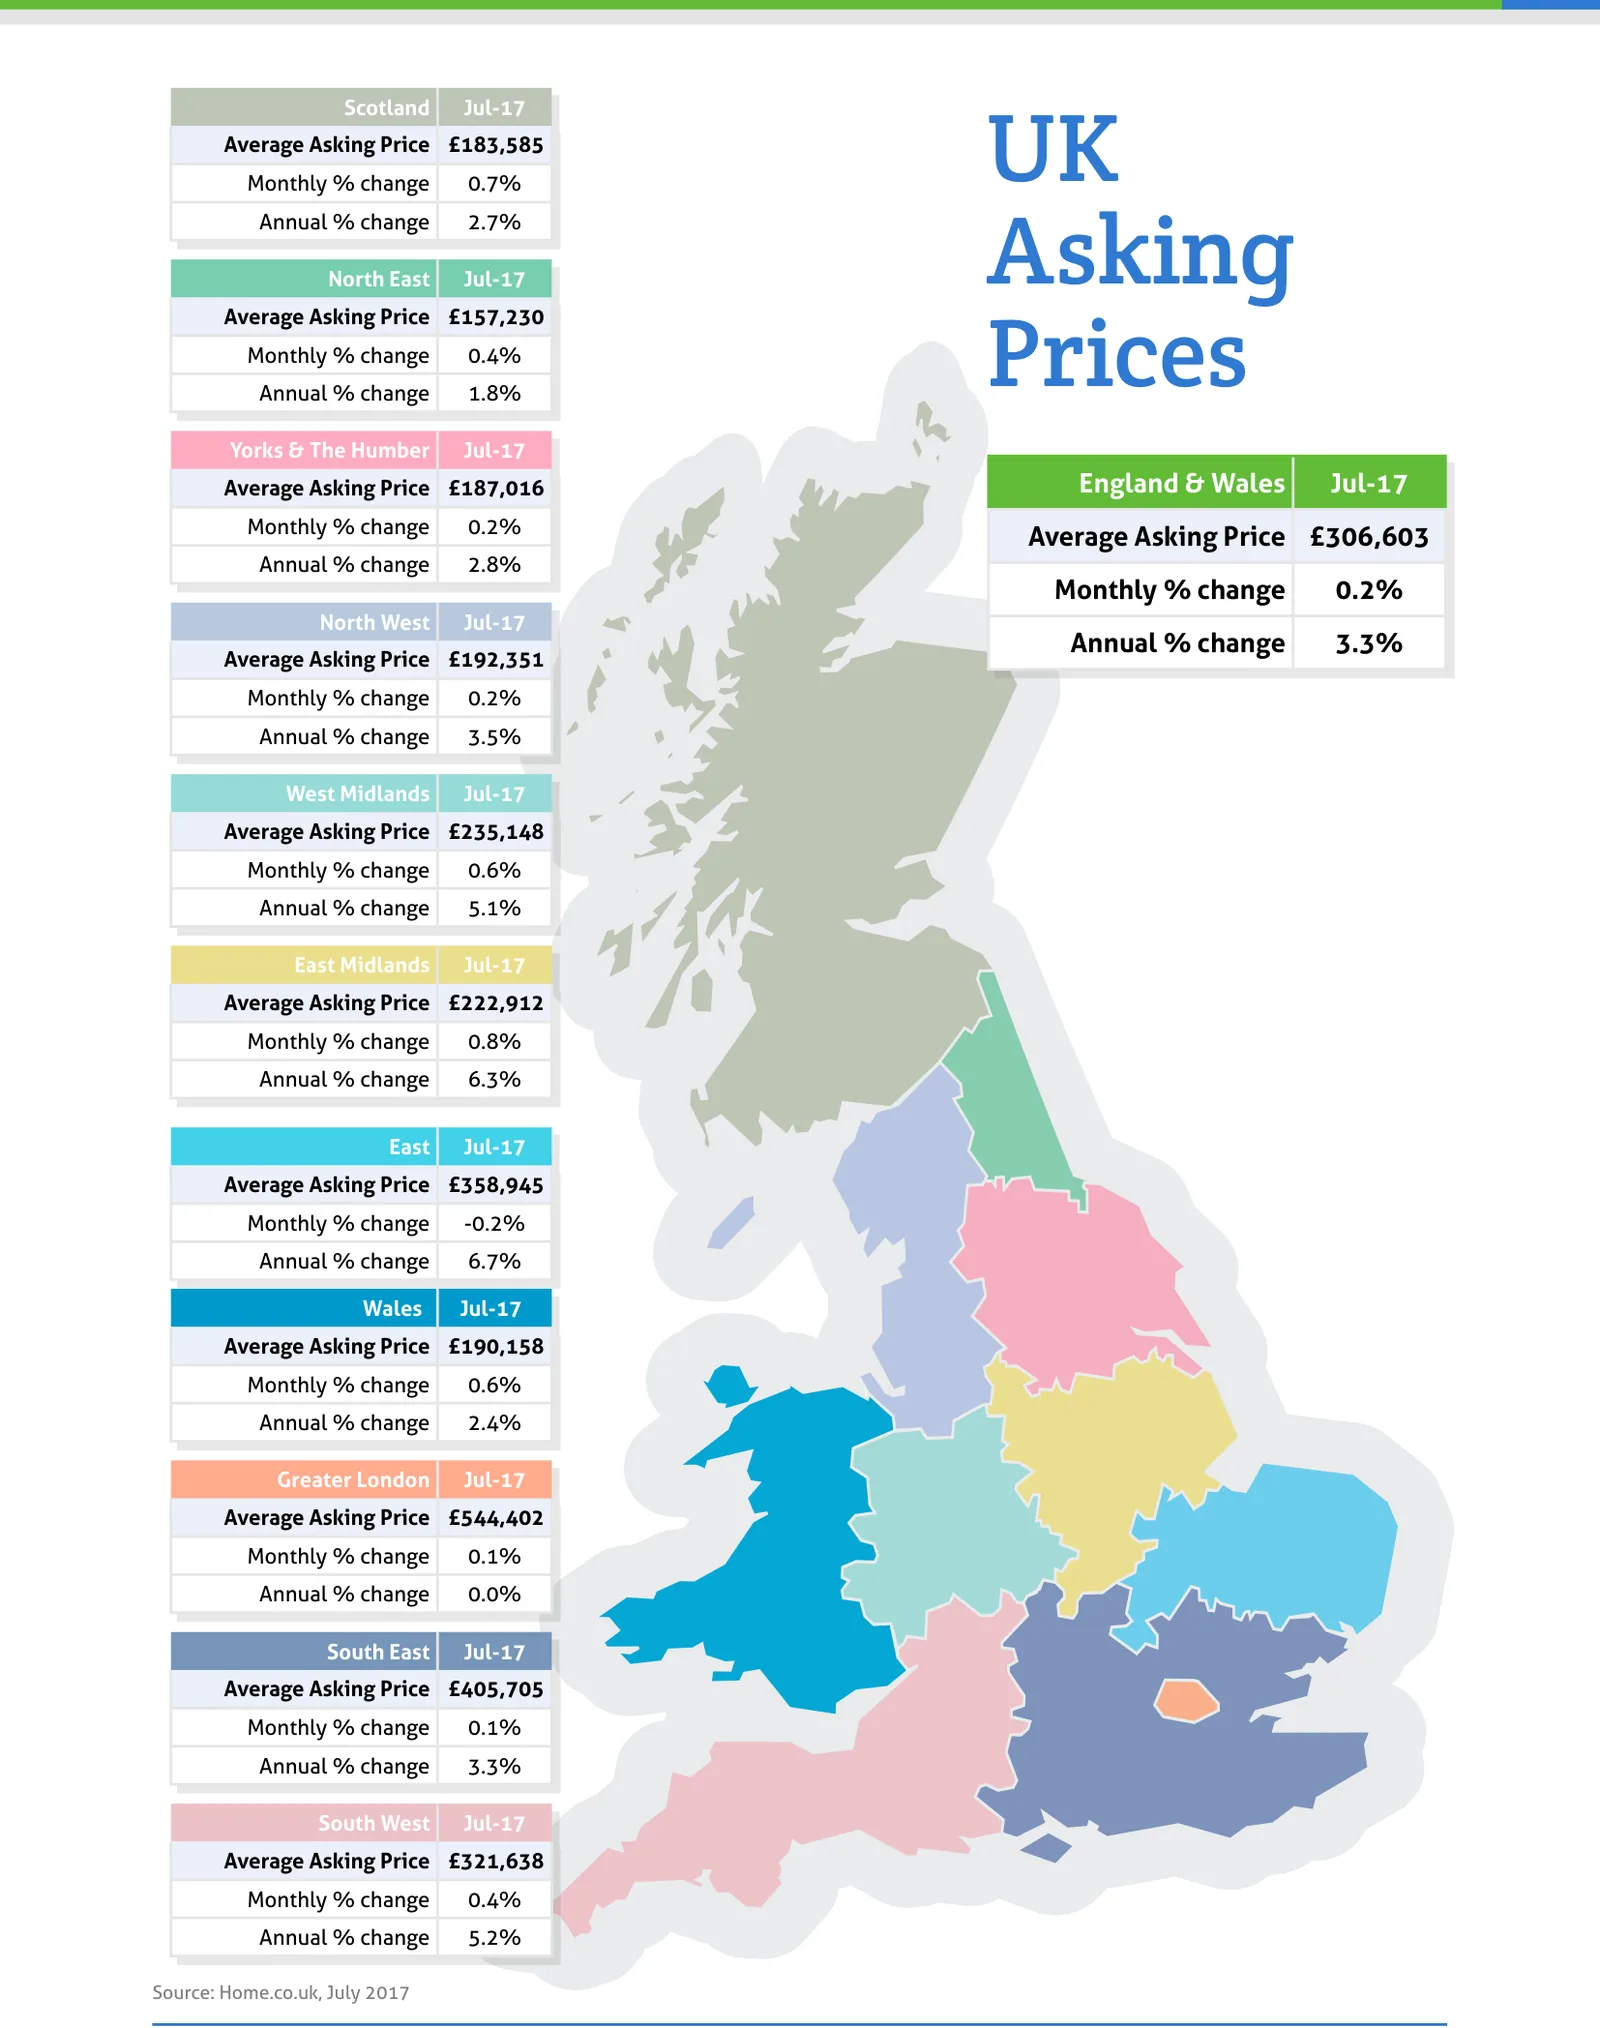
Source: Home.co.uk, July 2017
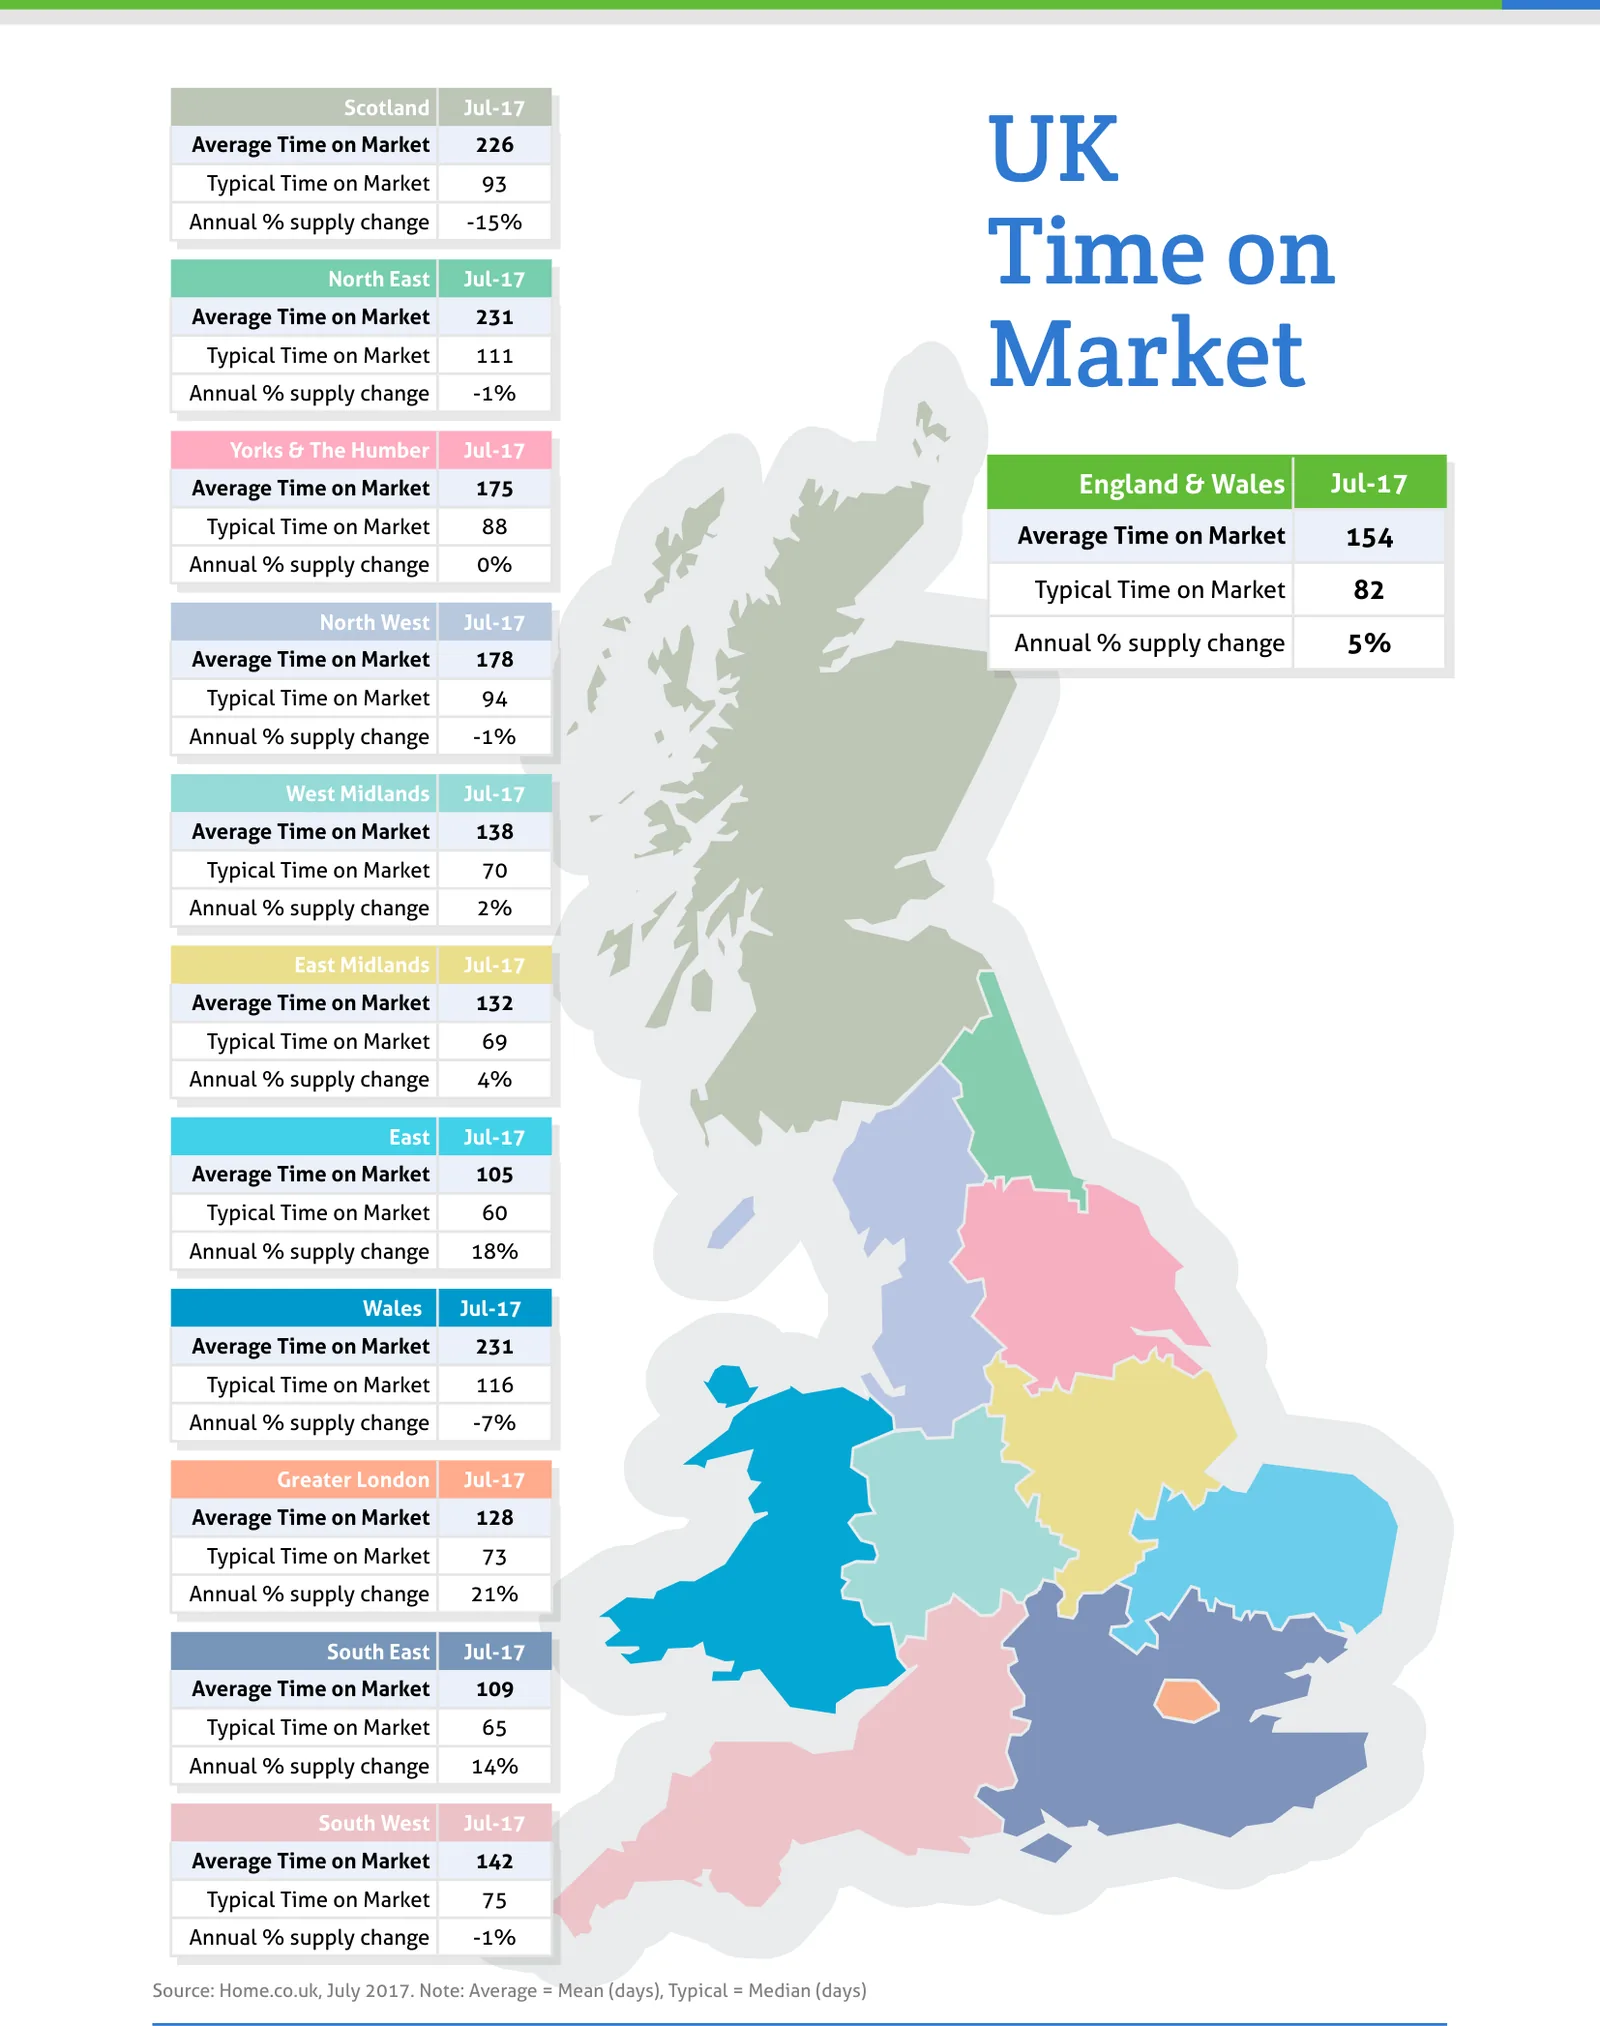
Source: Home.co.uk, July 2017. Note: Average = Mean (days), Typical = Median (days)
Regional tables
UK Asking Prices, Jul-17
| Region | Average Asking Price | Monthly % change | Annual % change |
|---|---|---|---|
| Scotland | £183,585 | 0.7% | 2.7% |
| North East | £157,230 | 0.4% | 1.8% |
| Yorks & The Humber | £187,016 | 0.2% | 2.8% |
| England & Wales | £306,603 | 0.2% | 3.3% |
| North West | £192,351 | 0.2% | 3.5% |
| West Midlands | £235,148 | 0.6% | 5.1% |
| East Midlands | £222,912 | 0.8% | 6.3% |
| East | £358,945 | -0.2% | 6.7% |
| Wales | £190,158 | 0.6% | 2.4% |
| Greater London | £544,402 | 0.1% | 0.0% |
| South East | £405,705 | 0.1% | 3.3% |
| South West | £321,638 | 0.4% | 5.2% |
UK Time on Market, Jul-17
| Region | Average Time on Market | Typical Time on Market | Annual % supply change |
|---|---|---|---|
| Scotland | 226 | 93 | -15% |
| North East | 231 | 111 | -1% |
| Yorks & The Humber | 175 | 88 | 0% |
| England & Wales | 154 | 82 | 5% |
| North West | 178 | 94 | -1% |
| West Midlands | 138 | 70 | 2% |
| East Midlands | 132 | 69 | 4% |
| East | 105 | 60 | 18% |
| Wales | 231 | 116 | -7% |
| Greater London | 128 | 73 | 21% |
| South East | 109 | 65 | 14% |
| South West | 142 | 75 | -1% |
From the director's commentary
"When property prices are rising more slowly than inflation, bricks and mortar becomes a much less attractive proposition for investors. Even with the promise of rental yield, investors in most parts of Greater London will be lucky not to be losing money in the current environment."
Doug Shephard, Director at Home.co.uk
Read the full July 2017 edition (PDF, 6 pages)
About the Home Asking Price Index
The Home Asking Price Index measures the change in the prices sellers ask for residential property across England, Wales and Scotland. Today it is computed every month from around half a million advertised homes and is mix-adjusted, so a change in what happens to be on the market does not move the figure; earlier editions state the sample they were built from. Because an asking price is set months before a sale completes, the index runs around five months ahead of completed-sale measures such as the UK House Price Index.
Every edition in the archive, back to October 2006, is listed on the index page. How we measure the UK property market explains the listing data behind it, and today's figures by area are on house prices and rental prices.
Text and figures above are quoted from the July 2017 edition as published, with punctuation normalised for the web, and are not revised. Later editions may restate them.
More in What is happening to house prices: the Home guide
Thinking about your next move?
See what your home's worth in seconds, with the UK's longest-running property data behind it.
Get an instant valuation