

























Home Asking Price Index, January 2023: stock drops as more vendors quit and prices bounce
Asking prices in England and Wales rose 0.6% in December, lifting annual growth to 1.9%, while total sales stock fell for the first time in twelve months.

This is the January 2023 edition of the Home Asking Price Index, released on 12 January 2023, under the headline:
Stock Drops as More Vendors Quit and Prices Bounce
The headlines and summary below are the report's own words, with the key figures as it published them, followed by the report's charts and regional tables as printed.
Headlines
- Asking prices across England and Wales surprise; recovering 0.6% during December following the shock drop of -2.4% in November, nudging the year-on-year growth up to 1.9%.
- Asking prices rose in every English region, Scotland and Wales during December.
- The number of properties withdrawn from the market soared in November, especially by vendors of upmarket properties.
- The total sales stock in England and Wales fell for the first time in 12 months (by 0.4%) due to a considerable number of vendors quitting the sales market.
- The supply of new instructions remains very moderate: 2% higher last month compared to December 2021 and 16% less than in December 2020.
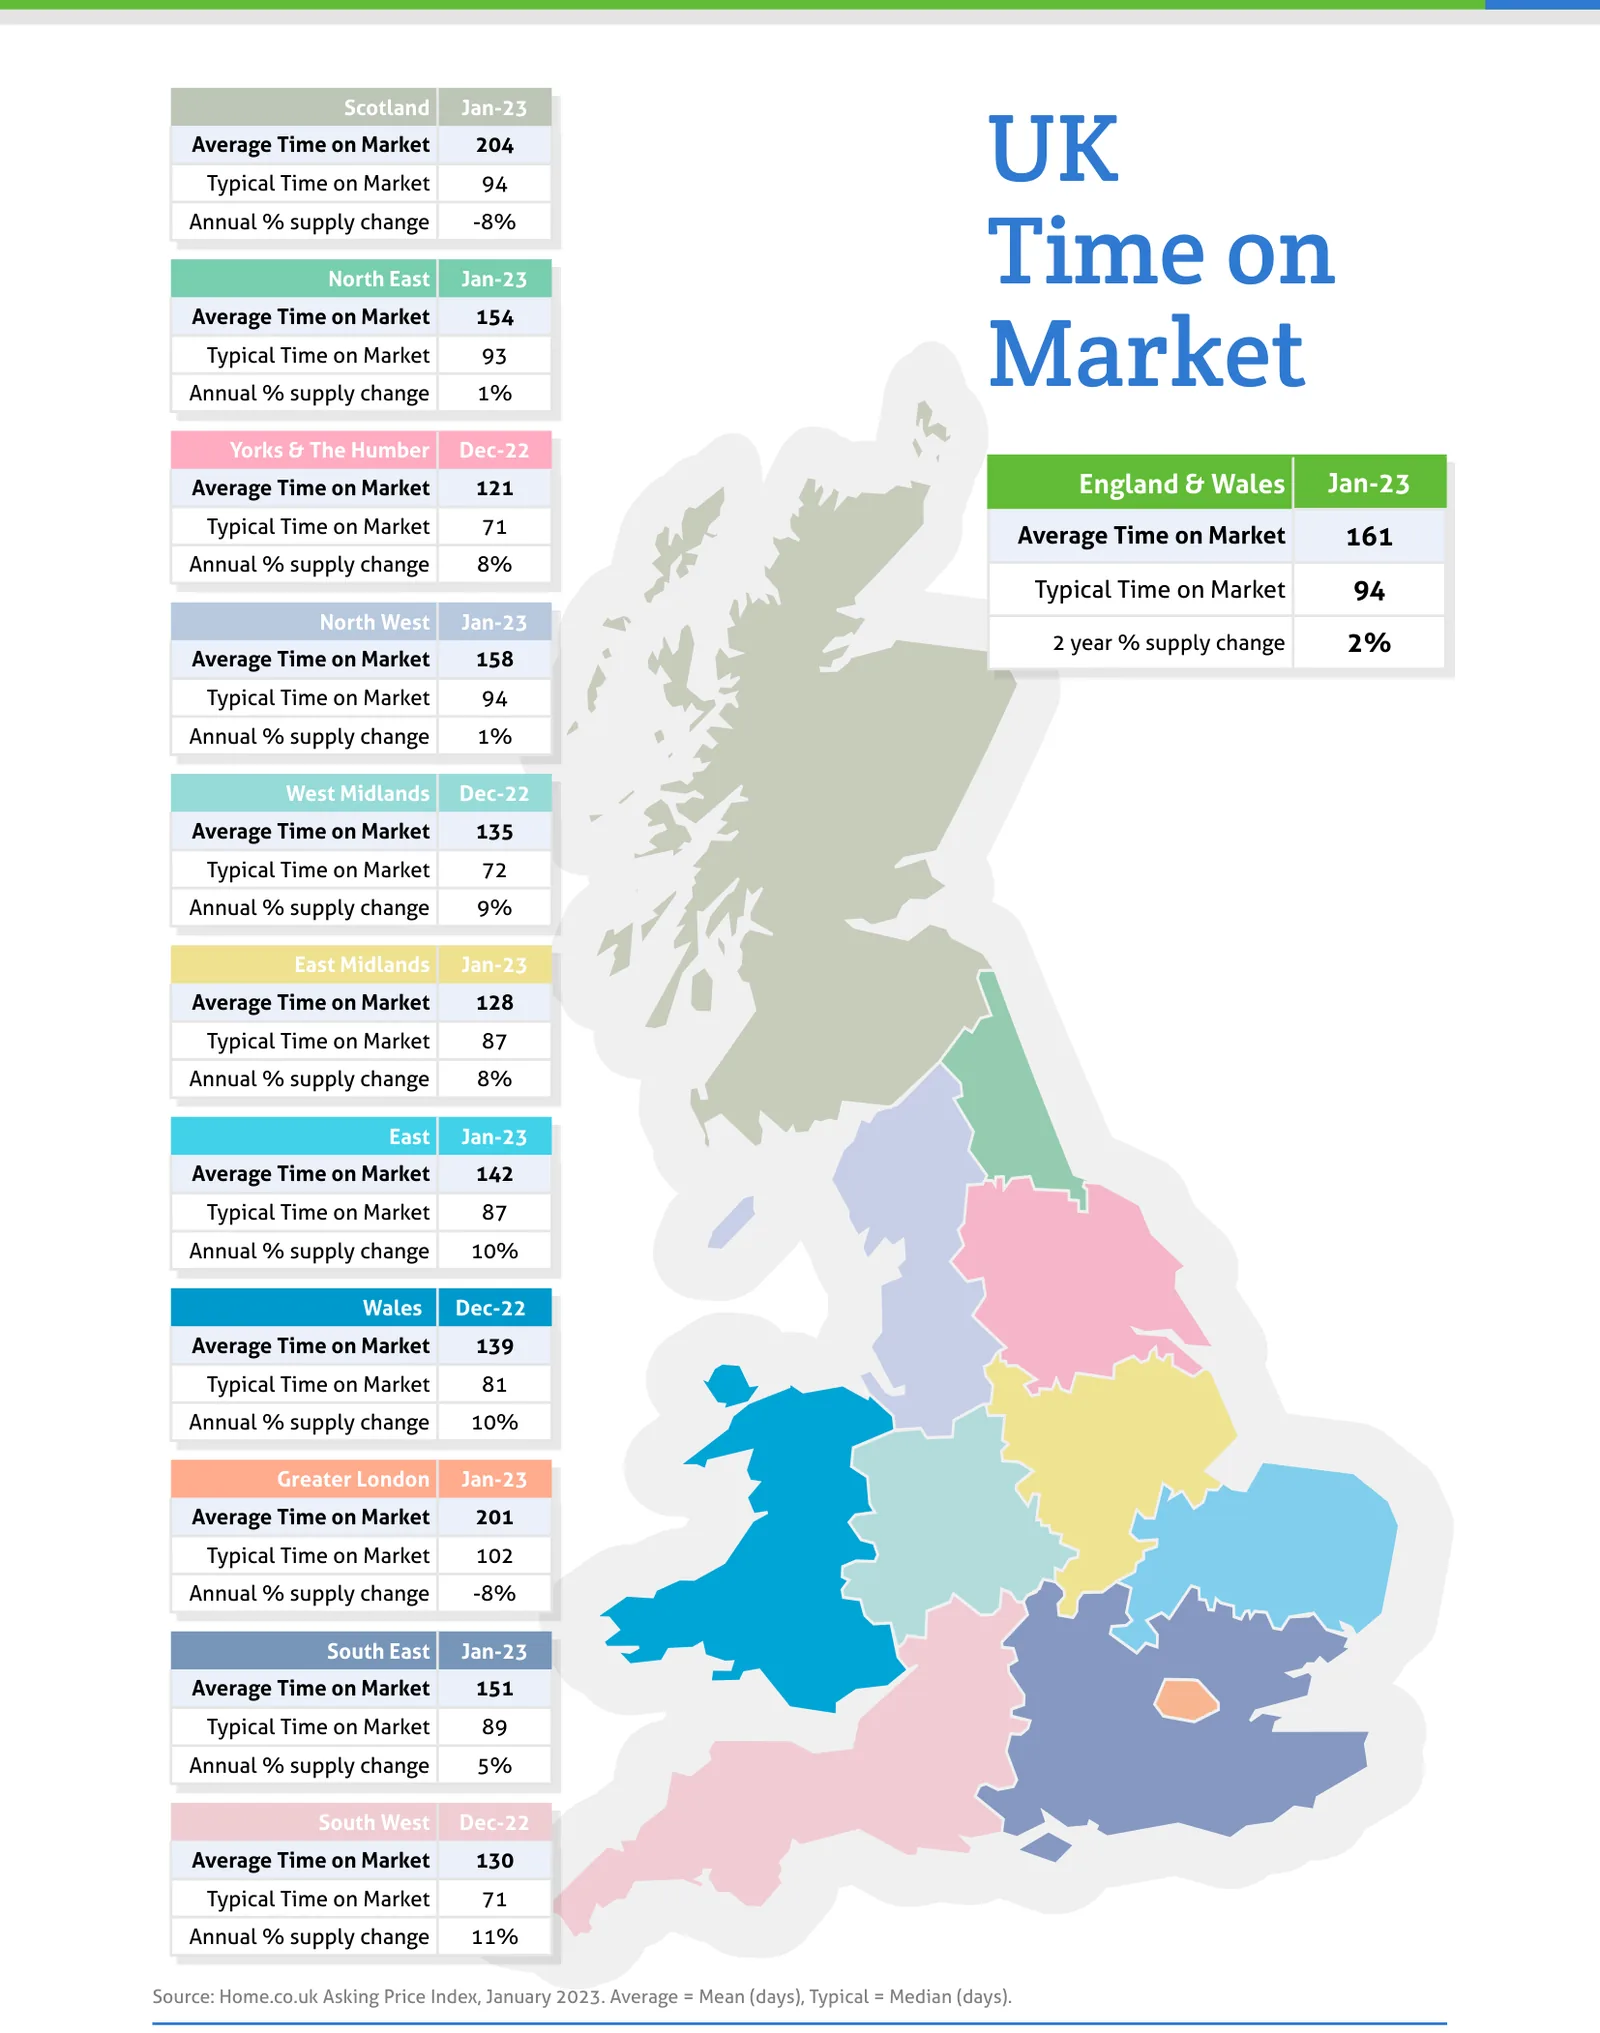
- The Typical Time on Market for unsold property in England and Wales jumped in line with seasonal expectations, adding 16 days to make the median 94 days. This is just two days more than in January 2022 and seven days less than in January 2021.
- Eight English regions and Wales now show elevated median marketing times compared to January 2022. Greater London and Scotland both show a year-on-year reduction.
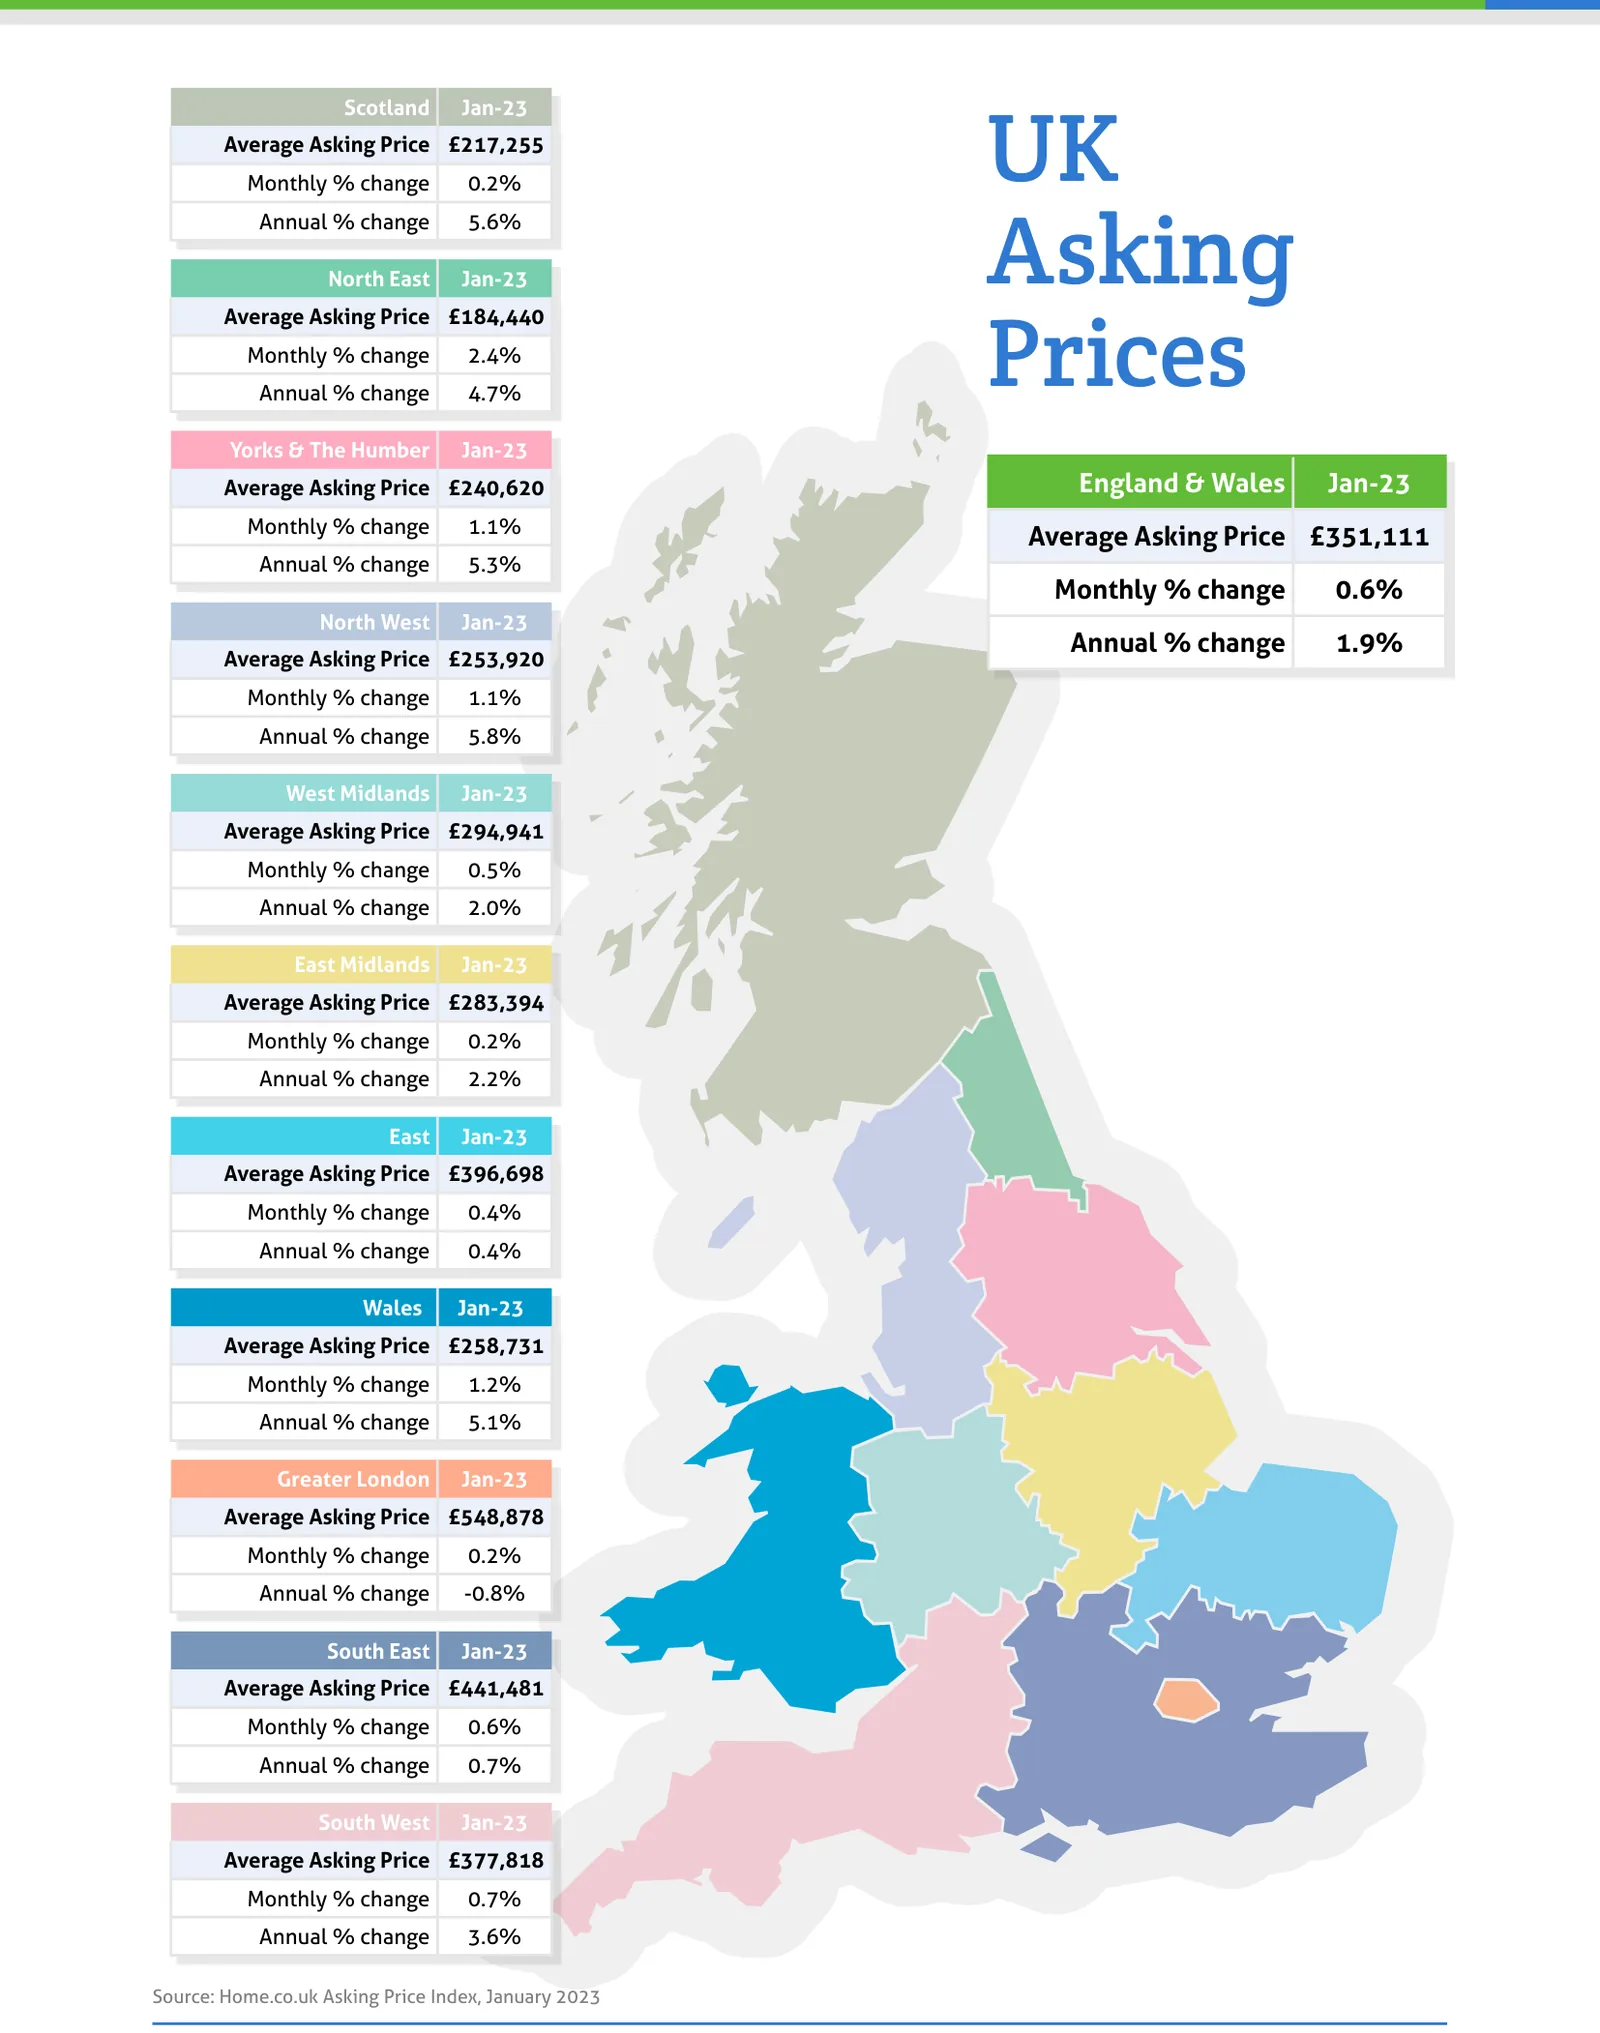
- The North West property market now leads in annualised regional price growth (5.8%), just ahead of Scotland at 5.6%.
- Monetary inflation dropped slightly to 16.1% (RPI ex. housing), suggesting that current real growth is around -15% year-on-year. Moreover, despite recent rises in mortgage costs, the real mortgage interest rate remains highly negative (around -10%) with respect to inflation.
- Rents across Greater London continue to rise overall (22% year-on-year) due to severe scarcity, but the pace is perhaps slowing slightly as affordability limits are reached. Such growth while property prices are stagnant means yields are improving rapidly.
- The current new growth leaders in asking rents are the boroughs of Brent, Hounslow and Lambeth (+37%, +37% and +35% annualised respectively).
Summary
The UK property market continues to adapt to a tougher lending environment and high inflation in the wake of the COVID property boom. Following last month's shock price drop, we observe a small price bounce this month, which may surprise some observers. Moreover, prices rose in all English regions and Scotland, which is highly unusual for this time of year and attests to the resilience of home values despite rising borrowing costs.
A large part of this resilience is due to the fact that property for sale remains scarce. The total sales stock actually fell slightly during December and is currently 17% below the 10-year average. The small reduction in stock during the slowest sales month of the year is a result of vendors withdrawing from the market. Speculative and opportunistic vendors are being purged from the post-boom marketplace. A further group of sellers with vacant possession will be opting to rent instead as the market continues to thrive, driven by scarcity and record rents. Supply of new instructions in December was restrained and certainly not indicative of a flood of panic sales.
Key figures
| Measure | Figure |
|---|---|
| Monthly change in asking prices | +0.6% |
| Annual change in asking prices | 1.9% |
| Typical Time on Market | 94 days |
| Change in total sales stock | -0.4% |
| Stock vs 10-year average | -17% |
| New instructions vs December 2021 | +2% |
| New instructions vs December 2020 | -16% |
| Monetary inflation (RPI ex. housing) | 16.1% |
Figures are for England and Wales unless the report states otherwise, as published in the edition.
Charts from the report
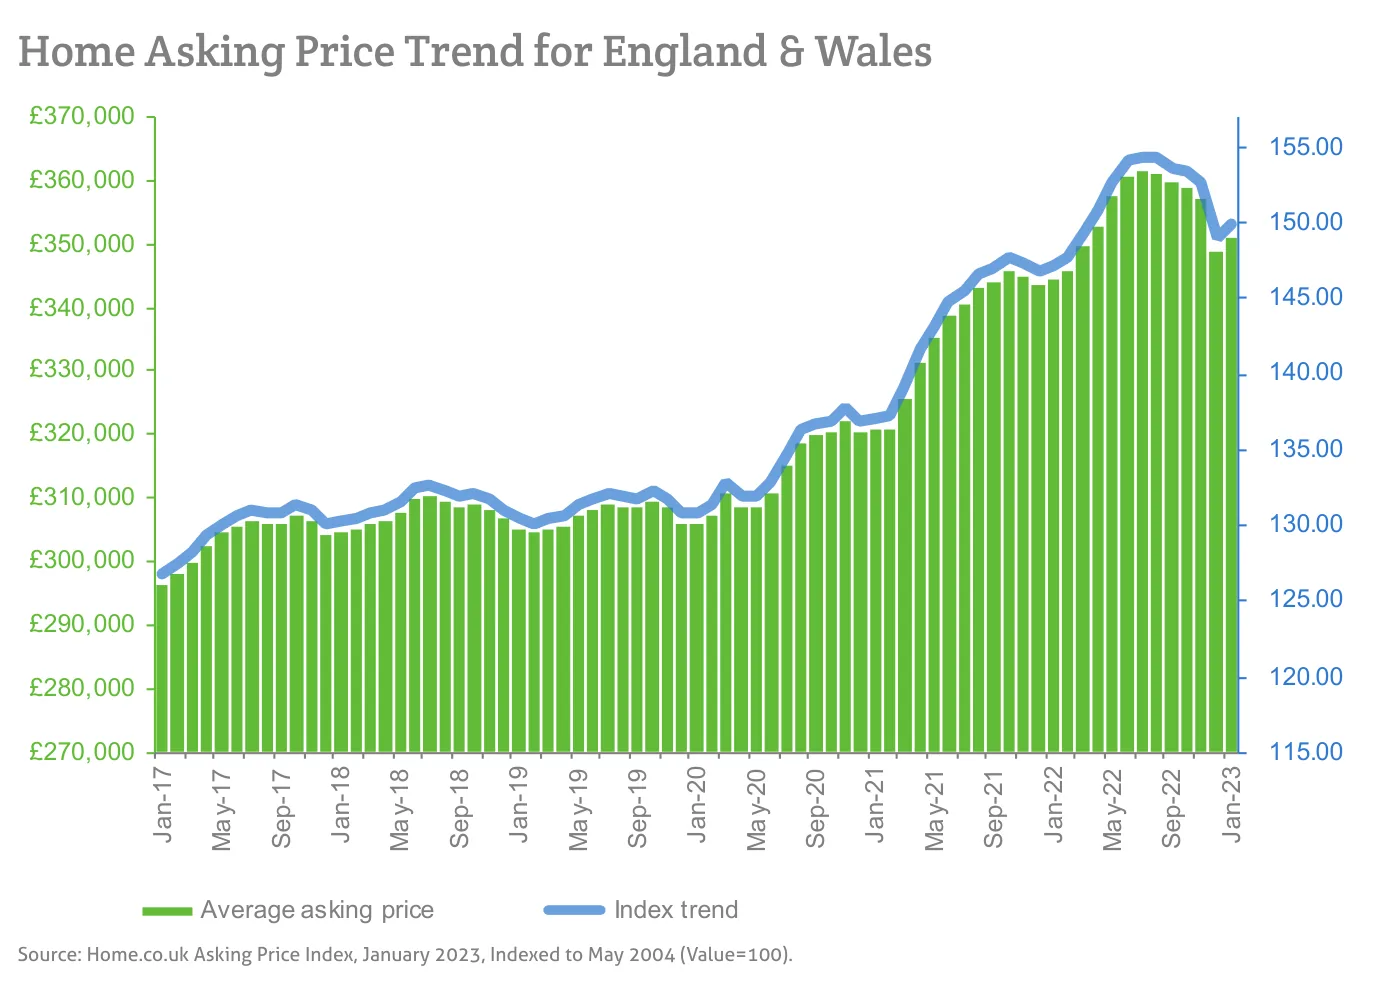
Source: Home.co.uk Asking Price Index, January 2023, Indexed to May 2004 (Value=100).
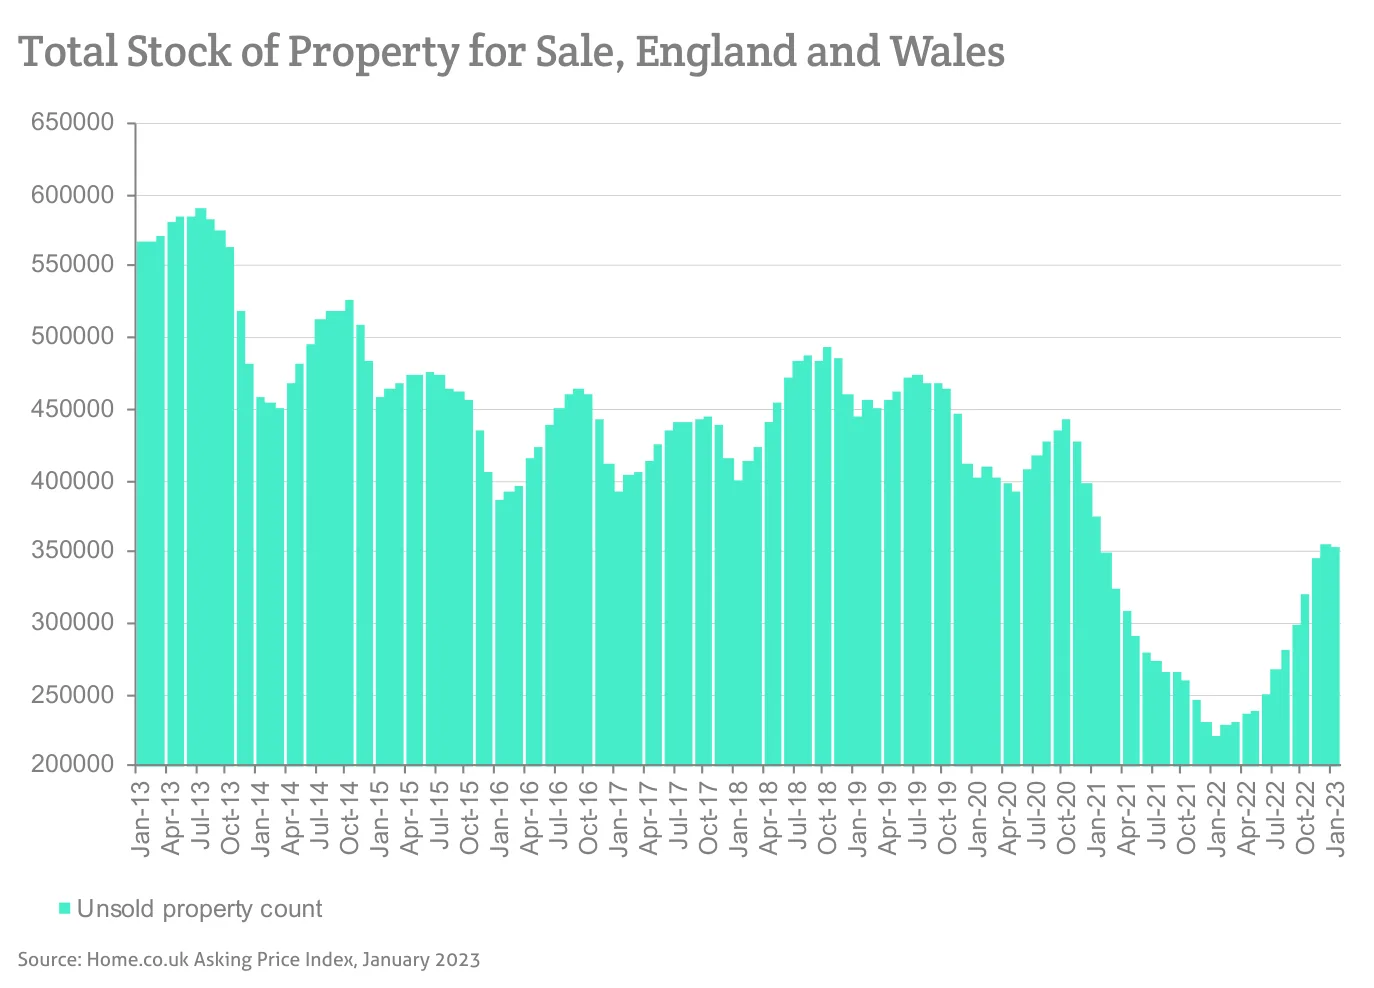
Source: Home.co.uk Asking Price Index, January 2023
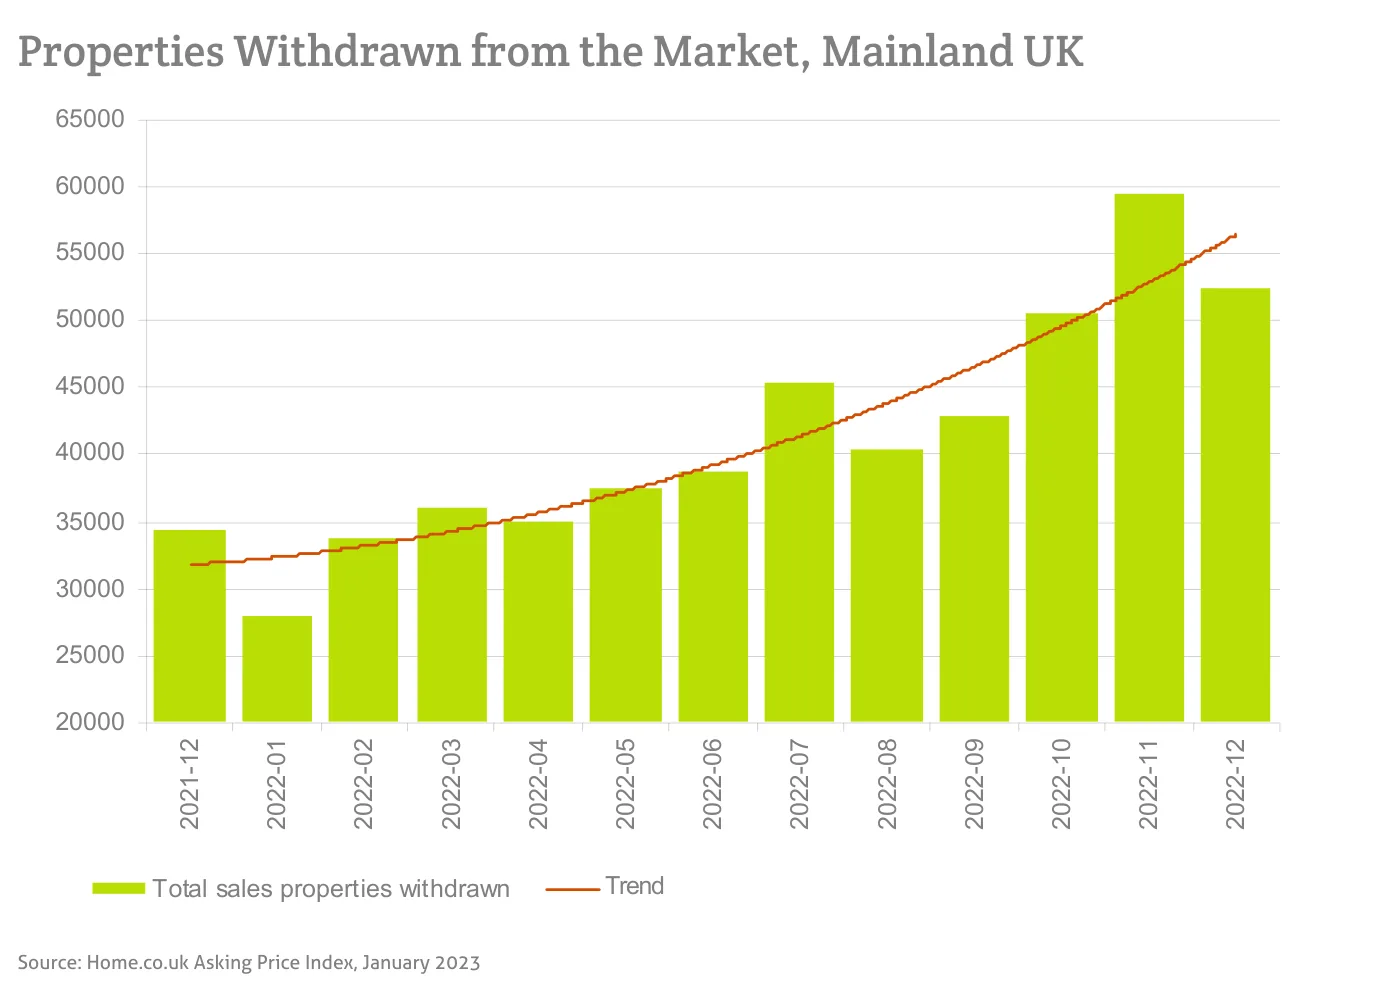
Source: Home.co.uk Asking Price Index, January 2023
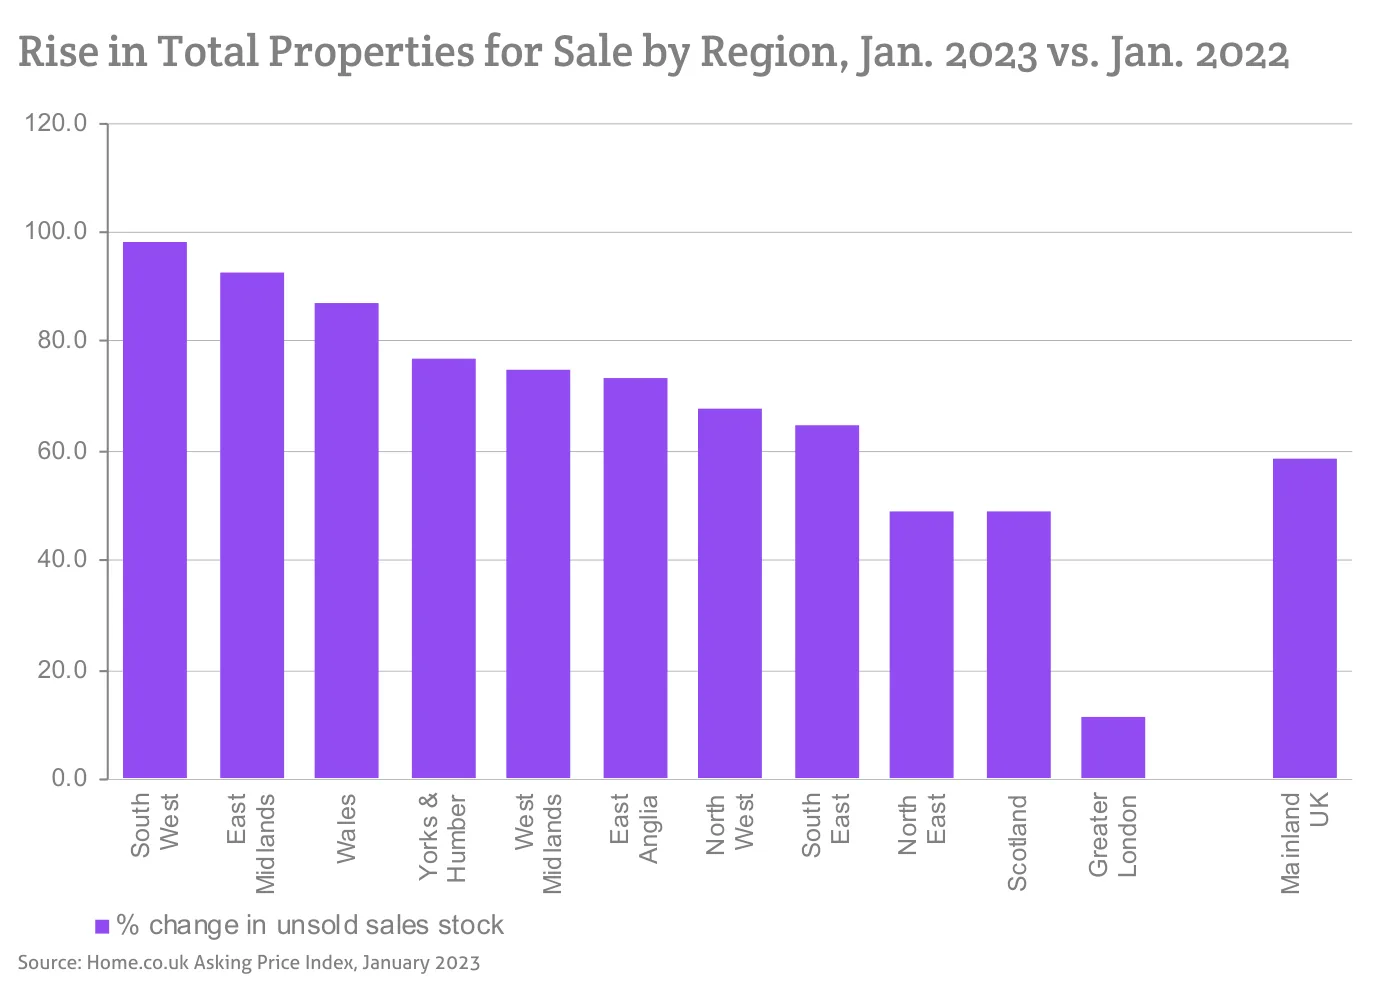
Source: Home.co.uk Asking Price Index, January 2023
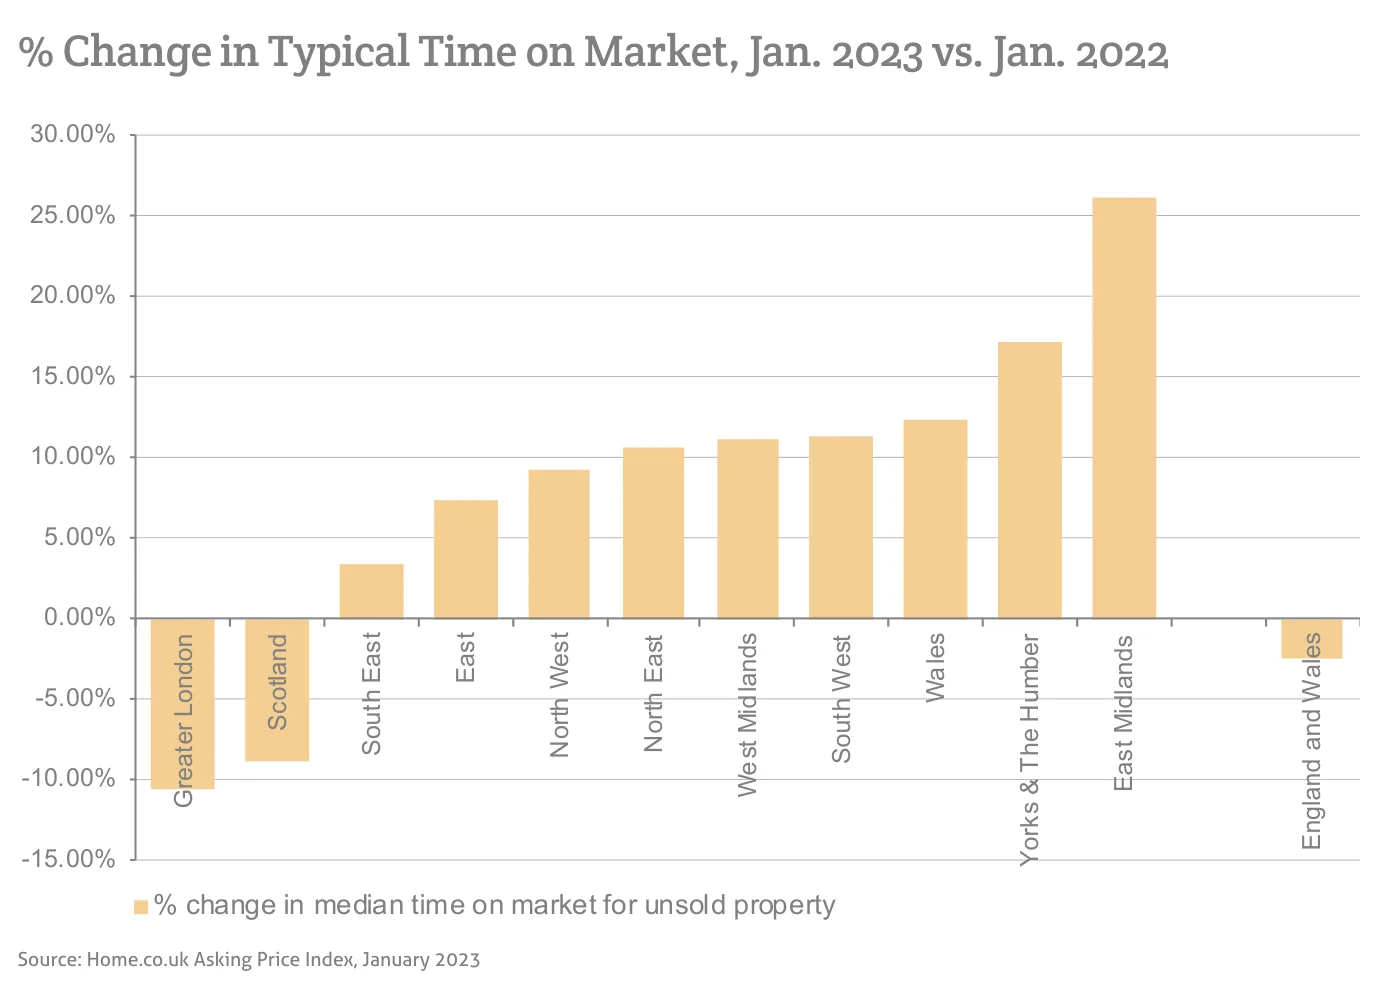
Source: Home.co.uk Asking Price Index, January 2023
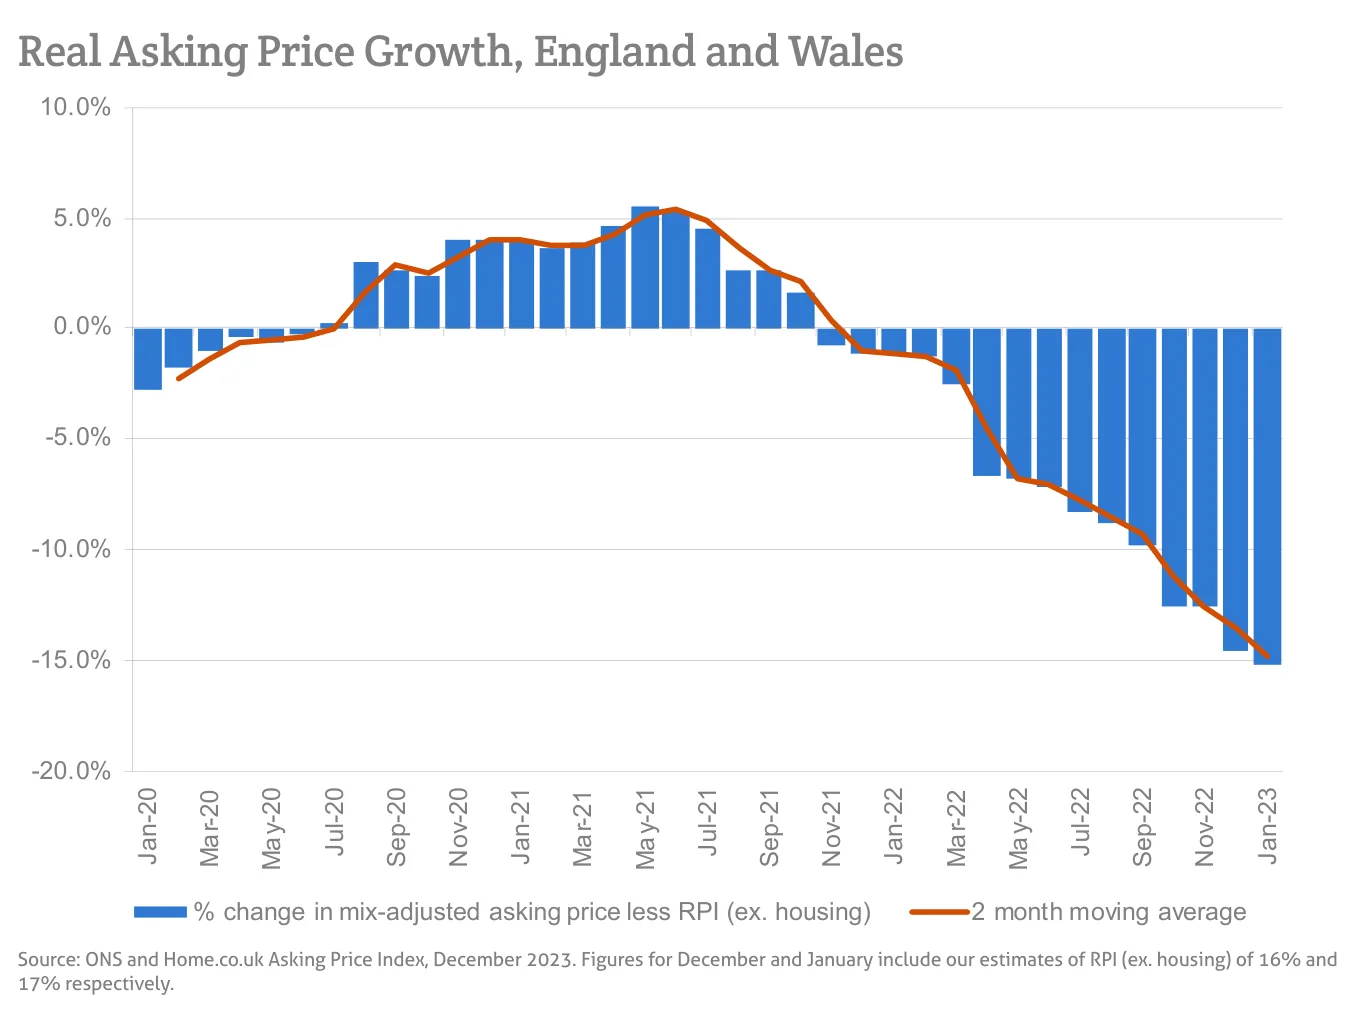
Source: ONS and Home.co.uk Asking Price Index, December 2023. Figures for December and January include our estimates of RPI (ex. housing) of 16% and
Source: Home.co.uk Asking Price Index, January 2023
Source: Home.co.uk Asking Price Index, January 2023. Average = Mean (days), Typical = Median (days).
Regional tables
UK Asking Prices, Jan-23
| Region | Average Asking Price | Monthly % change | Annual % change |
|---|---|---|---|
| Scotland | £217,255 | 0.2% | 5.6% |
| North East | £184,440 | 2.4% | 4.7% |
| Yorks & The Humber | £240,620 | 1.1% | 5.3% |
| England & Wales | £351,111 | 0.6% | 1.9% |
| North West | £253,920 | 1.1% | 5.8% |
| West Midlands | £294,941 | 0.5% | 2.0% |
| East Midlands | £283,394 | 0.2% | 2.2% |
| East | £396,698 | 0.4% | 0.4% |
| Wales | £258,731 | 1.2% | 5.1% |
| Greater London | £548,878 | 0.2% | -0.8% |
| South East | £441,481 | 0.6% | 0.7% |
| South West | £377,818 | 0.7% | 3.6% |
UK Time on Market, Jan-23
| Region | Average Time on Market | Typical Time on Market | Annual % supply change |
|---|---|---|---|
| Scotland | 204 | 94 | -8% |
| North East | 154 | 93 | 1% |
| Yorks & The Humber | 121 | 71 | 8% |
| England & Wales | 161 | 94 | |
| North West | 158 | 94 | 1% |
| West Midlands | 135 | 72 | 9% |
| East Midlands | 128 | 87 | 8% |
| East | 142 | 87 | 10% |
| Wales | 139 | 81 | 10% |
| Greater London | 201 | 102 | -8% |
| South East | 151 | 89 | 5% |
| South West | 130 | 71 | 11% |
The report also prints '2 year % supply change' in 1 of its 12 region boxes (England & Wales 2%), so it is not a column of this table.
From the director's commentary
"The current challenging state of the UK property market will offer new opportunities that may require a change of course, but I thoroughly recommend that you do your research and make sure the maths add up first."
Doug Shephard, Director at Home.co.uk
Read the full January 2023 edition (PDF, 11 pages)
About the Home Asking Price Index
The Home Asking Price Index measures the change in the prices sellers ask for residential property across England, Wales and Scotland. Today it is computed every month from around half a million advertised homes and is mix-adjusted, so a change in what happens to be on the market does not move the figure; earlier editions state the sample they were built from. Because an asking price is set months before a sale completes, the index runs around five months ahead of completed-sale measures such as the UK House Price Index.
Every edition in the archive, back to October 2006, is listed on the index page. How we measure the UK property market explains the listing data behind it, and today's figures by area are on house prices and rental prices.
Text and figures above are quoted from the January 2023 edition as published, with punctuation normalised for the web, and are not revised. Later editions may restate them.
More in What is happening to house prices: the Home guide
Thinking about your next move?
See what your home's worth in seconds, with the UK's longest-running property data behind it.
Get an instant valuation