 Buy
 Rent
 Sell
 New
 Prices






Home Asking Price Index, January 2020: scarcity primes the market for recovery
Asking prices across England and Wales rose 0.3% annually in January 2020, as new instructions fell to a five-year low and sales stock dropped 9.7% year on year.
In this article
This is the January 2020 edition of the Home Asking Price Index, released on 14 January 2020, under the headline:
Scarcity Primes the Market for Recovery
The headlines and summary below are the report's own words, with the key figures as it published them, followed by the report's charts and regional tables as printed.
Headlines
- London registered the lowest number of new instructions in any December in the history of this Index.
- The supply of new sales instructions in December plummeted to a 5-year low across the UK, as potential vendors sat on their hands or chose to let out their properties.
- The shortage is supporting asking prices. Market values remained unchanged overall for England and Wales, month on month, while significant increases were observed in London, the East Midlands, the North East and the North West.
- Scarcity is also rife in the rental sector as the supply of newly available rental property falls across the UK (down 15% year on year).
- The London lettings markets are worst hit by this alarming development (supply down 21% year on year) and rents are rocketing with twelve of the thirty-three boroughs showing annualised hikes above 10%.
- Overall, the average mix-adjusted asking price is up 0.3% across England and Wales since January 2019.
- The total sales stock continues to diminish across England and Wales, down by 9.7% year on year.
- Typical Time on Market for England and Wales is nine days longer than in January 2019, likely a post-election artefact; we expect this measure to fall markedly as we move towards the spring market.
- At the regional level, typical Time on Market rises indicate that the worst post-boom slowdowns continue to be in the East of England (+13%) and the South West (+12%), year on year.
- East of England remains the UK's worst-performing region with prices suffering an extended post-boom correction: The average asking price for the region has fallen by 2.6% over the last twelve months.
Summary
With the election out of the way, home prices are up 0.3% year on year but flat month on month. Confidence amongst vendors, as shown by this month's price rises, is highest in London, the Midlands and the North. Moreover, reduced political uncertainty and talk of a possible rate cut by the Bank of England will bolster buyer confidence going forward and thereby increase demand throughout 2020.
Annualised price growth across England and Wales currently stands at +0.3%; in January 2019, the annualised rate of increase of home prices was 0.2%.
Key figures
| Measure | Figure |
|---|---|
| Average asking price (England & Wales) | £306,221 |
| Monthly change (England & Wales) | 0.0% |
| Annual change (England & Wales) | 0.3% |
| Total sales stock, annual change | -9.7% |
| Rental supply, annual change (UK) | -15% |
| Typical Time on Market | nine days longer than January 2019 |
Figures are for England and Wales unless the report states otherwise, as published in the edition.
Charts from the report
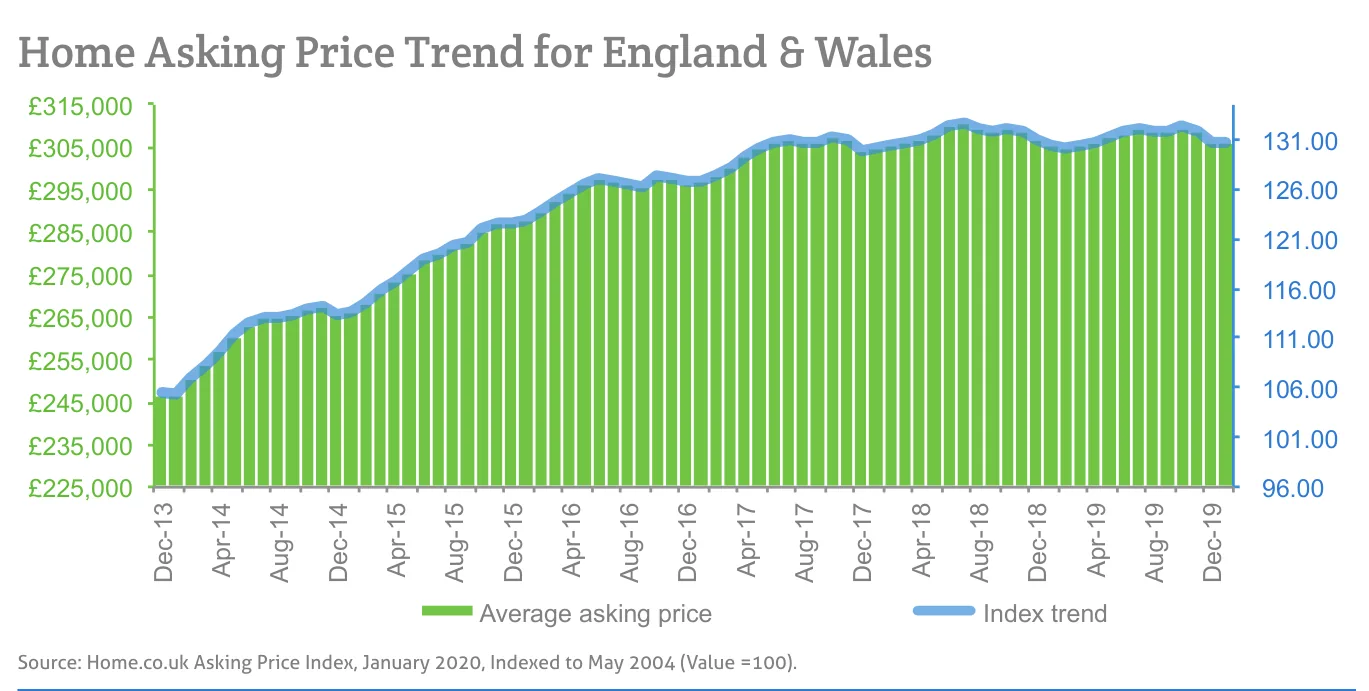
Source: Home.co.uk Asking Price Index, January 2020, Indexed to May 2004 (Value =100).
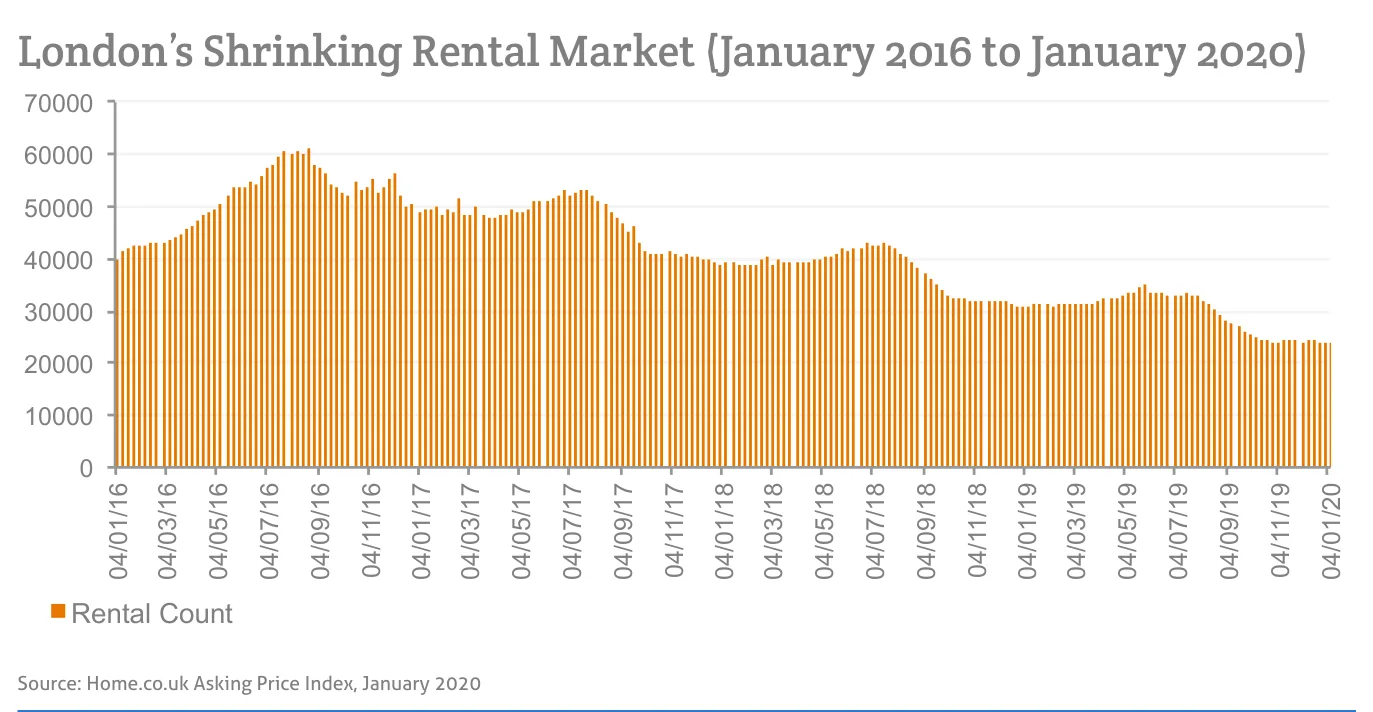
Source: Home.co.uk Asking Price Index, January 2020
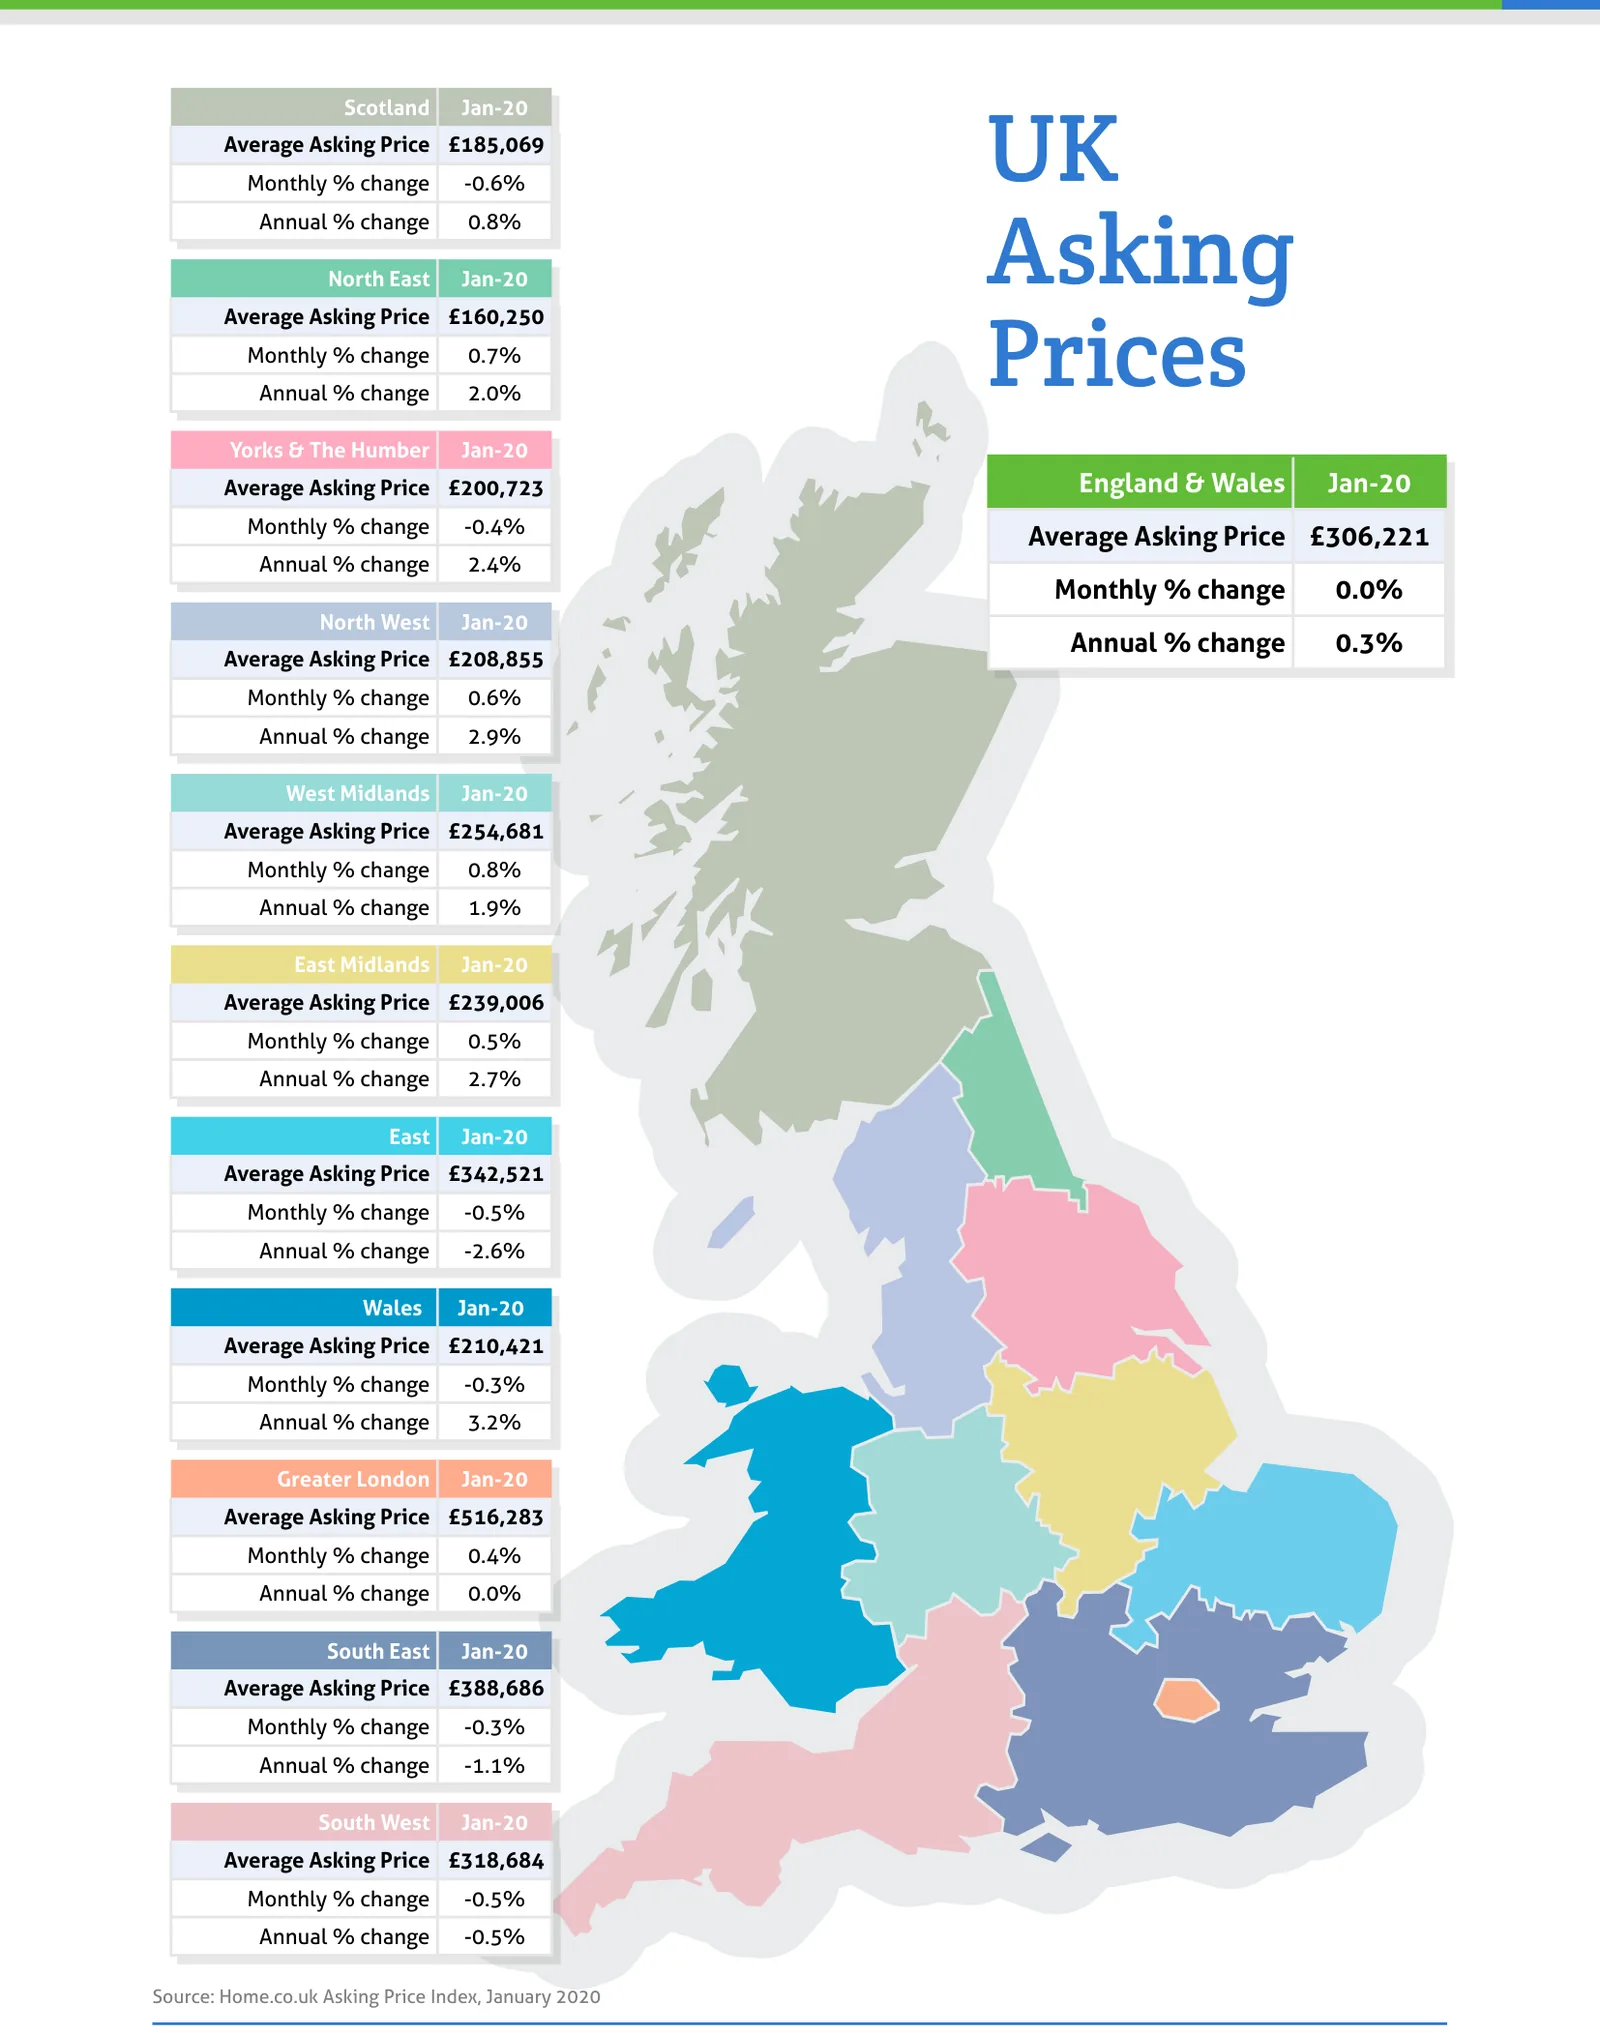
Source: Home.co.uk Asking Price Index, January 2020
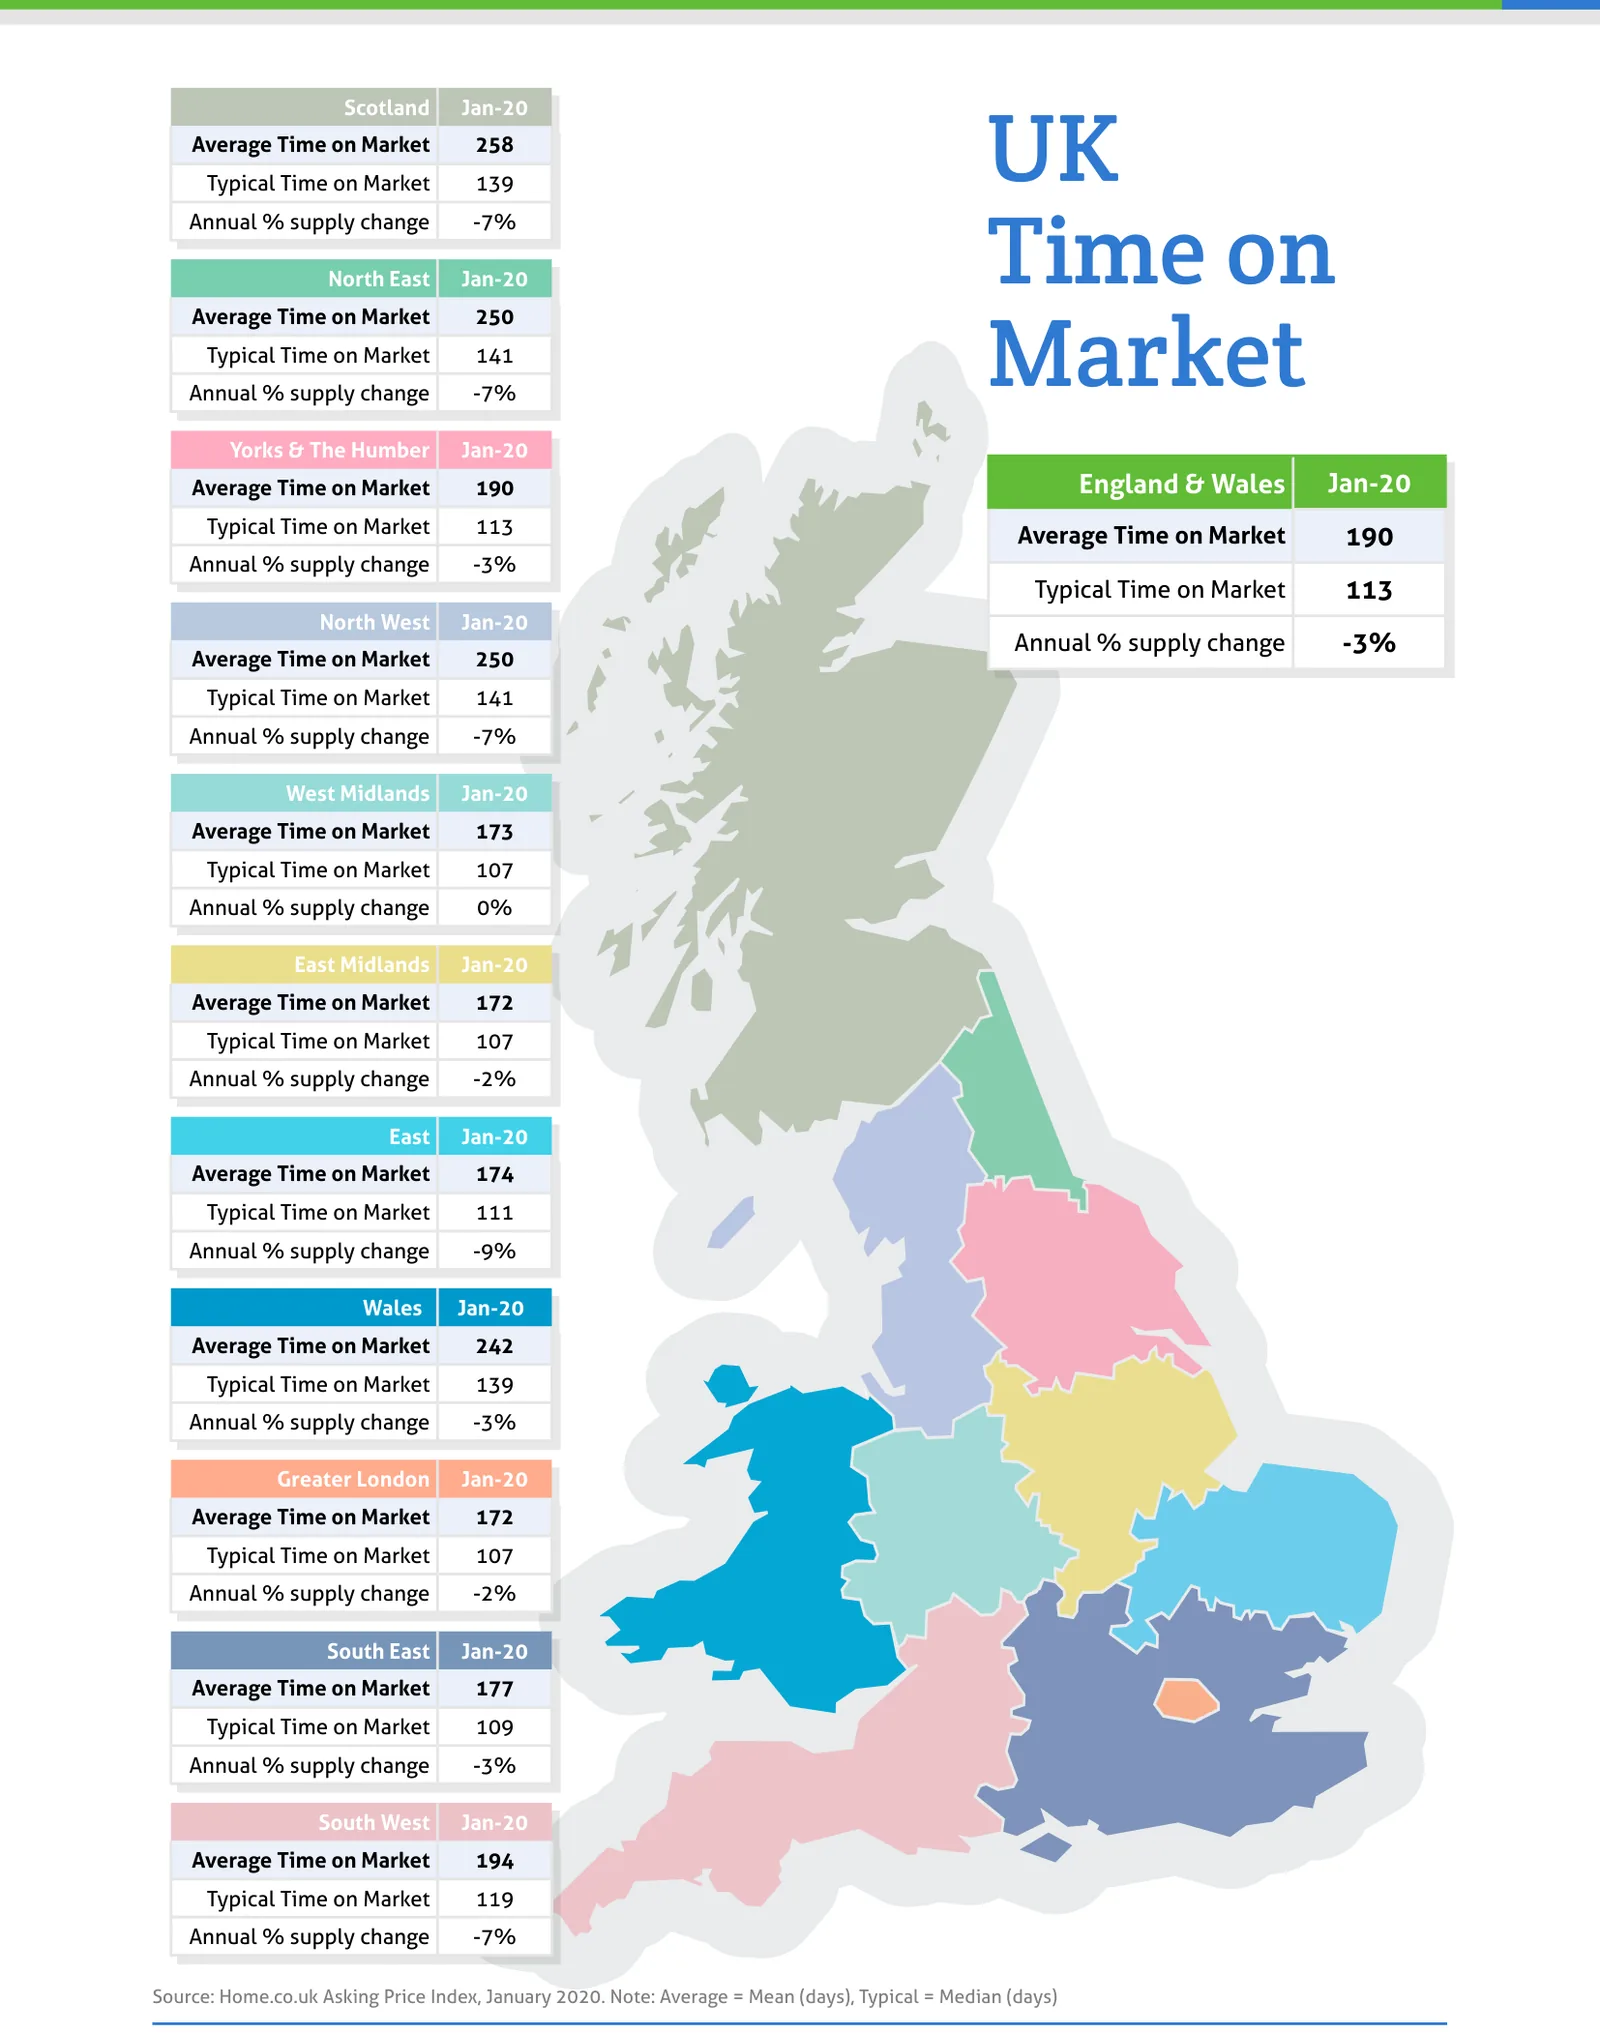
Source: Home.co.uk Asking Price Index, January 2020. Note: Average = Mean (days), Typical = Median (days)
Regional tables
UK Asking Prices, Jan-20
| Region | Average Asking Price | Monthly % change | Annual % change |
|---|---|---|---|
| Scotland | £185,069 | -0.6% | 0.8% |
| North East | £160,250 | 0.7% | 2.0% |
| Yorks & The Humber | £200,723 | -0.4% | 2.4% |
| England & Wales | £306,221 | 0.0% | 0.3% |
| North West | £208,855 | 0.6% | 2.9% |
| West Midlands | £254,681 | 0.8% | 1.9% |
| East Midlands | £239,006 | 0.5% | 2.7% |
| East | £342,521 | -0.5% | -2.6% |
| Wales | £210,421 | -0.3% | 3.2% |
| Greater London | £516,283 | 0.4% | 0.0% |
| South East | £388,686 | -0.3% | -1.1% |
| South West | £318,684 | -0.5% | -0.5% |
UK Time on Market, Jan-20
| Region | Average Time on Market | Typical Time on Market | Annual % supply change |
|---|---|---|---|
| Scotland | 258 | 139 | -7% |
| North East | 250 | 141 | -7% |
| Yorks & The Humber | 190 | 113 | -3% |
| England & Wales | 190 | 113 | -3% |
| North West | 250 | 141 | -7% |
| West Midlands | 173 | 107 | 0% |
| East Midlands | 172 | 107 | -2% |
| East | 174 | 111 | -9% |
| Wales | 242 | 139 | -3% |
| Greater London | 172 | 107 | -2% |
| South East | 177 | 109 | -3% |
| South West | 194 | 119 | -7% |
From the director's commentary
"Now, rents are soaring and prices are beginning to pick up in the UK's leading market. As predicted, scarcity will be the key driver of the 2020 property market."
Doug Shephard, Director at Home.co.uk
Read the full January 2020 edition (PDF, 6 pages)
About the Home Asking Price Index
The Home Asking Price Index measures the change in the prices sellers ask for residential property across England, Wales and Scotland. Today it is computed every month from around half a million advertised homes and is mix-adjusted, so a change in what happens to be on the market does not move the figure; earlier editions state the sample they were built from. Because an asking price is set months before a sale completes, the index runs around five months ahead of completed-sale measures such as the UK House Price Index.
Every edition in the archive, back to October 2006, is listed on the index page. How we measure the UK property market explains the listing data behind it, and today's figures by area are on house prices and rental prices.
Text and figures above are quoted from the January 2020 edition as published, with punctuation normalised for the web, and are not revised. Later editions may restate them.